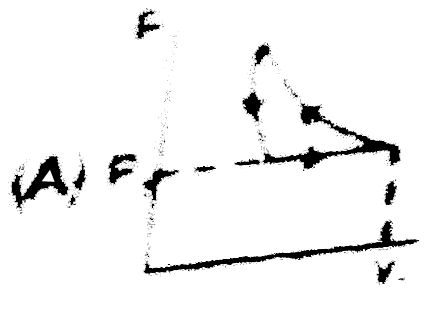
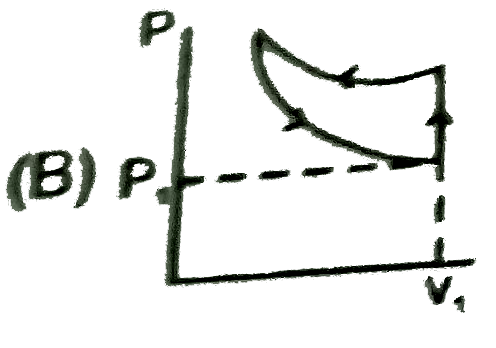
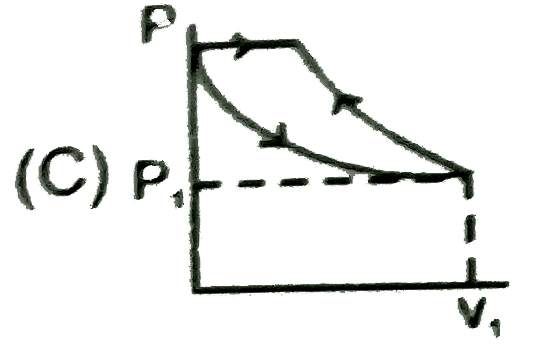
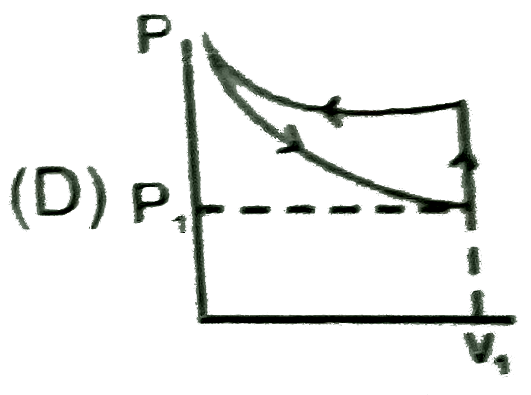
A certain mass of an ideal gas is at pressure P1 and volume V1. If is compressed isothermally and then allowed to expand adiabatically untill its pressure returns to P1. The gas is then allowed to expand its original volume. Which of the following P−V graphs are these process correctly shown?


The correct Answer is:A
To solve the problem, we need to analyze the processes that the ideal gas undergoes and how they are represented on a P-V graph. The processes are:
1. Isothermal Compression: The gas is compressed at a constant temperature.
2. Adiabatic Expansion: The gas expands without heat exchange with the surroundings until it returns to its initial pressure P1.
3. Expansion to Original Volume: The gas expands to its original volume V1.
Step 1: Initial State
- The gas starts at pressure P1 and volume V1. This point is our starting point on the graph.
Step 2: Isothermal Compression
- During isothermal compression, the gas's volume decreases while the pressure increases, but the temperature remains constant. This process is represented by a downward curve on the P-V graph.
- The curve will start from point (V1,P1) and move to a new point (V2,P2) where V2<V1 and P2>P1.
Step 3: Adiabatic Expansion
- After the isothermal compression, the gas undergoes adiabatic expansion. In this process, the gas expands and does work on the surroundings without any heat exchange, resulting in a decrease in pressure.
- This process will be represented by a steeper curve moving from point (V2,P2) to a new point (V3,P1) where the pressure returns to P1 but the volume V3>V2.
Step 4: Expansion to Original Volume
- Finally, the gas expands to its original volume V1 at constant pressure P1. This is represented by a horizontal line moving from (V3,P1) to (V1,P1).
Step 5: Complete P-V Graph
- The complete P-V graph will show:
- A downward curve for isothermal compression from (V1,P1) to (V2,P2).
- A steeper downward curve for adiabatic expansion from (V2,P2) to (V3,P1).
- A horizontal line from (V3,P1) to (V1,P1).
Conclusion
The correct P-V graph that represents these processes is option A.
2. Adiabatic Expansion: The gas expands without heat exchange with the surroundings until it returns to its initial pressure P1.
3. Expansion to Original Volume: The gas expands to its original volume V1.
- The gas starts at pressure P1 and volume V1. This point is our starting point on the graph.
- During isothermal compression, the gas's volume decreases while the pressure increases, but the temperature remains constant. This process is represented by a downward curve on the P-V graph.
- The curve will start from point (V1,P1) and move to a new point (V2,P2) where V2<V1 and P2>P1.
- After the isothermal compression, the gas undergoes adiabatic expansion. In this process, the gas expands and does work on the surroundings without any heat exchange, resulting in a decrease in pressure.
- This process will be represented by a steeper curve moving from point (V2,P2) to a new point (V3,P1) where the pressure returns to P1 but the volume V3>V2.
- Finally, the gas expands to its original volume V1 at constant pressure P1. This is represented by a horizontal line moving from (V3,P1) to (V1,P1).
- The complete P-V graph will show:
- A downward curve for isothermal compression from (V1,P1) to (V2,P2).
- A steeper downward curve for adiabatic expansion from (V2,P2) to (V3,P1).
- A horizontal line from (V3,P1) to (V1,P1).
The correct P-V graph that represents these processes is option A.
Topper's Solved these Questions
- KTG & THERMODYNAMICSBook:RESONANCEChapter:KTG & THERMODYNAMICSExercise:SECTION (D)
Explore 2 Videos
- KTG & THERMODYNAMICSBook:RESONANCEChapter:KTG & THERMODYNAMICSExercise:SECTION (I)
Explore 2 Videos
- KTG & THERMODYNAMICSBook:RESONANCEChapter:KTG & THERMODYNAMICSExercise:SECTION (A)
Explore 3 Videos
- KINETIC THEORY OF GASES AND THERMODYNAMICSBook:RESONANCEChapter:KINETIC THEORY OF GASES AND THERMODYNAMICSExercise:Exercise
Explore 64 Videos
- MAGNETIC FIELD AND FORCESBook:RESONANCEChapter:MAGNETIC FIELD AND FORCESExercise:Exercise
Explore 65 Videos
Similar Questions
A monoatomic gas at pressure P1 and volume V1 is compressed adiabatically to 18th of its original volume. What is the final pressure of gas.
View SolutionA certain quantity of oxygen (γ=7/5) is comparessed isothermally until its pressure is doubled (P2) . The gas is then allowed to expand adiabatically until its original valume is restored. Then the final pressure (P3) in terms of initial pressure (P1) is
View Solution
Knowledge Check
A monoatomic gas at pressure P1 and volume V1 is compressed adiabatically to 18th of its original volume. What is the final pressure of gas.
A64P1BP1C16P1D32P1A monatomic gas at pressure P1 and volume V1 is compressed adiabatically to 1(8)th of its original volume. What is the ginal pressure of the gas ?
A64P1BP1C16P1D32P1A mass of ideal gas at pressure P is expanded isothermally to four times the original volume and then slowly compressed adiabatically to its original volume. Assuming γ to be 1.5, the new pressure of the gas is
A2PBPC4PDP/2
Diatomic gas at pressure 'P' and volume 'V' is compressed adiabatically to 1/32 times the original volume. Then the final pressure is
View SolutionA given mass of gas is compressed isothermally untal its pressure is doubled. It is then allowed to expand adiabatically until its original volume is restore and its pressure is then found to be 0.75 of its initial pressure. The ratio of the specific heats of the gas is approximately
View SolutionA monatomic gas at a pressure P, having a volume V expands isothermally to a volume 2 V and then adiabatically to a volume 16 V. The final pressure of the gas is ( take γ=53)
View SolutionA given mass of a gas is compressed isothermally until its pressure is doubled. It is then allowed to expand adiabatically until its original voume is restored and its pressure is then found to be 0.75 of its initial pressure. The ratio of the specific heats of the gas is approximately.
View SolutionA monatomic gas at a pressure P, having a volume V expands isothermally to a volume 2 V and then adiabatically to a volume 16 V. The final pressure of the gas is ( take γ=53)
View Solution