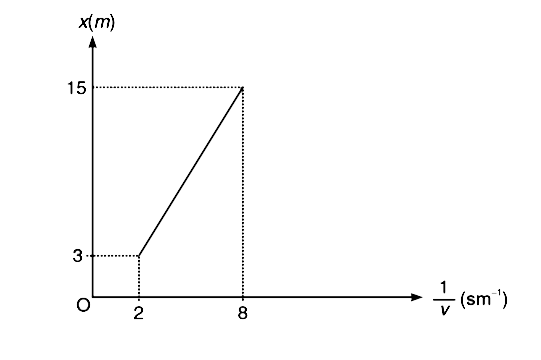
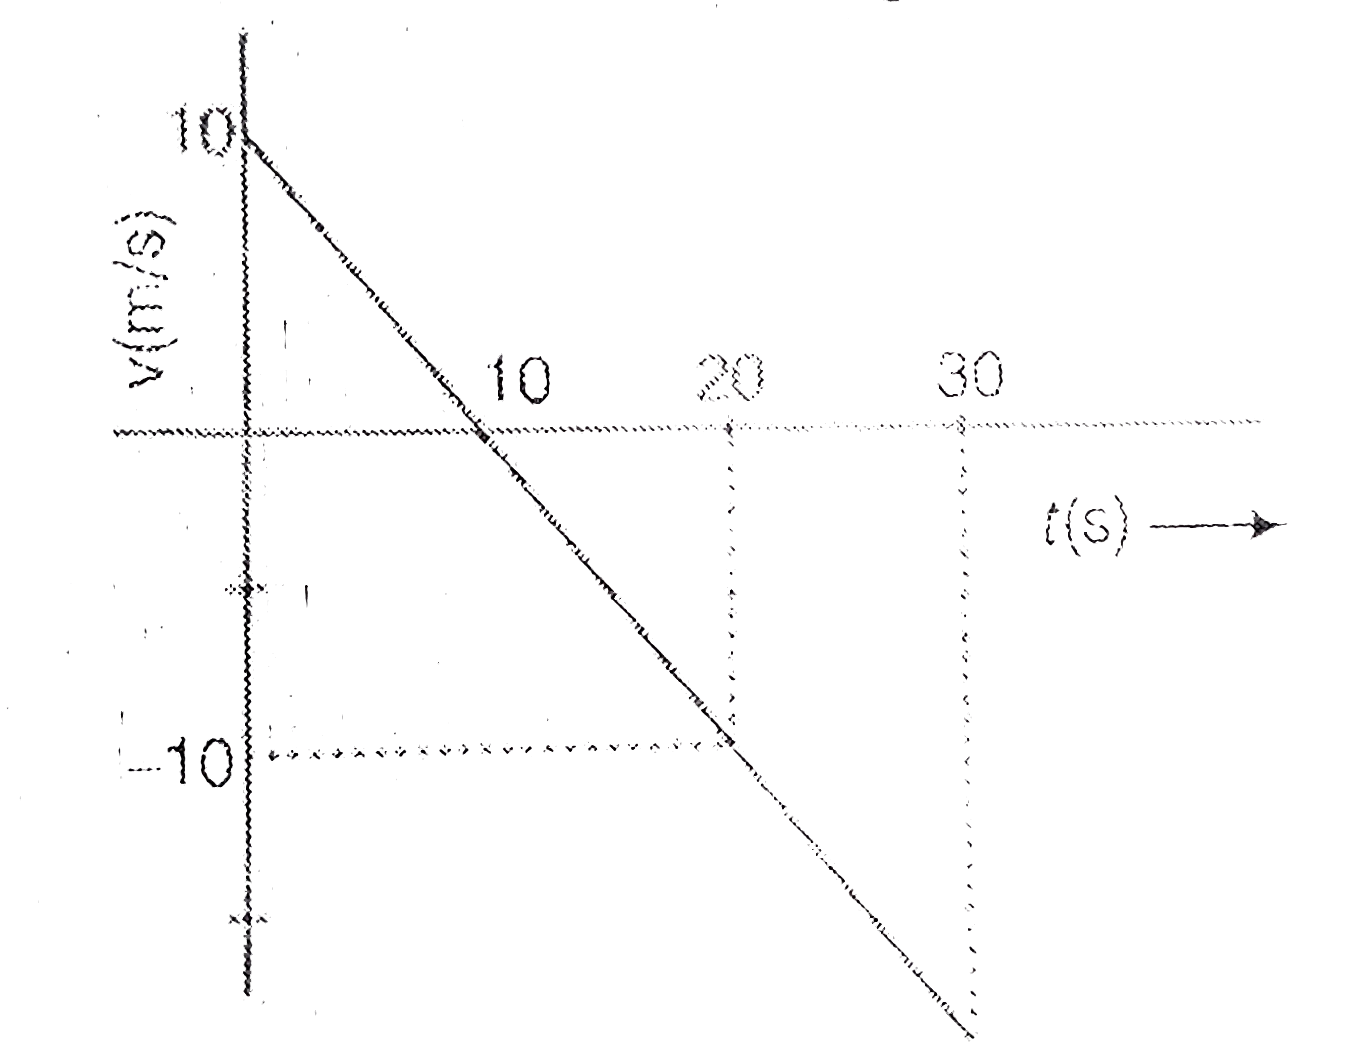
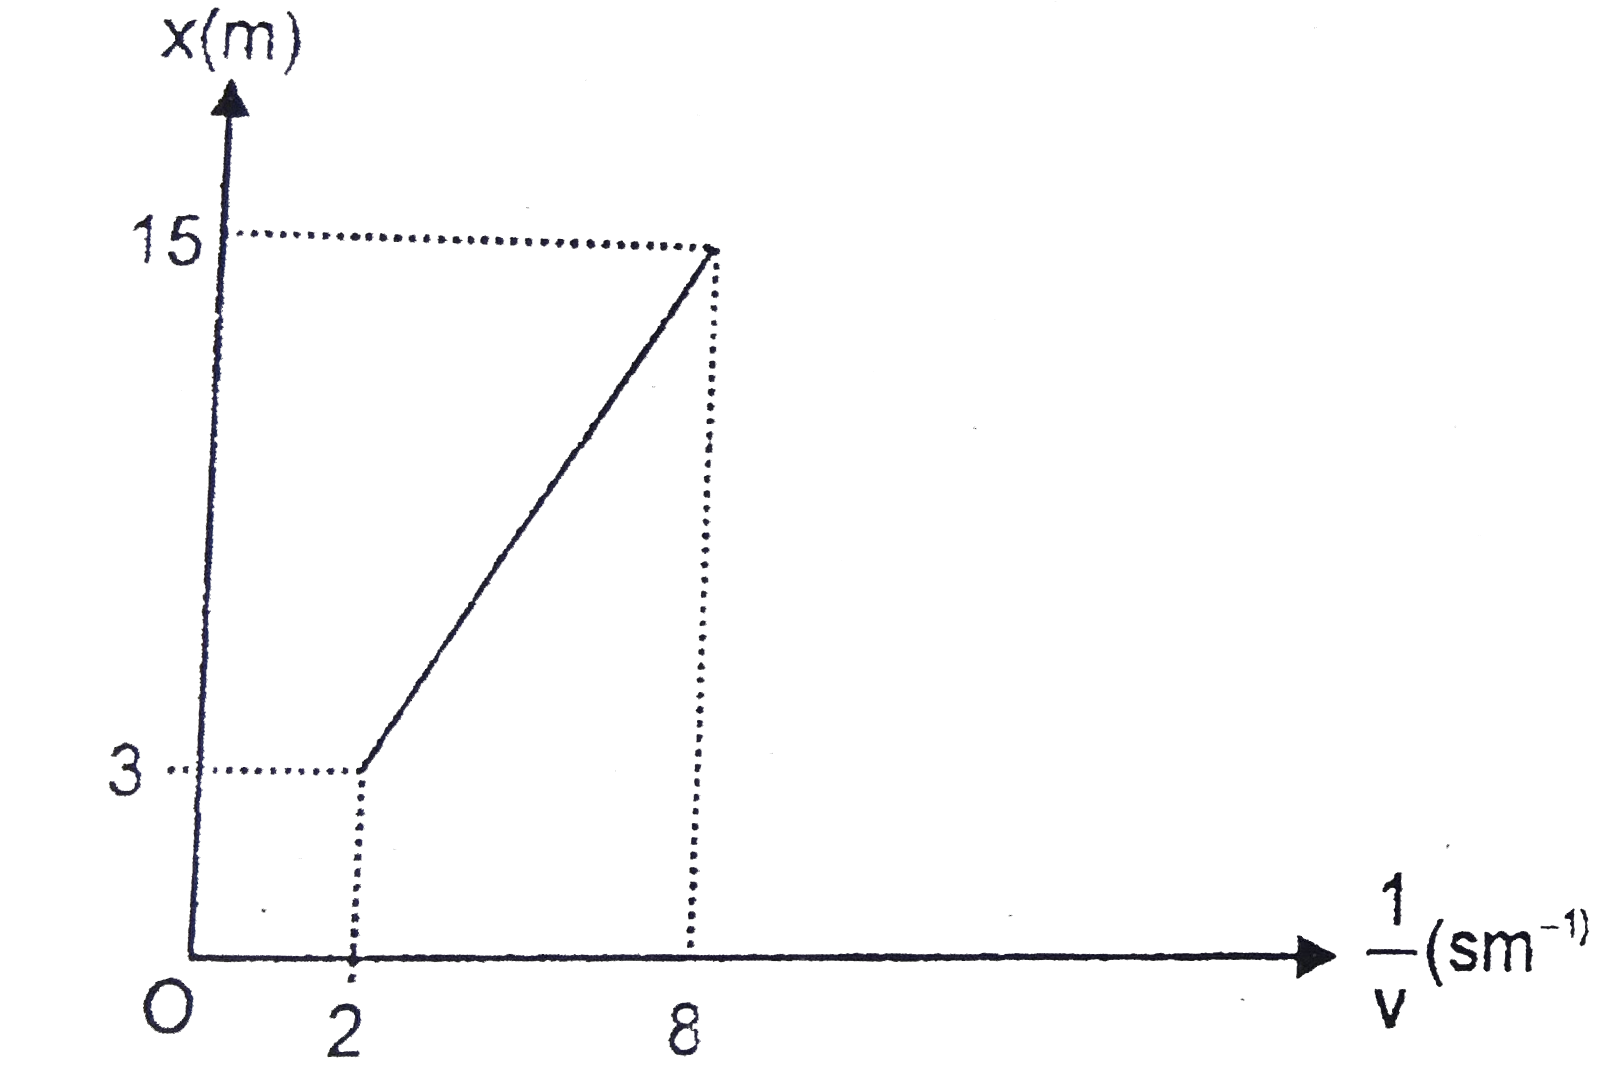
Graph of position (x) vs inverse of velocity (1v) for a particle moving on a straight line is as shown. The time taken by the particle to move from x=3m to x=15 is :
A
40 sec.
B
80 sec.
C
60 sec.
D
100 sec.
Video Solution
Text Solution
The correct Answer is:C
the equation of the straight line shown in the graph is
x=2v=−1
But v=dxdt
∴x=2dtdx−1
⇒xdx=2dt−dx
⇒15∫3xdx=21∫0dt−15∫3dx
⇒12[225−9]=2t−[15−3]
⇒108+12=2t,t=60s
|
Similar Questions
Knowledge Check
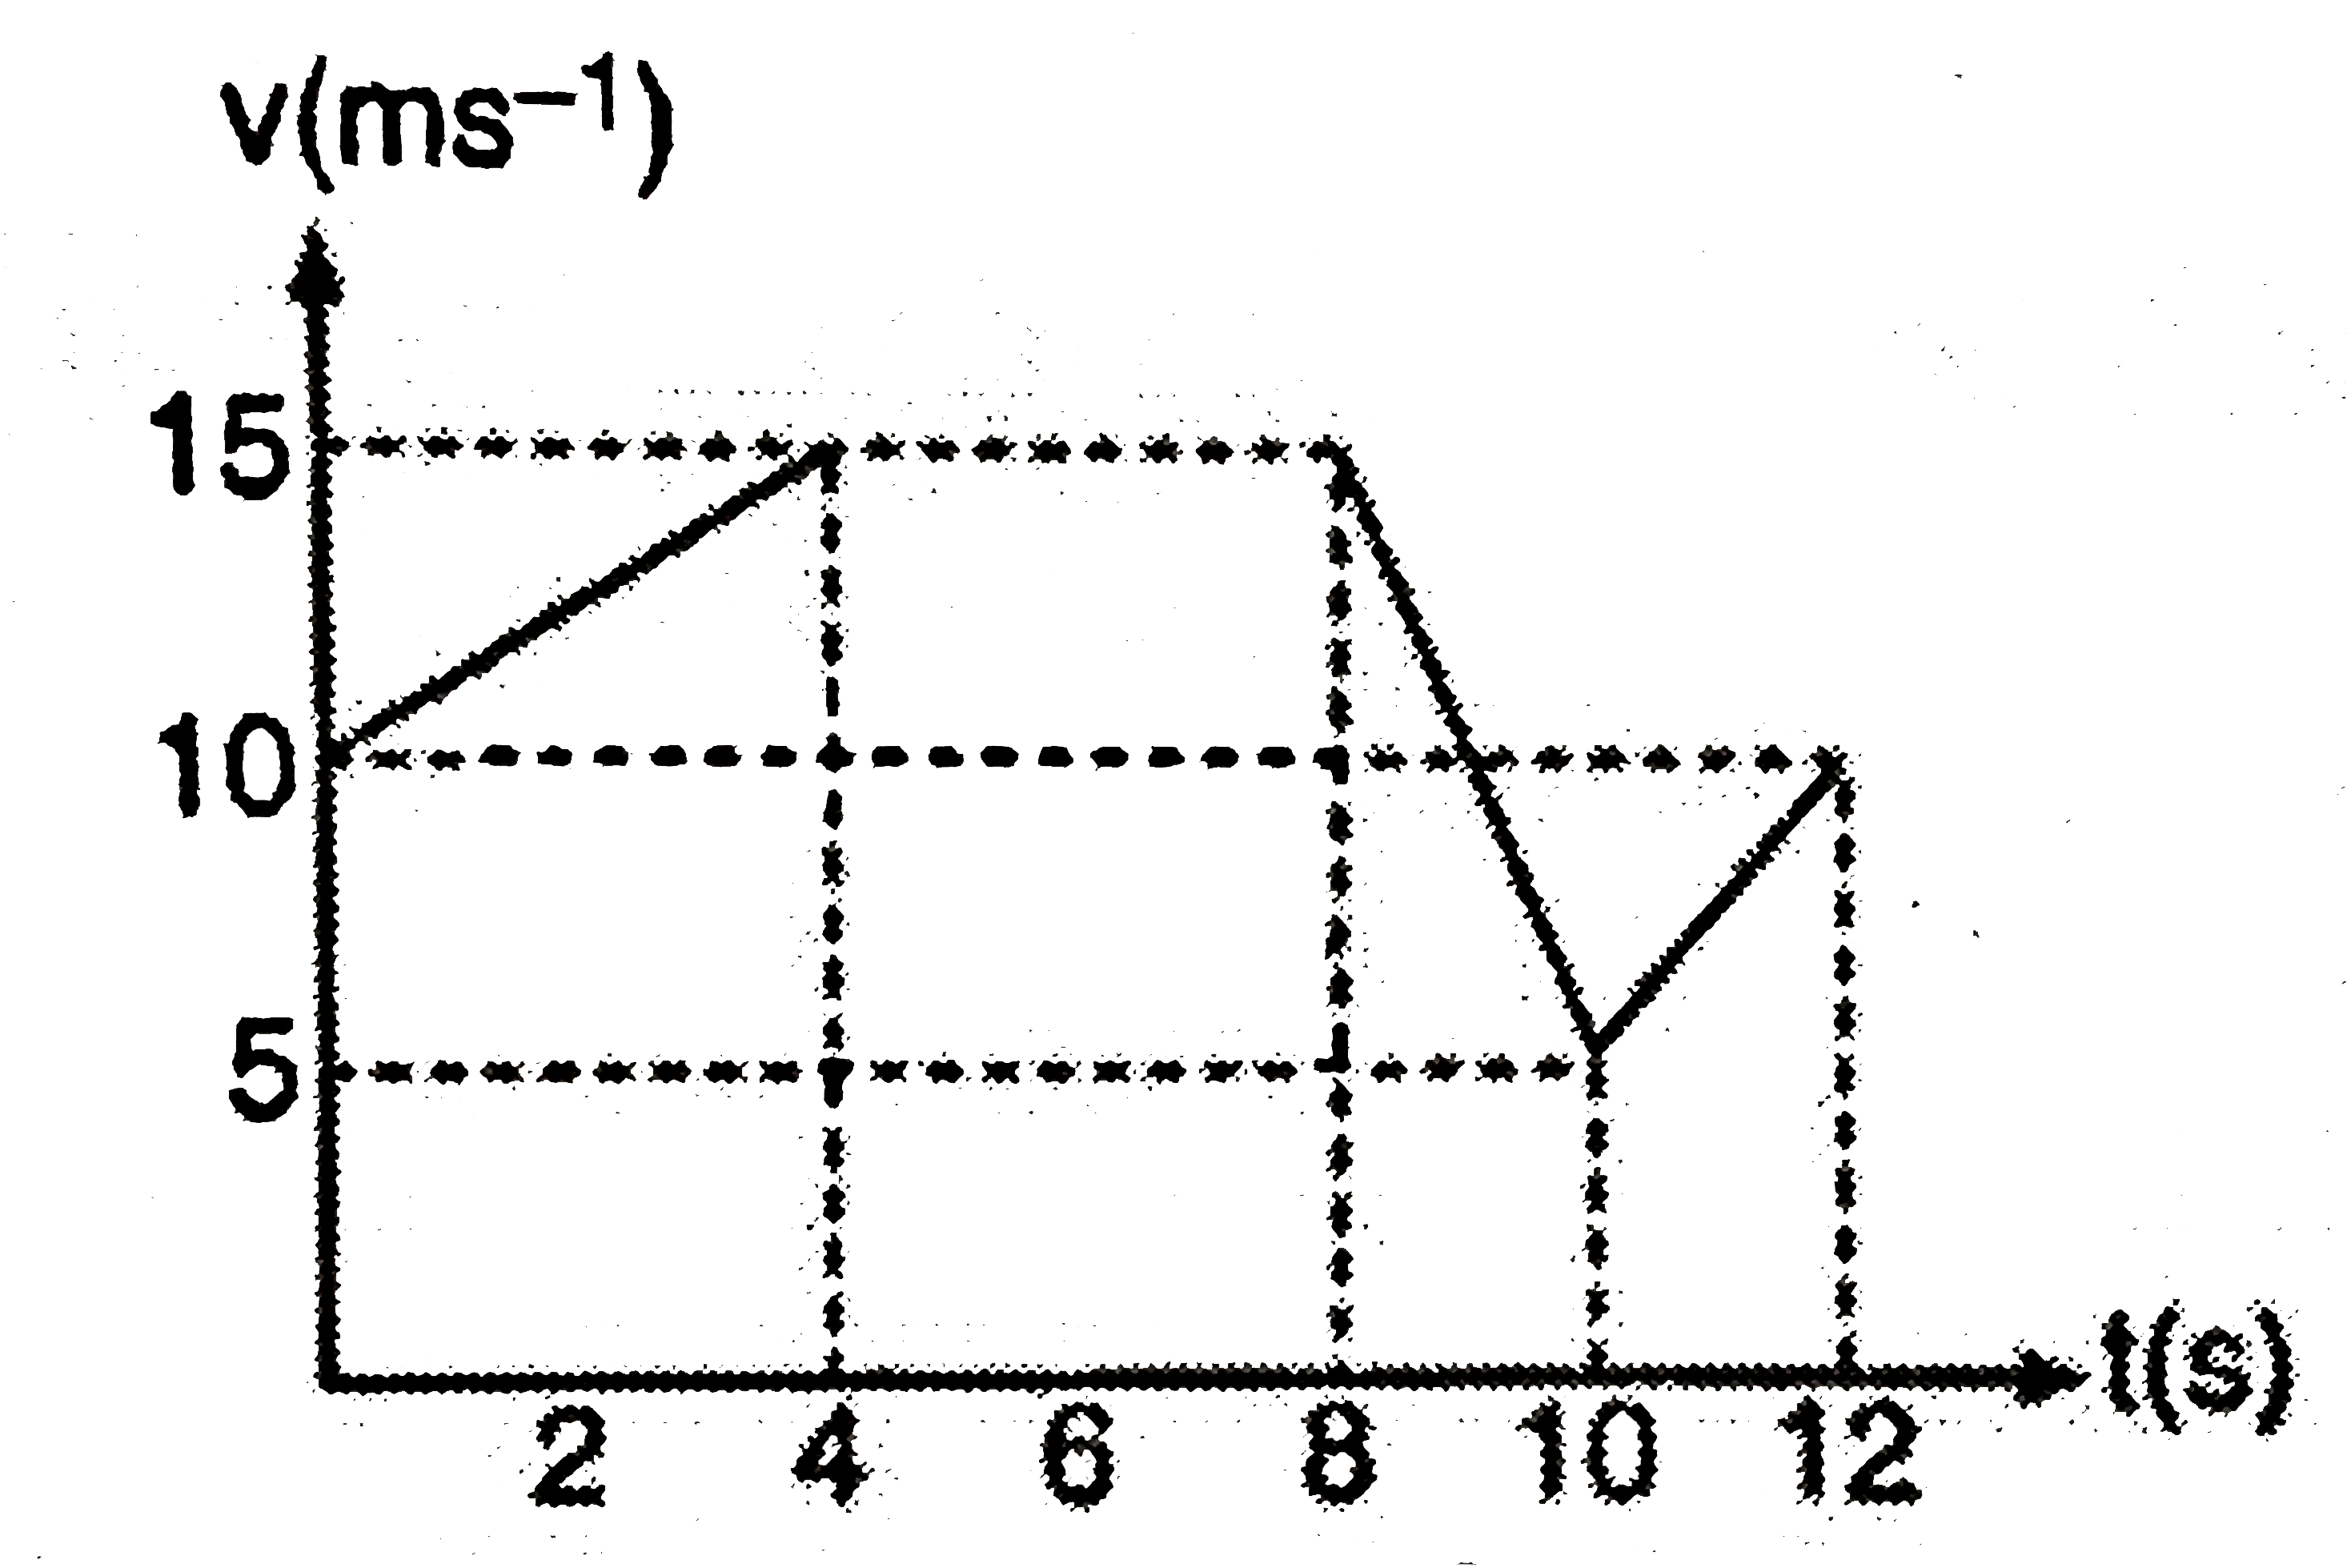
The velocity-time plot for a particle moving on a straight line is shown in figure.
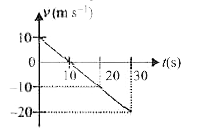 AThe particle has a constant acceleration.BThe particle has never tumed around.CThe particle has zero displacement.DThe average speed in the interval 0 to 10 s is the same as the average speed in the interval 10s to 20 s.
The velocity- time plot for a particle moving on a straight line is shown in the figure
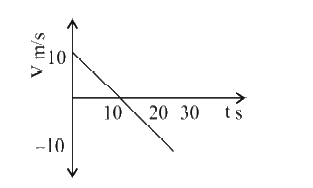 Athe particle has a non uniform accelerationBthe particle has never turned aroundCthe particle has zero displacementDthe average speed in the interval 0 to 10 s is the same as the average speed in the interval 10 s to 20 s
The velocity time plot for a particle moving on straight line is shown in the figure.
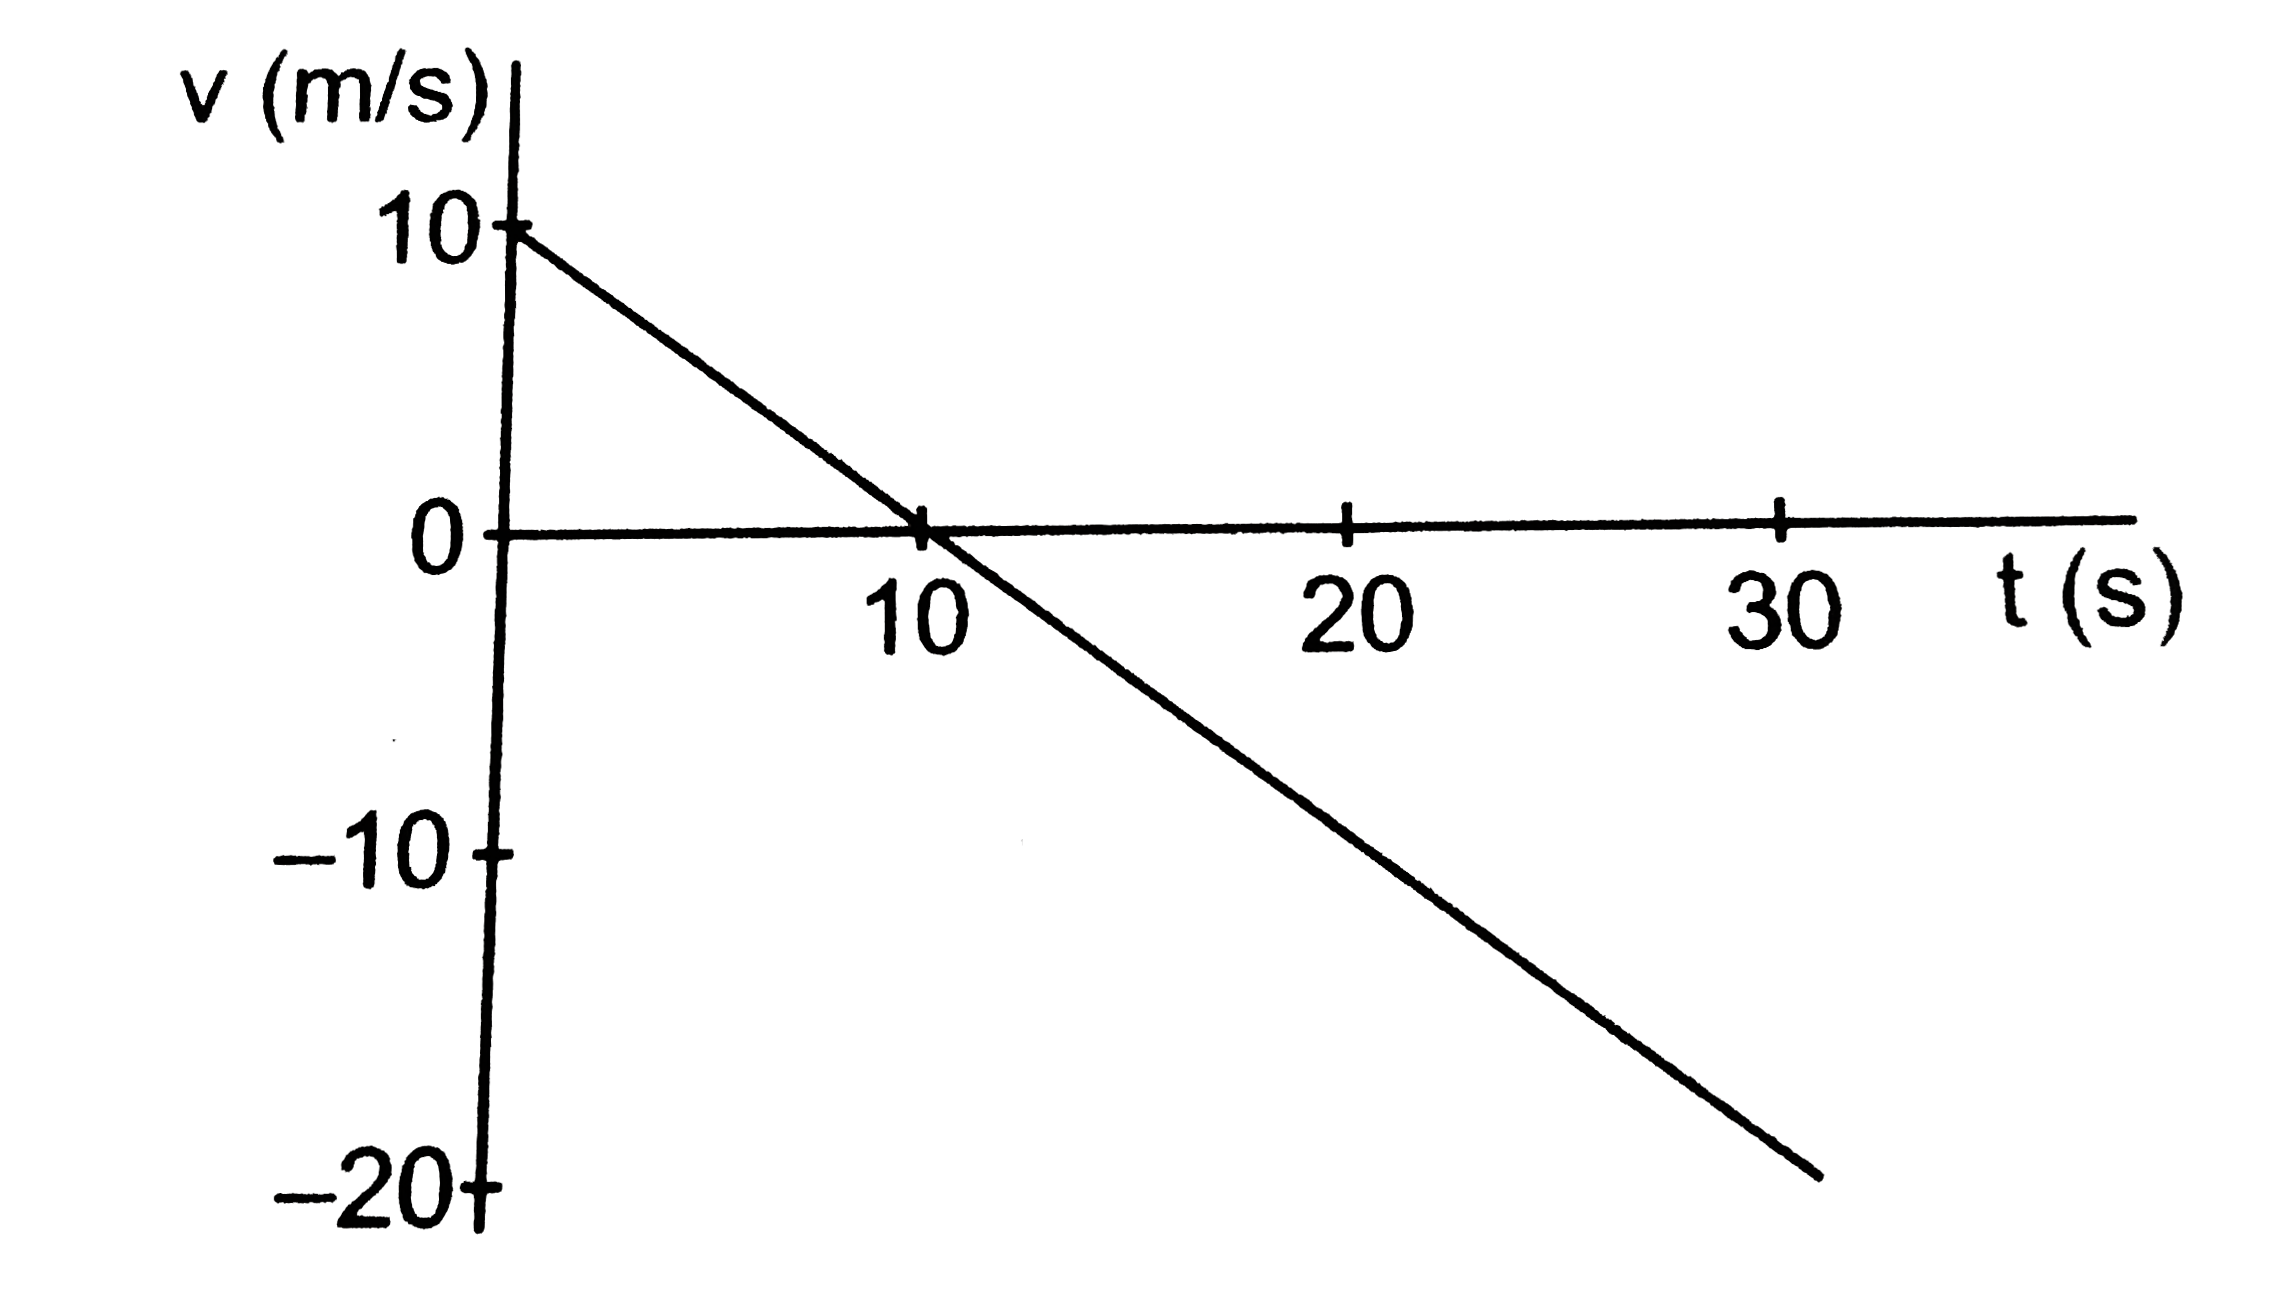 AThe particle has a constant accelerationBThe particle has nevedr turned aroundCThe paeticle has zero displacement.DThe average speed in the interval 0 to 10 s is the same as the average speed in the interval 10 s to 20s.
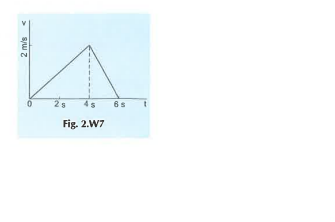
The velocity-time graph of a particle moving along a straight line is shown in Figure 2.W7.Is the motion uniform?
View SolutionVelocity displacement graph of a particle moving in a straight line is as shown in figure.

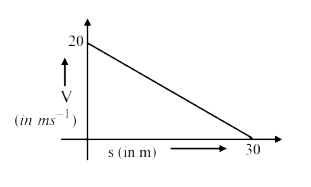
View SolutionThe velocity –position graph of a particle moving along a straight line is shown. Then acceleration of the particle at s = 15 m is :
View SolutionDisplacement time graph of a particle moving in a straight line is a shown in figure.

View SolutionThe velocity -time (v−t) graph of a particle moving in a straight line is shown in figure. The acceleration of the particle at t=9 is:
View Solution

