Which of the following graph ploltted between P and V is INCORRECT ?
A
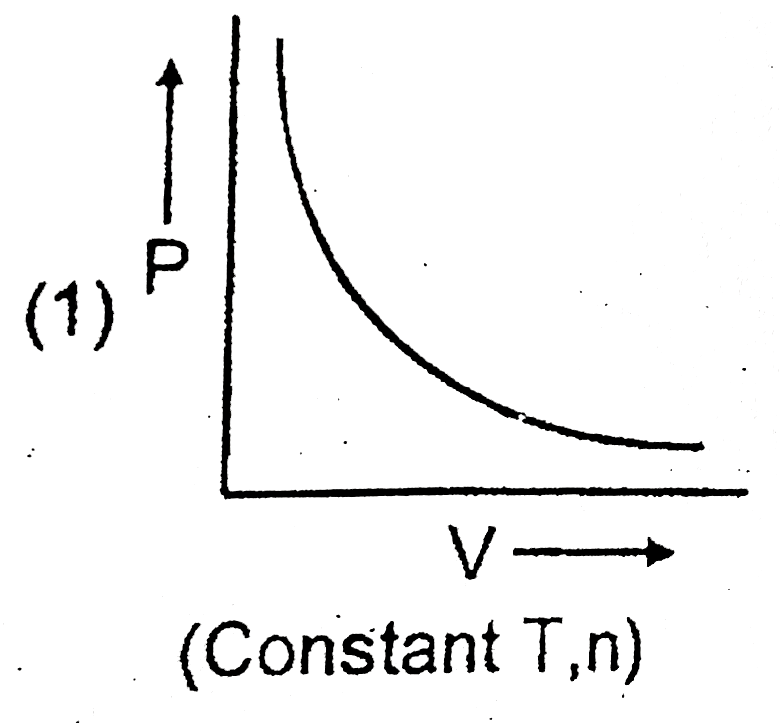
B
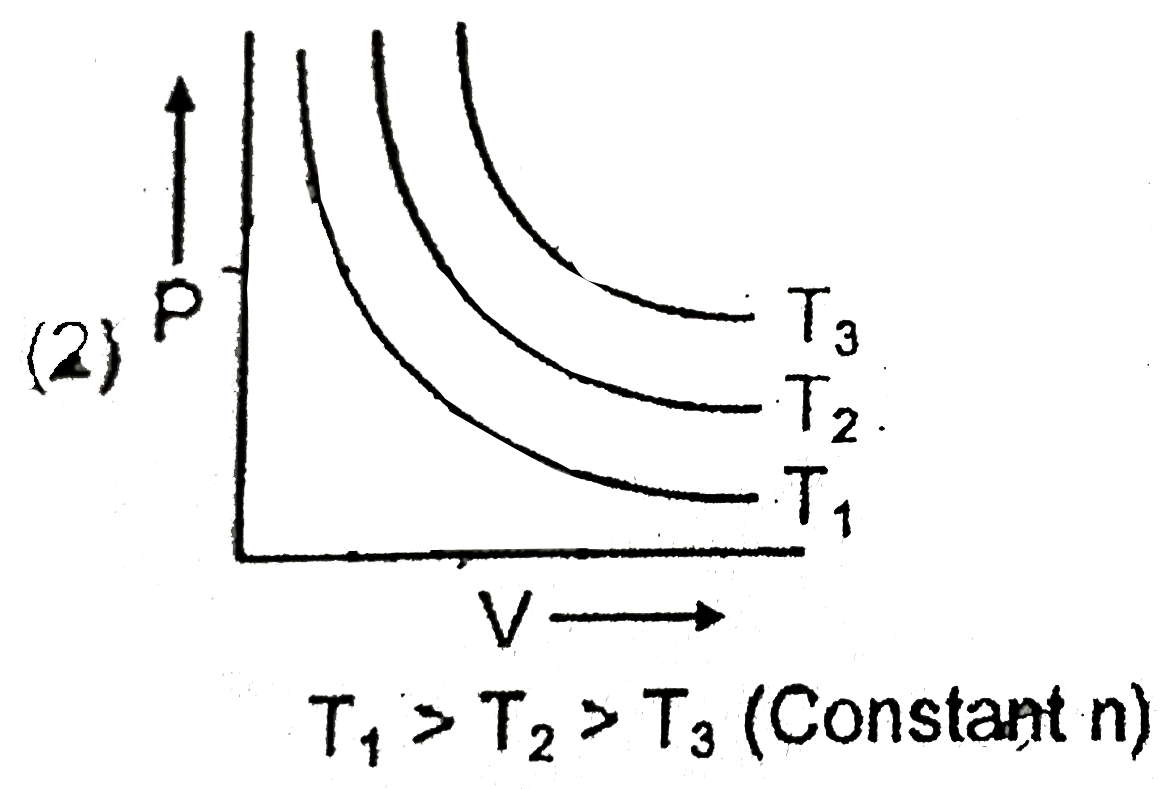
C
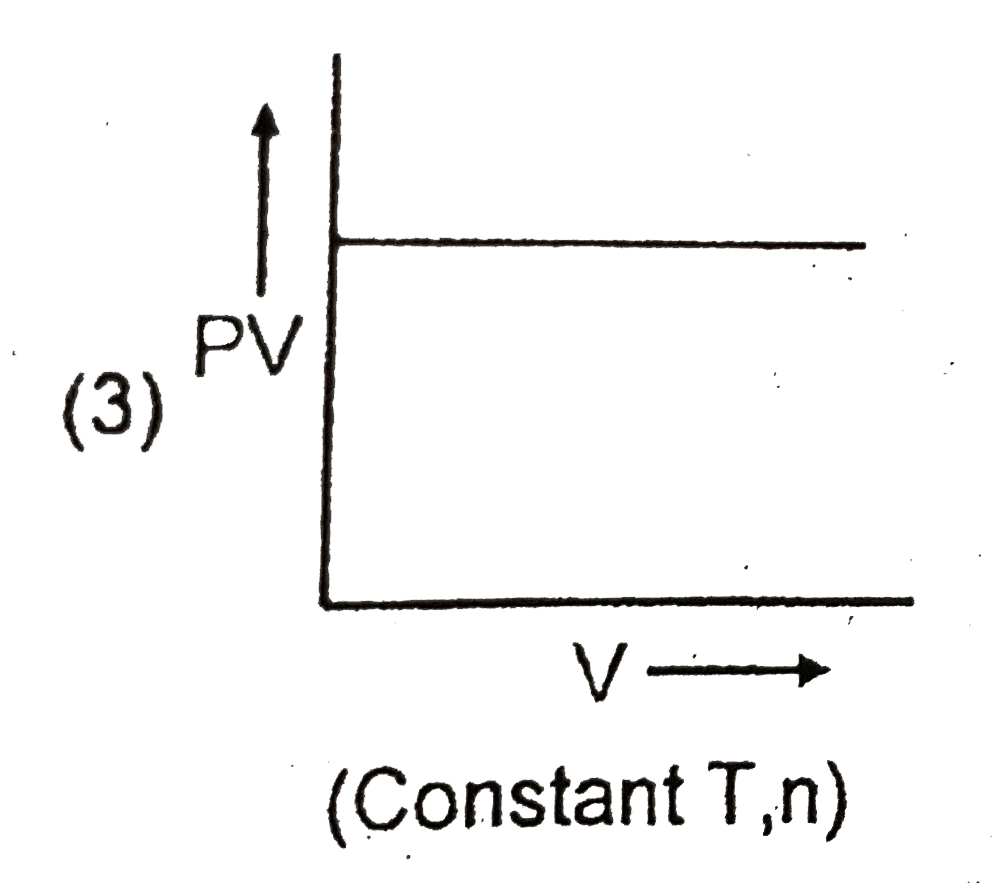
D
None of these
Video Solution
Text Solution
The correct Answer is:B
Which of the following graph plotted …………..
In (2)T3>T2>T1
|
Topper's Solved these Questions
- TEST PAPERSBOOK - RESONANCECHAPTER - TEST PAPERSEXERCISE - PART - III CHEMISTRY SEC - 1
12 Videos
- TEST PAPERSBOOK - RESONANCECHAPTER - TEST PAPERSEXERCISE - PART - III CHEMISTRY SEC - 2
18 Videos
- SURFACE CHEMISTRYBOOK - RESONANCECHAPTER - SURFACE CHEMISTRYEXERCISE - Section - 5
1 Videos
- TEST SERIESBOOK - RESONANCECHAPTER - TEST SERIESEXERCISE - CHEMISTRY
50 Videos
Similar Questions
Knowledge Check
Which of the following graphs relates V and T?
A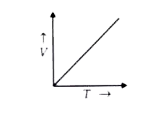 B
B C
C D
D
Which of the following graphs is incorrect?
A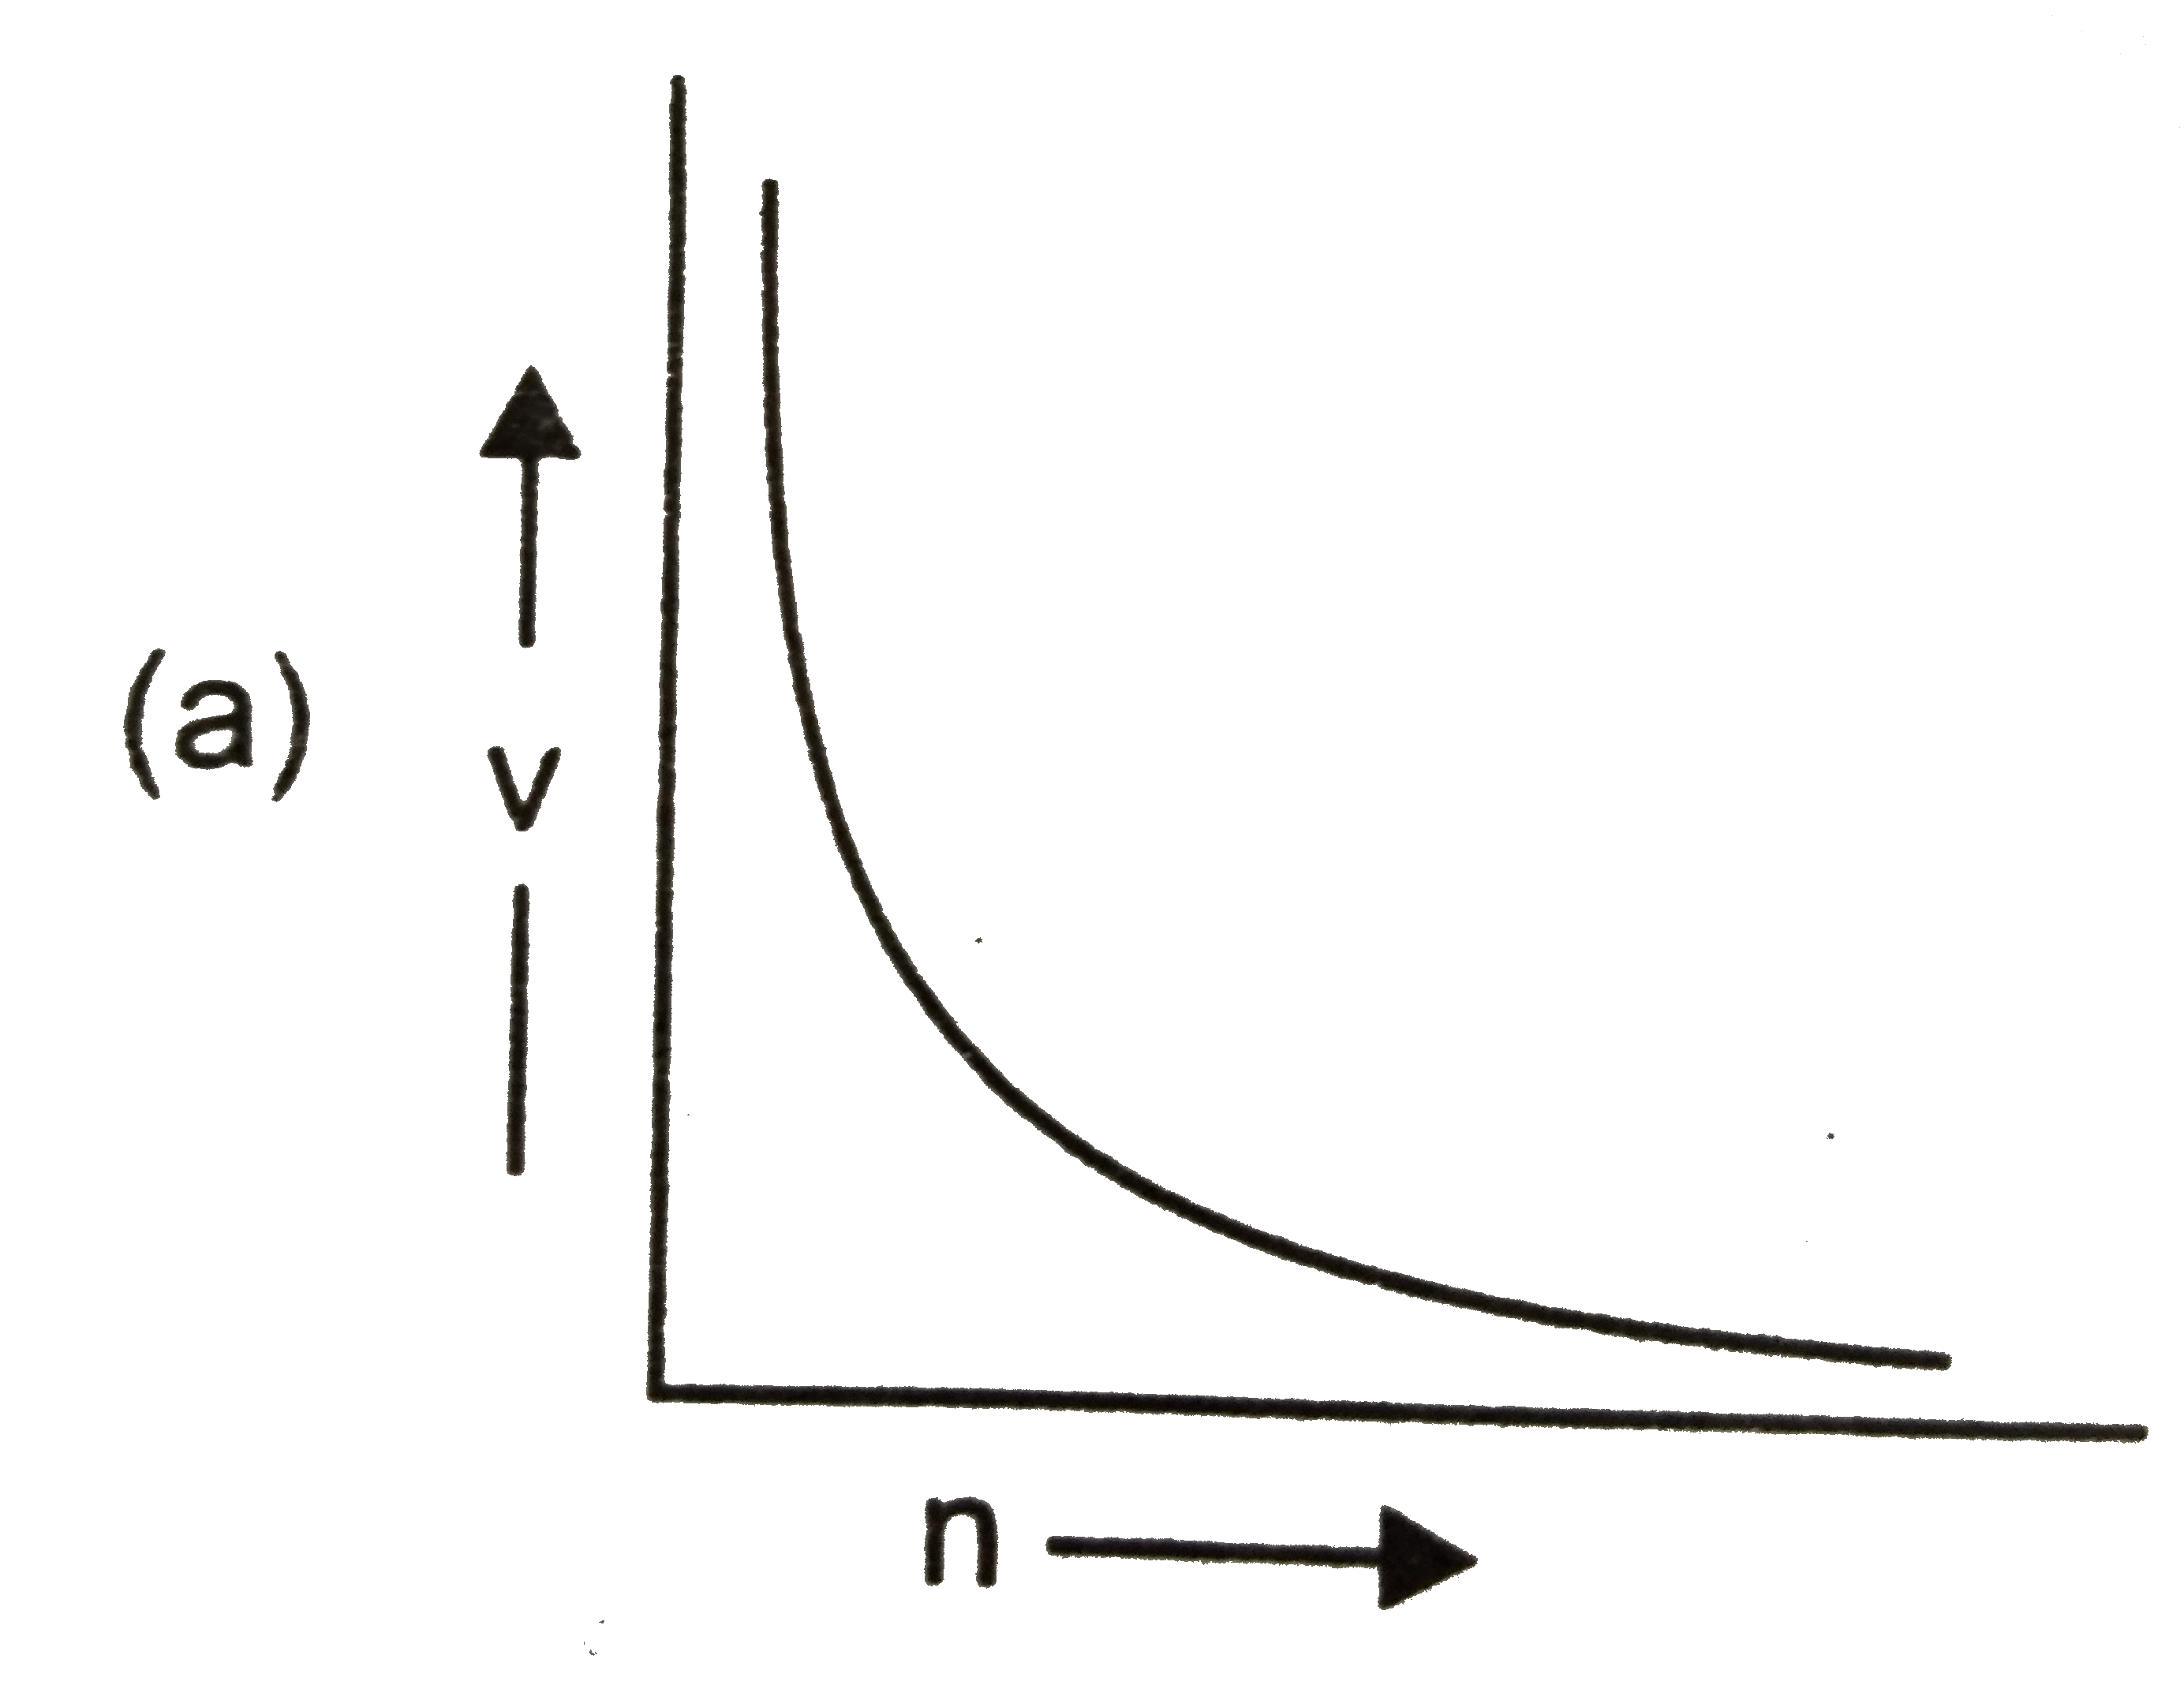 B
B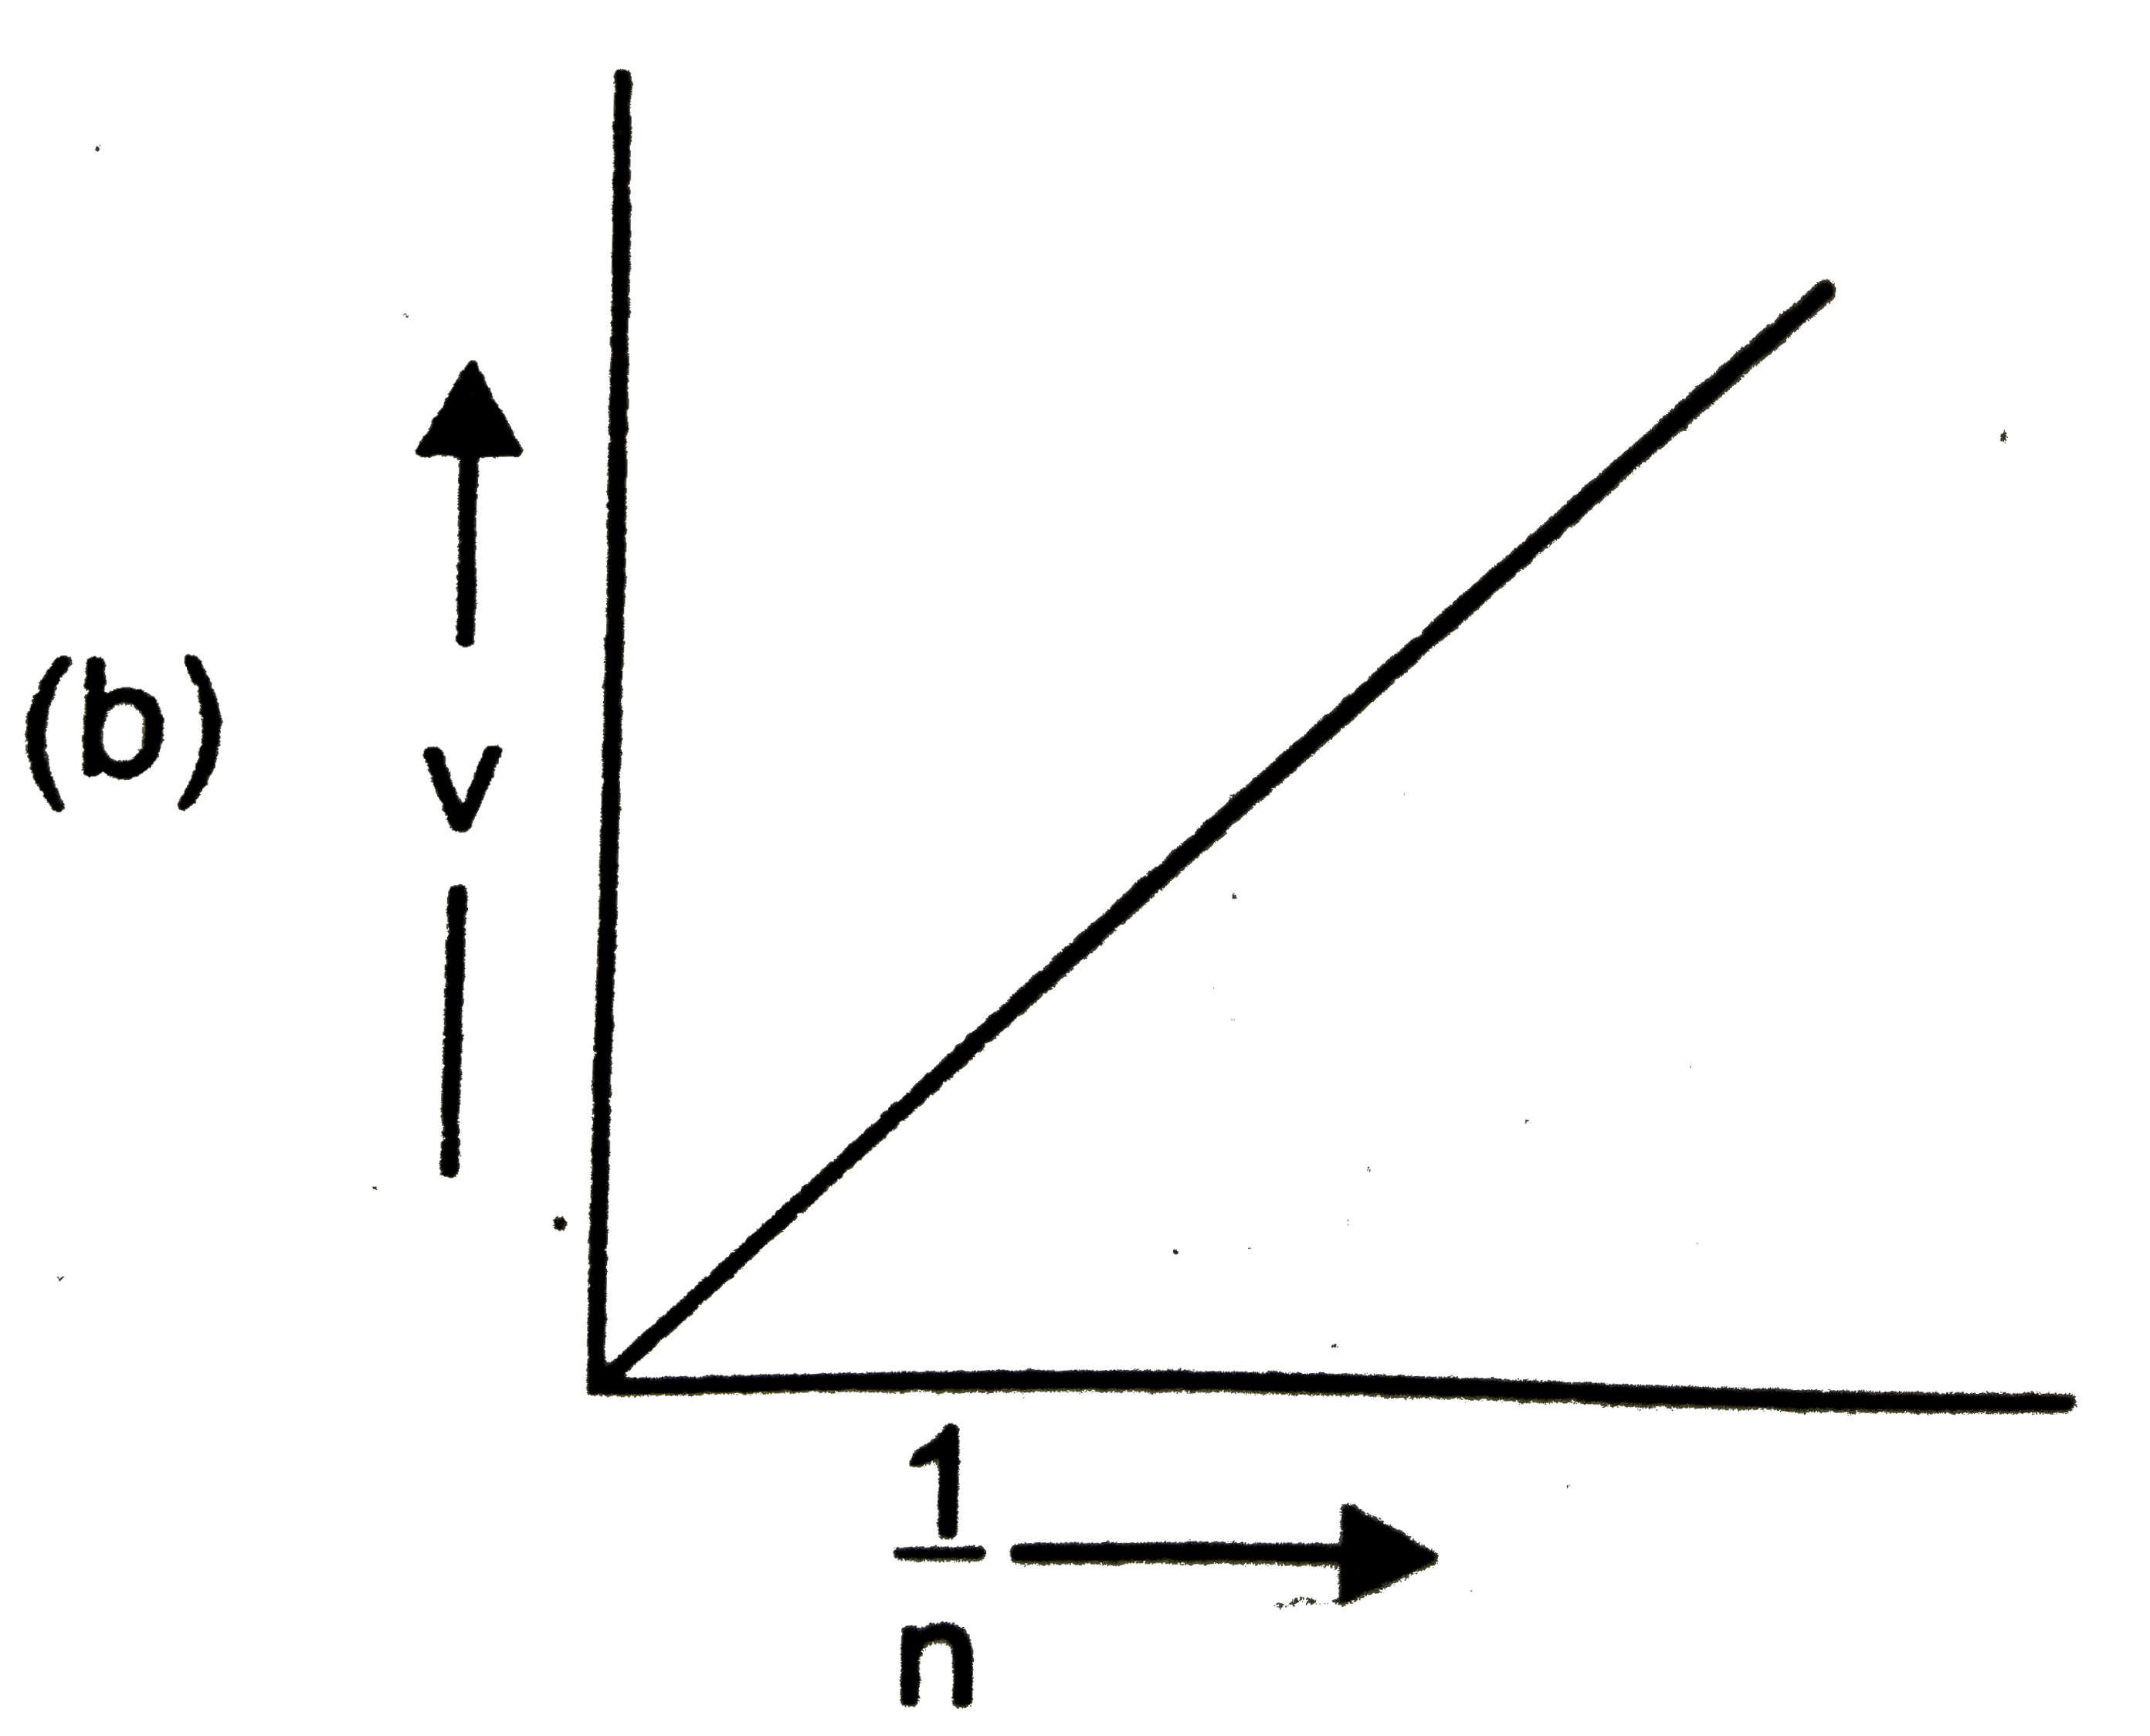 C
C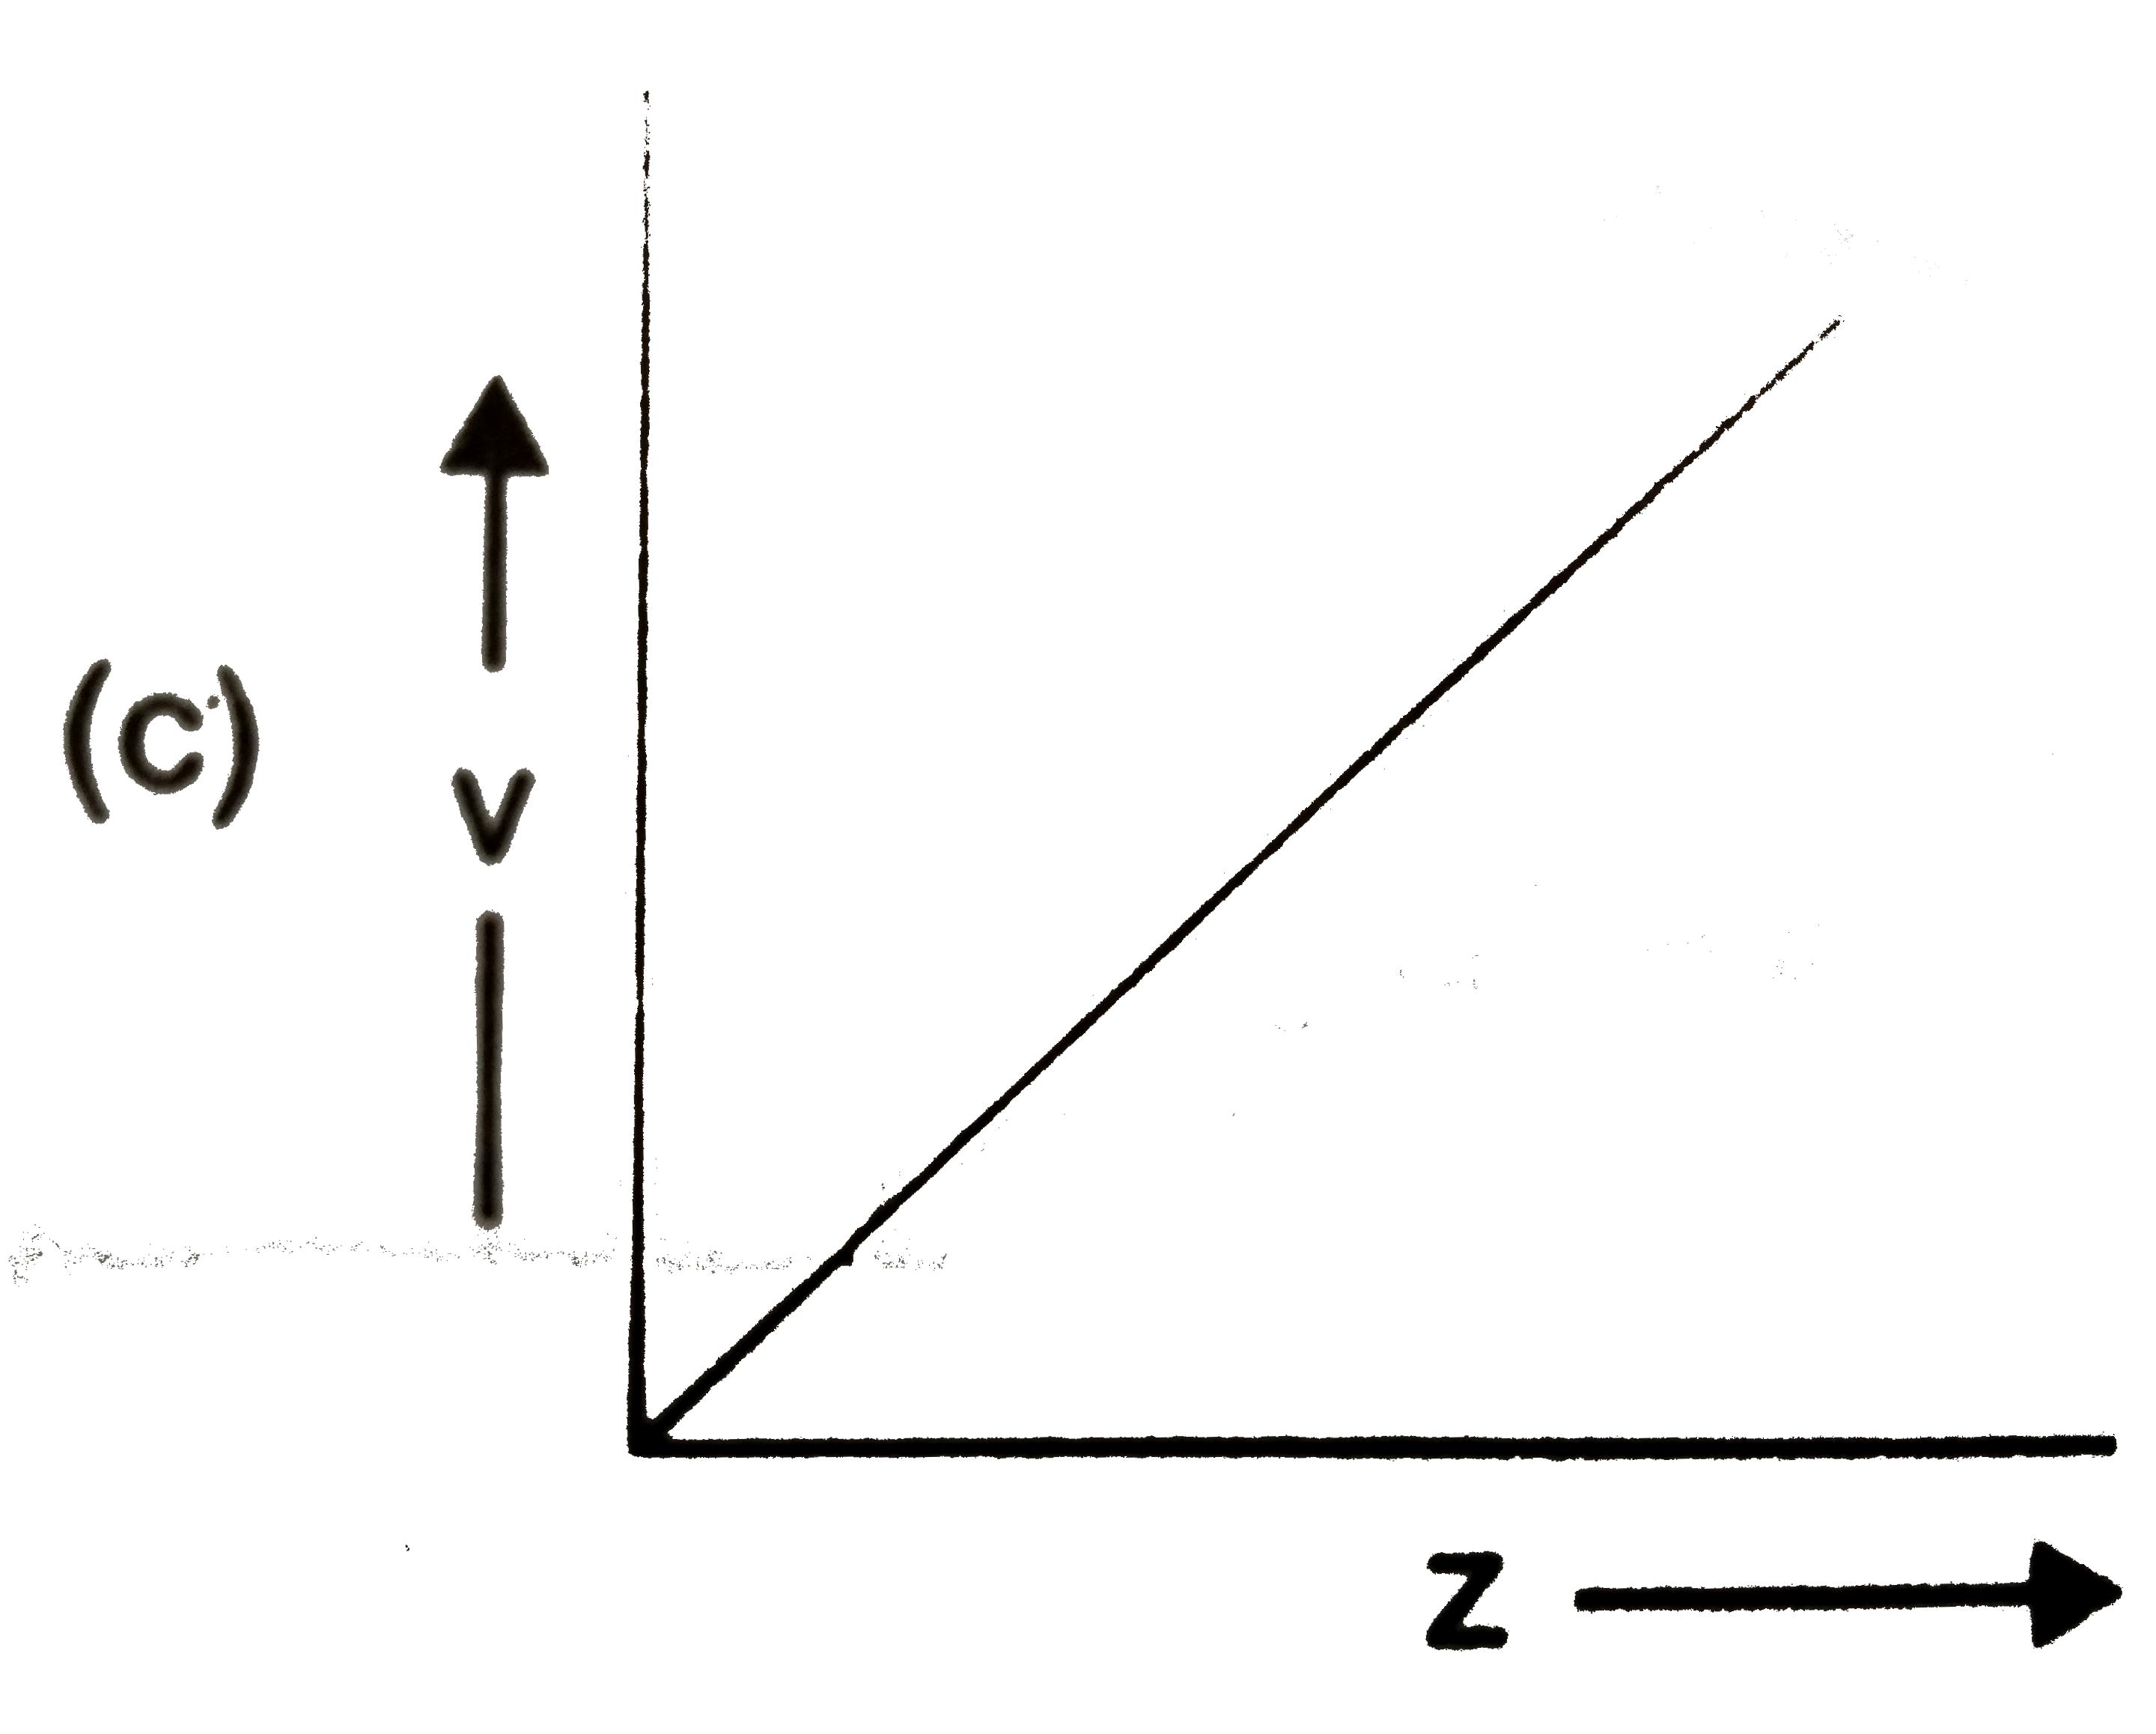 D
D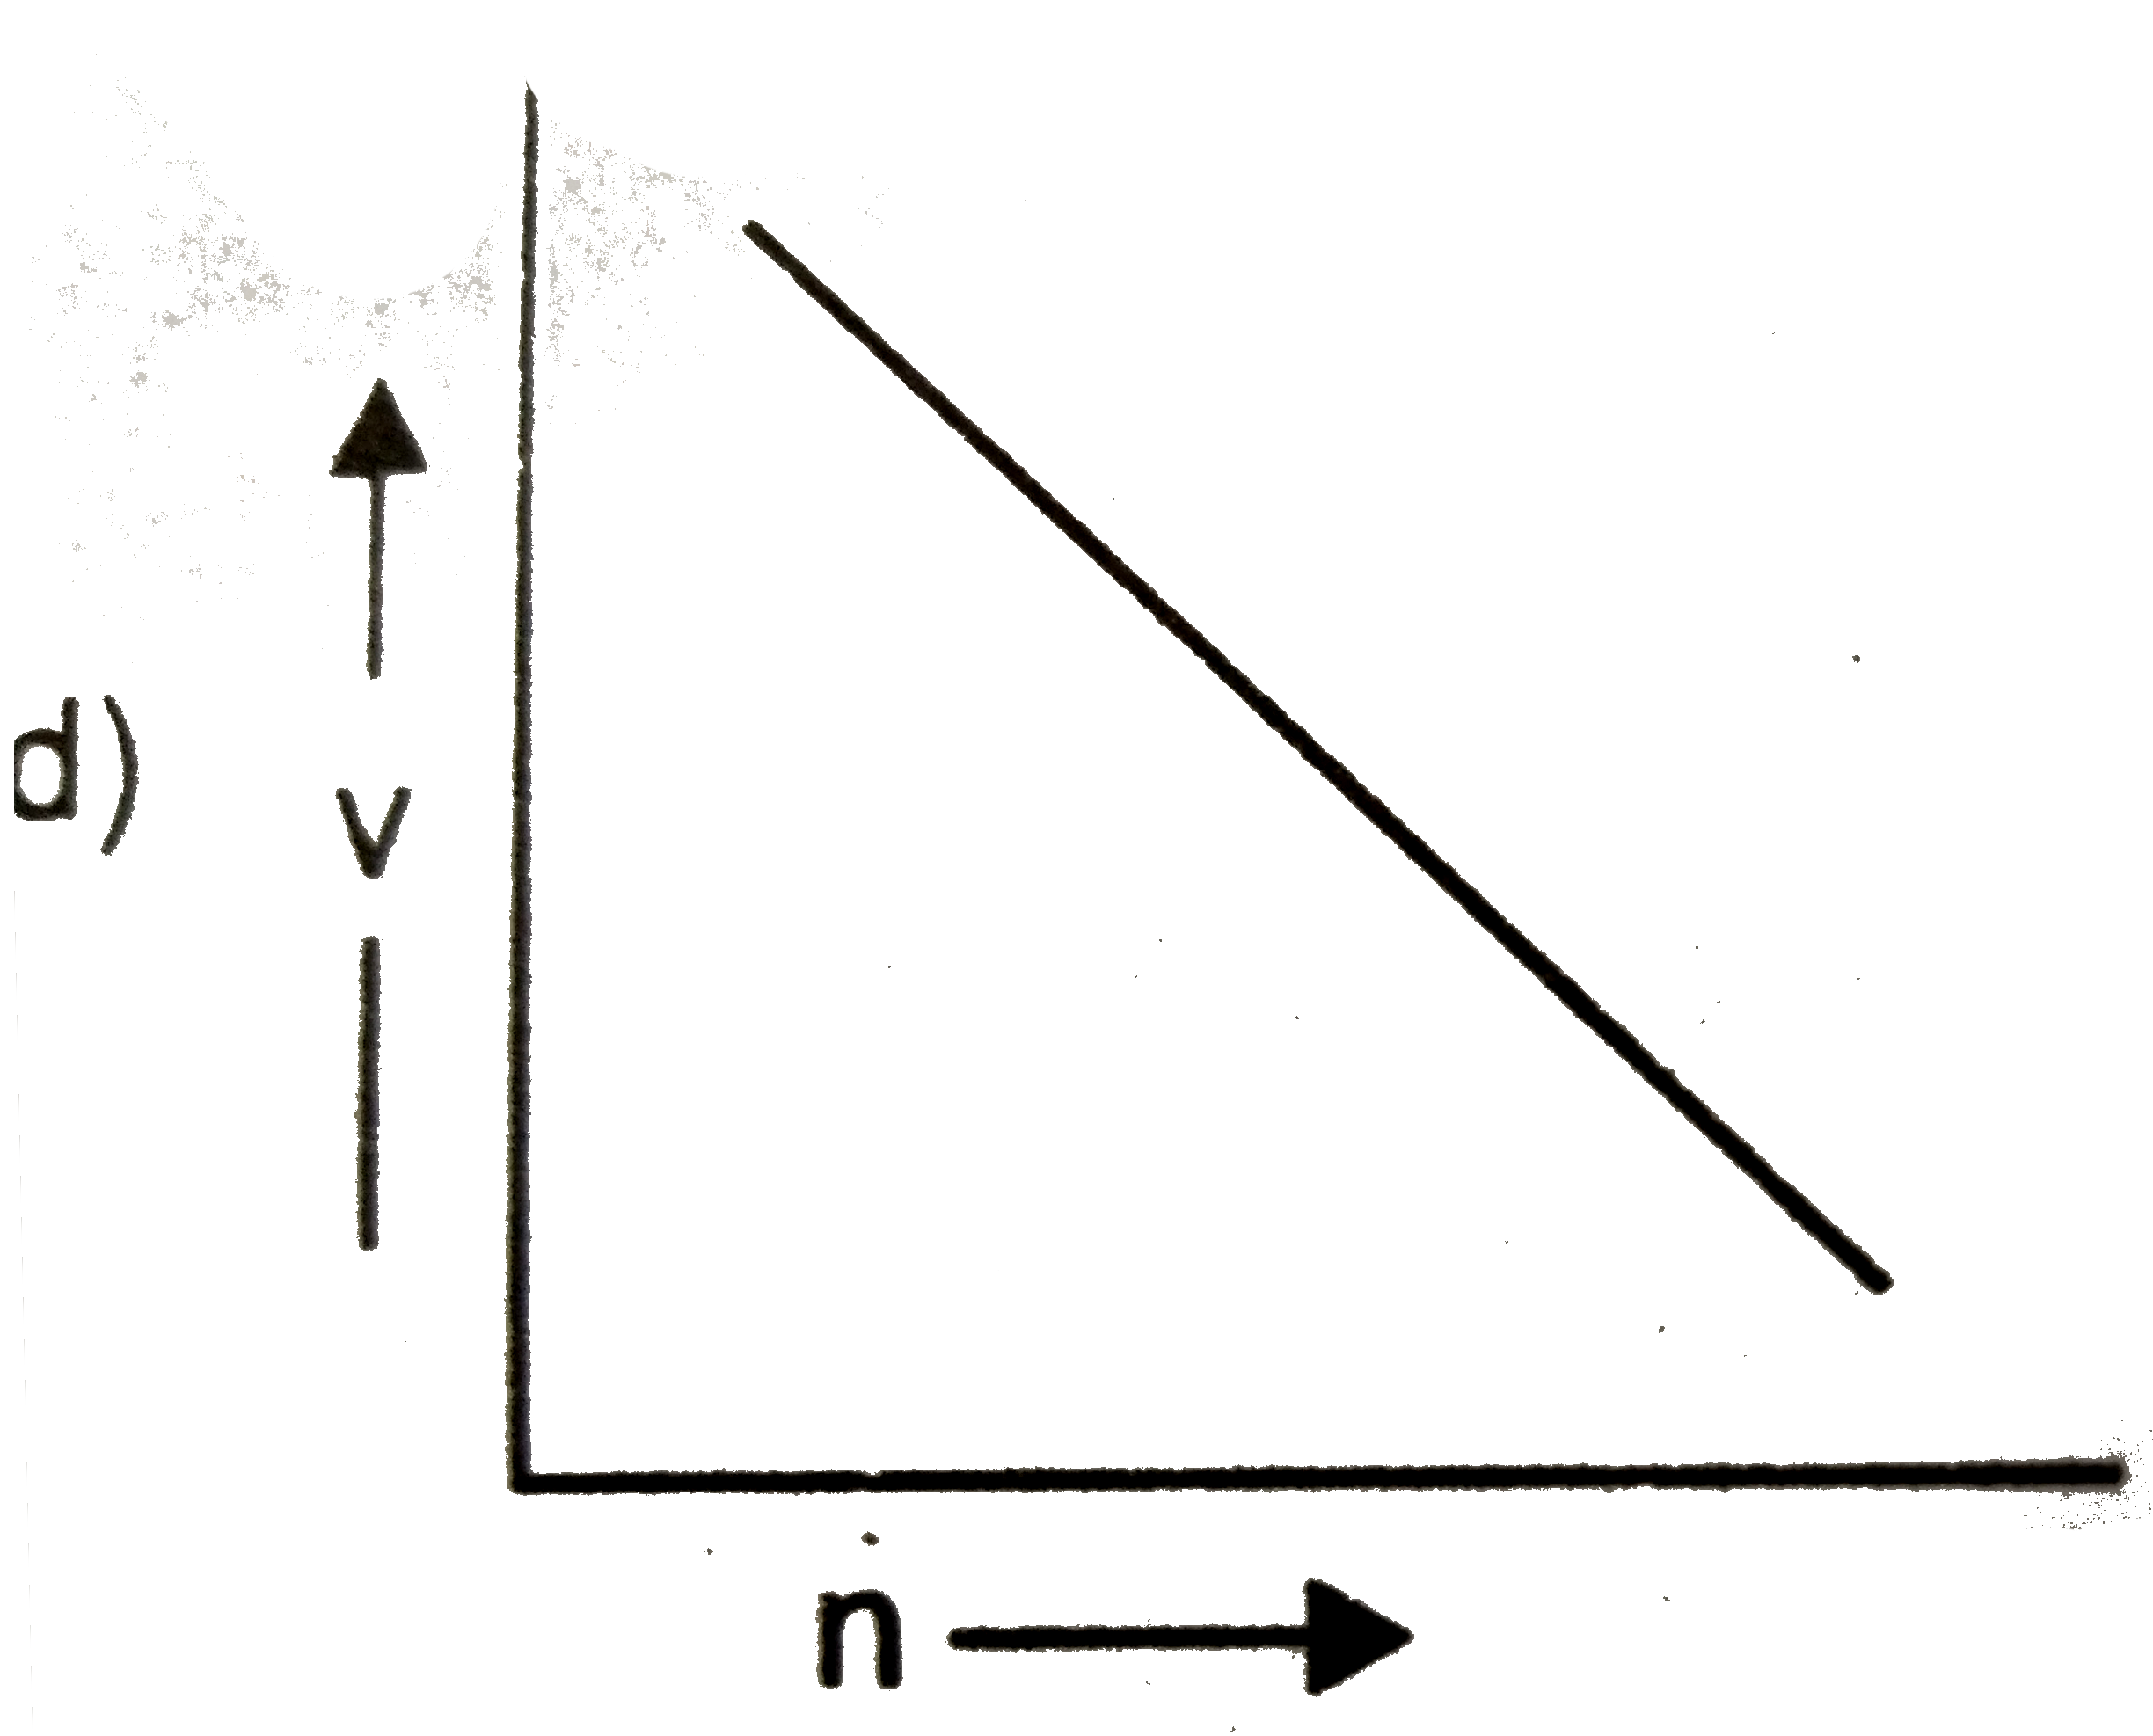
An external horizontal force P acts on a block placed on a rough horizontal surface. The force of friction (f) opposes the motion between them. Which of the following graphs represents the relation between P and f correctly?
A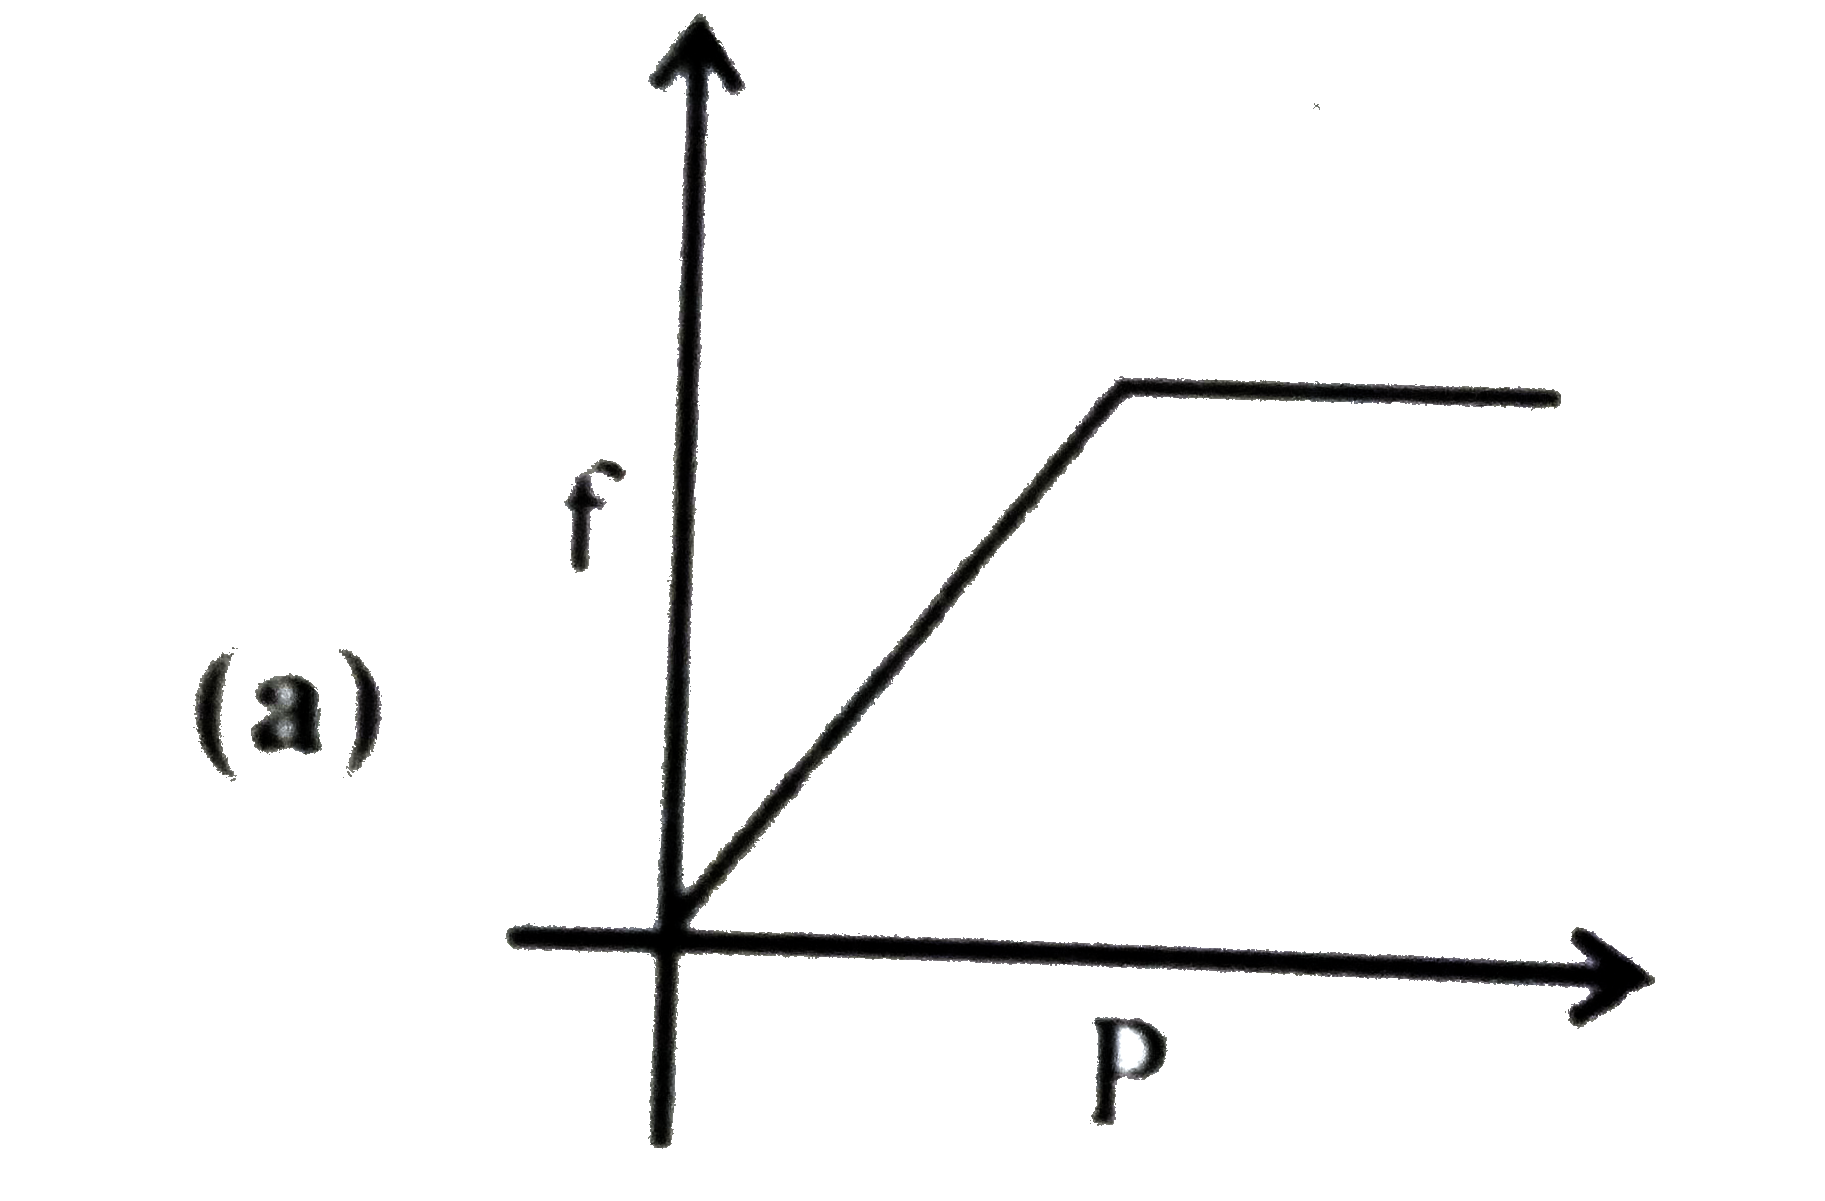 B
B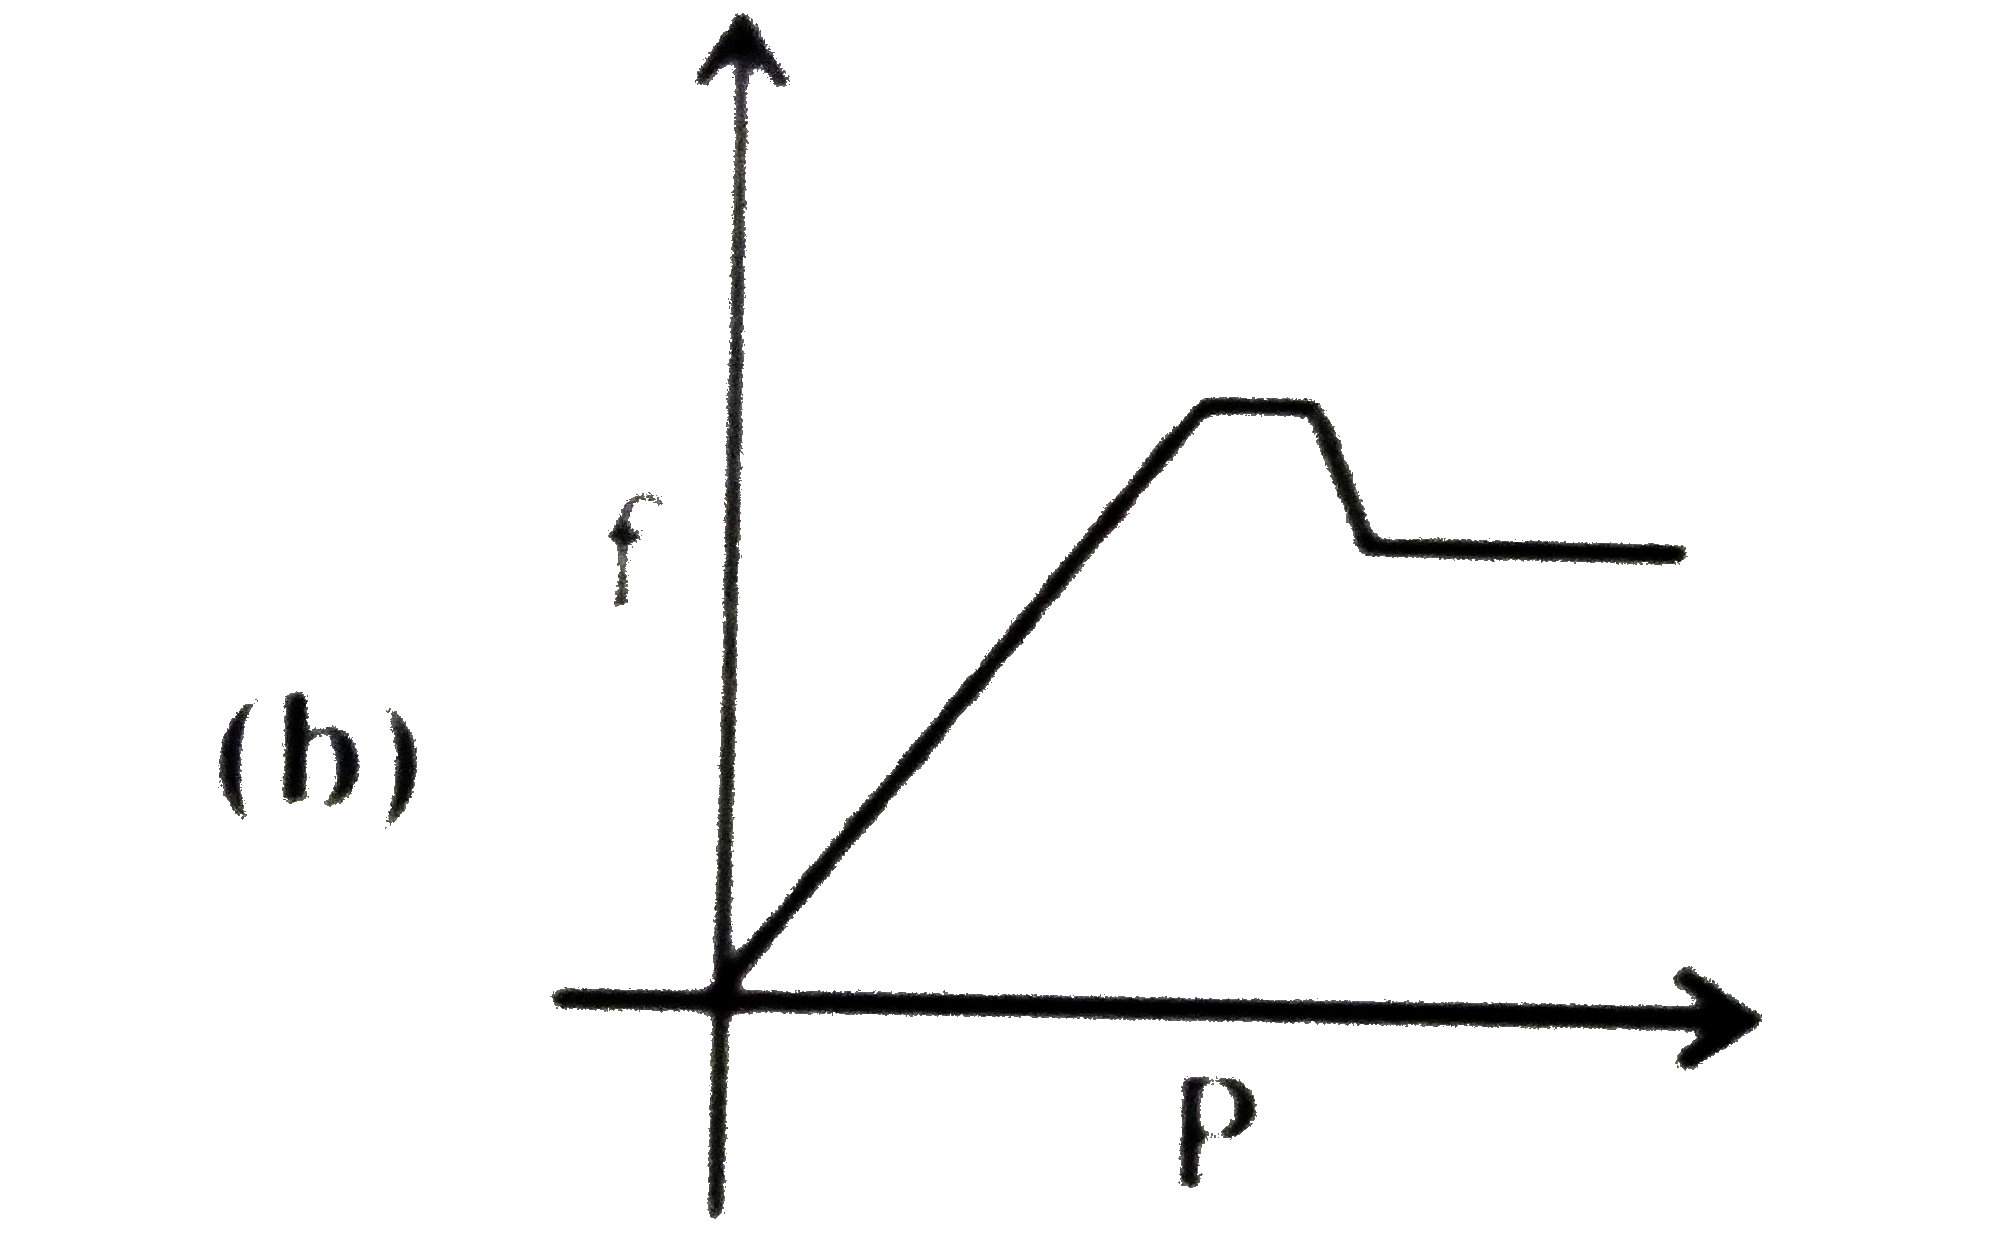 C
C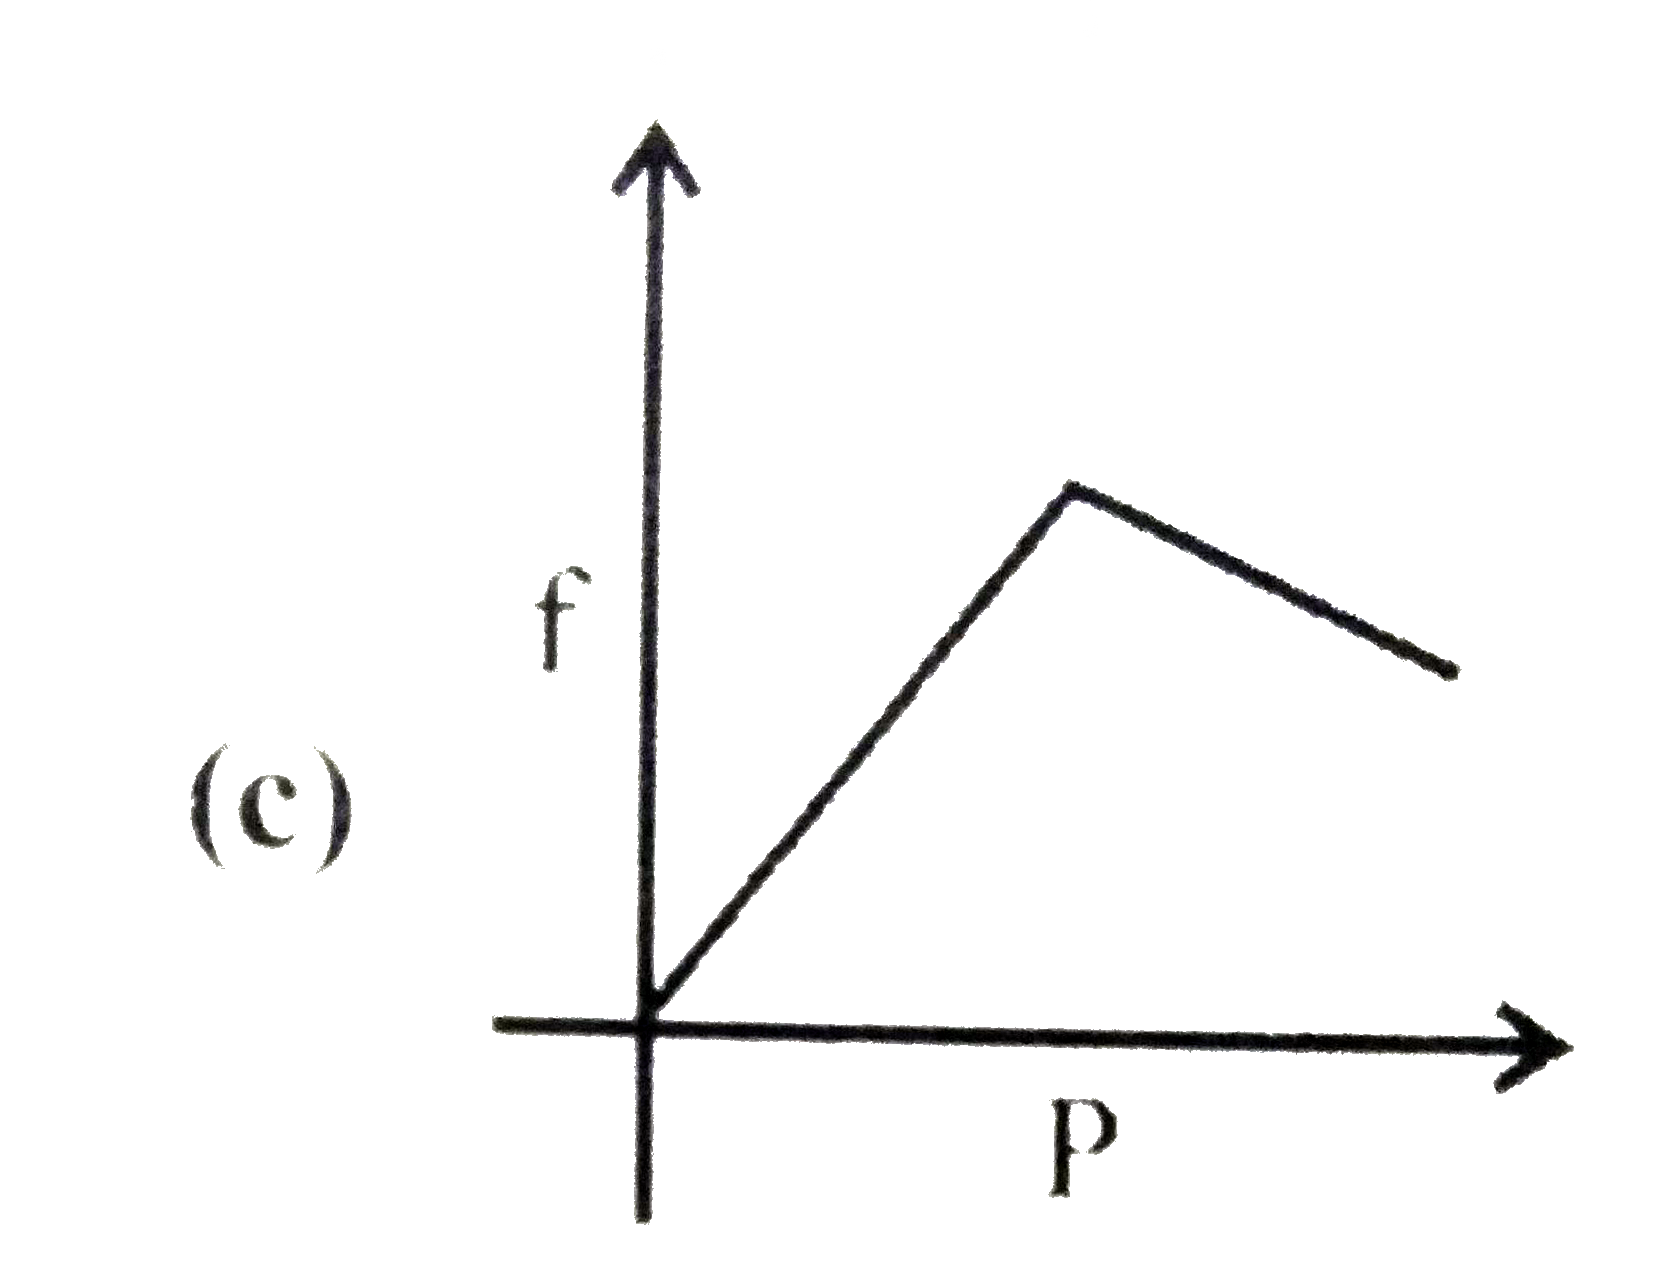 D
D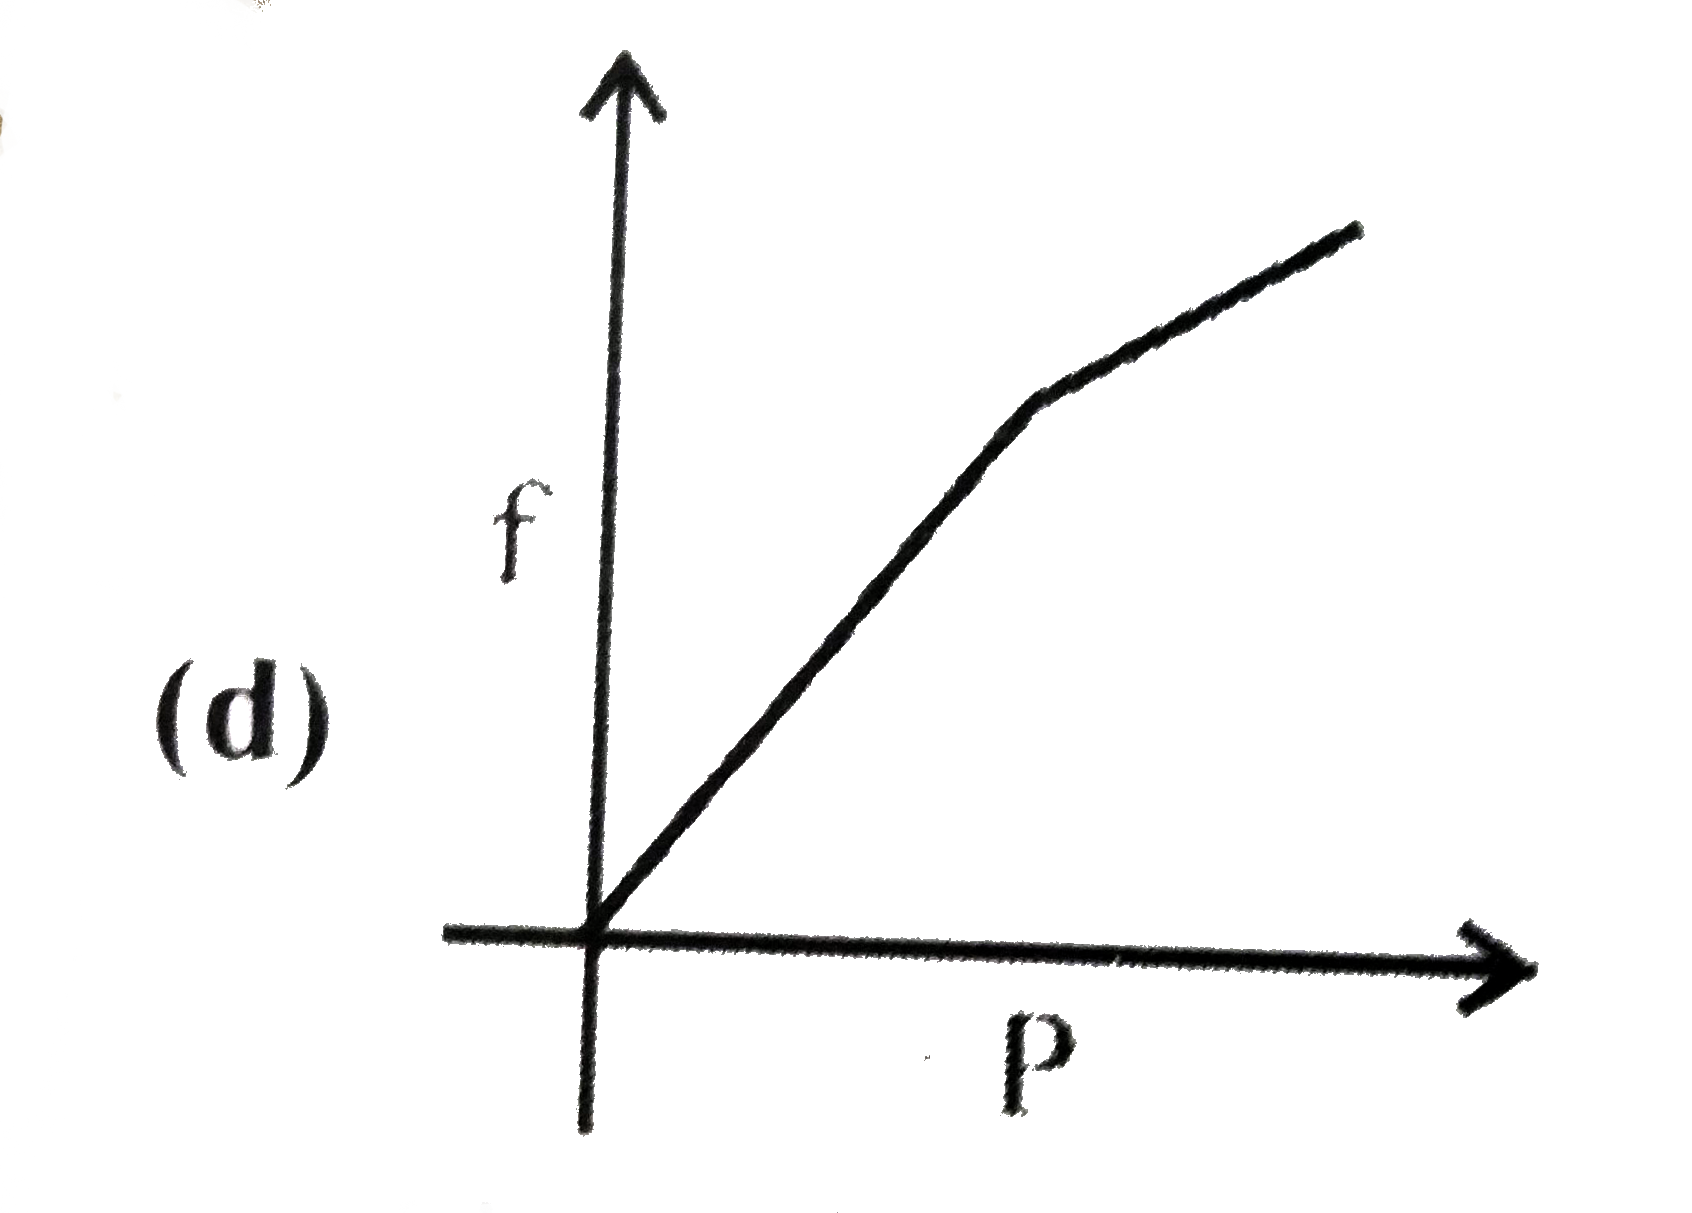
The graph between E and v is
View SolutionThe graph between E and v is
View SolutionWhich of the following.v-t graph can be obtained in practice?

View SolutionWhich of the following graph represents relation between the image position (v) and object position (u) from the concave lens.
View SolutionWhich of the following is incorrect relation between given pairs ?
View Solution

