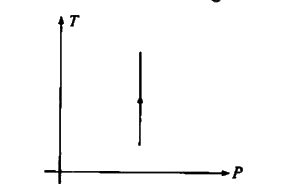
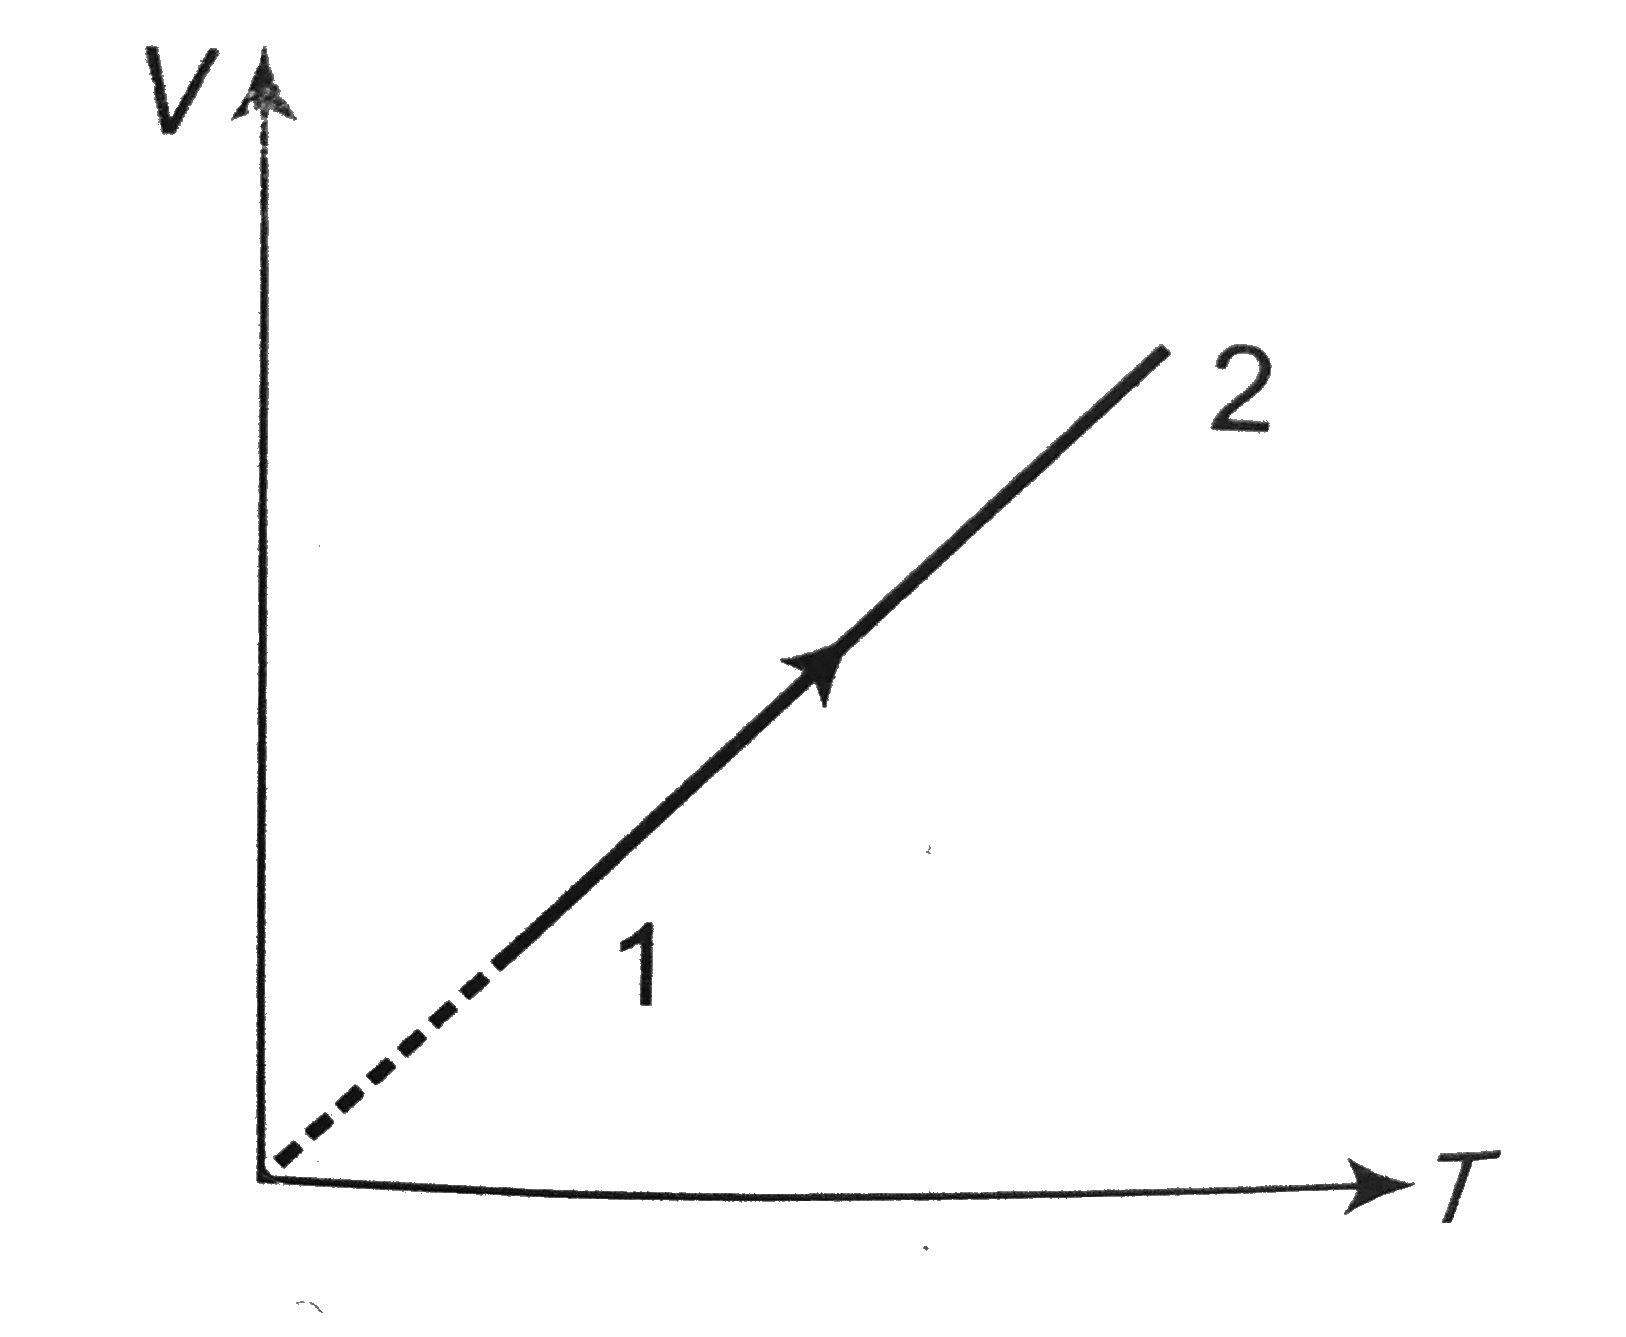
Volume versus temperature graph of two moles of helium gas is as shown in figure. The ratio of heat absorbed and the work done by the gas in process 1−2 is
Video Solution
Text Solution
V-T graph is a straight line passing through origin.
Hence, V∝T or P=cosntant
dQdW=nCPΔTnCPΔT−nC(v)ΔT=nCPΔTnRΔT=5R2R=52
|
Topper's Solved these Questions
- KINETIC THEORY OF GASESBook:NARAYNAChapter:KINETIC THEORY OF GASESExercise:C.U.Q
Explore 153 Videos
- KINETIC THEORY OF GASESBook:NARAYNAChapter:KINETIC THEORY OF GASESExercise:LEVEL-I(C.W)
Explore 32 Videos
- KINETIC THEORY OF GASESBook:NARAYNAChapter:KINETIC THEORY OF GASESExercise:LEVEL-I (H.W)
Explore 12 Videos
- GRAVITATIONBook:NARAYNAChapter:GRAVITATIONExercise:EXERCISE -IV
Explore 40 Videos
- LAW OF MOTIONBook:NARAYNAChapter:LAW OF MOTIONExercise:EXERCISE - IV
Explore 35 Videos
Similar Questions
Knowledge Check
Find work done by the gas in the process shown in figure.
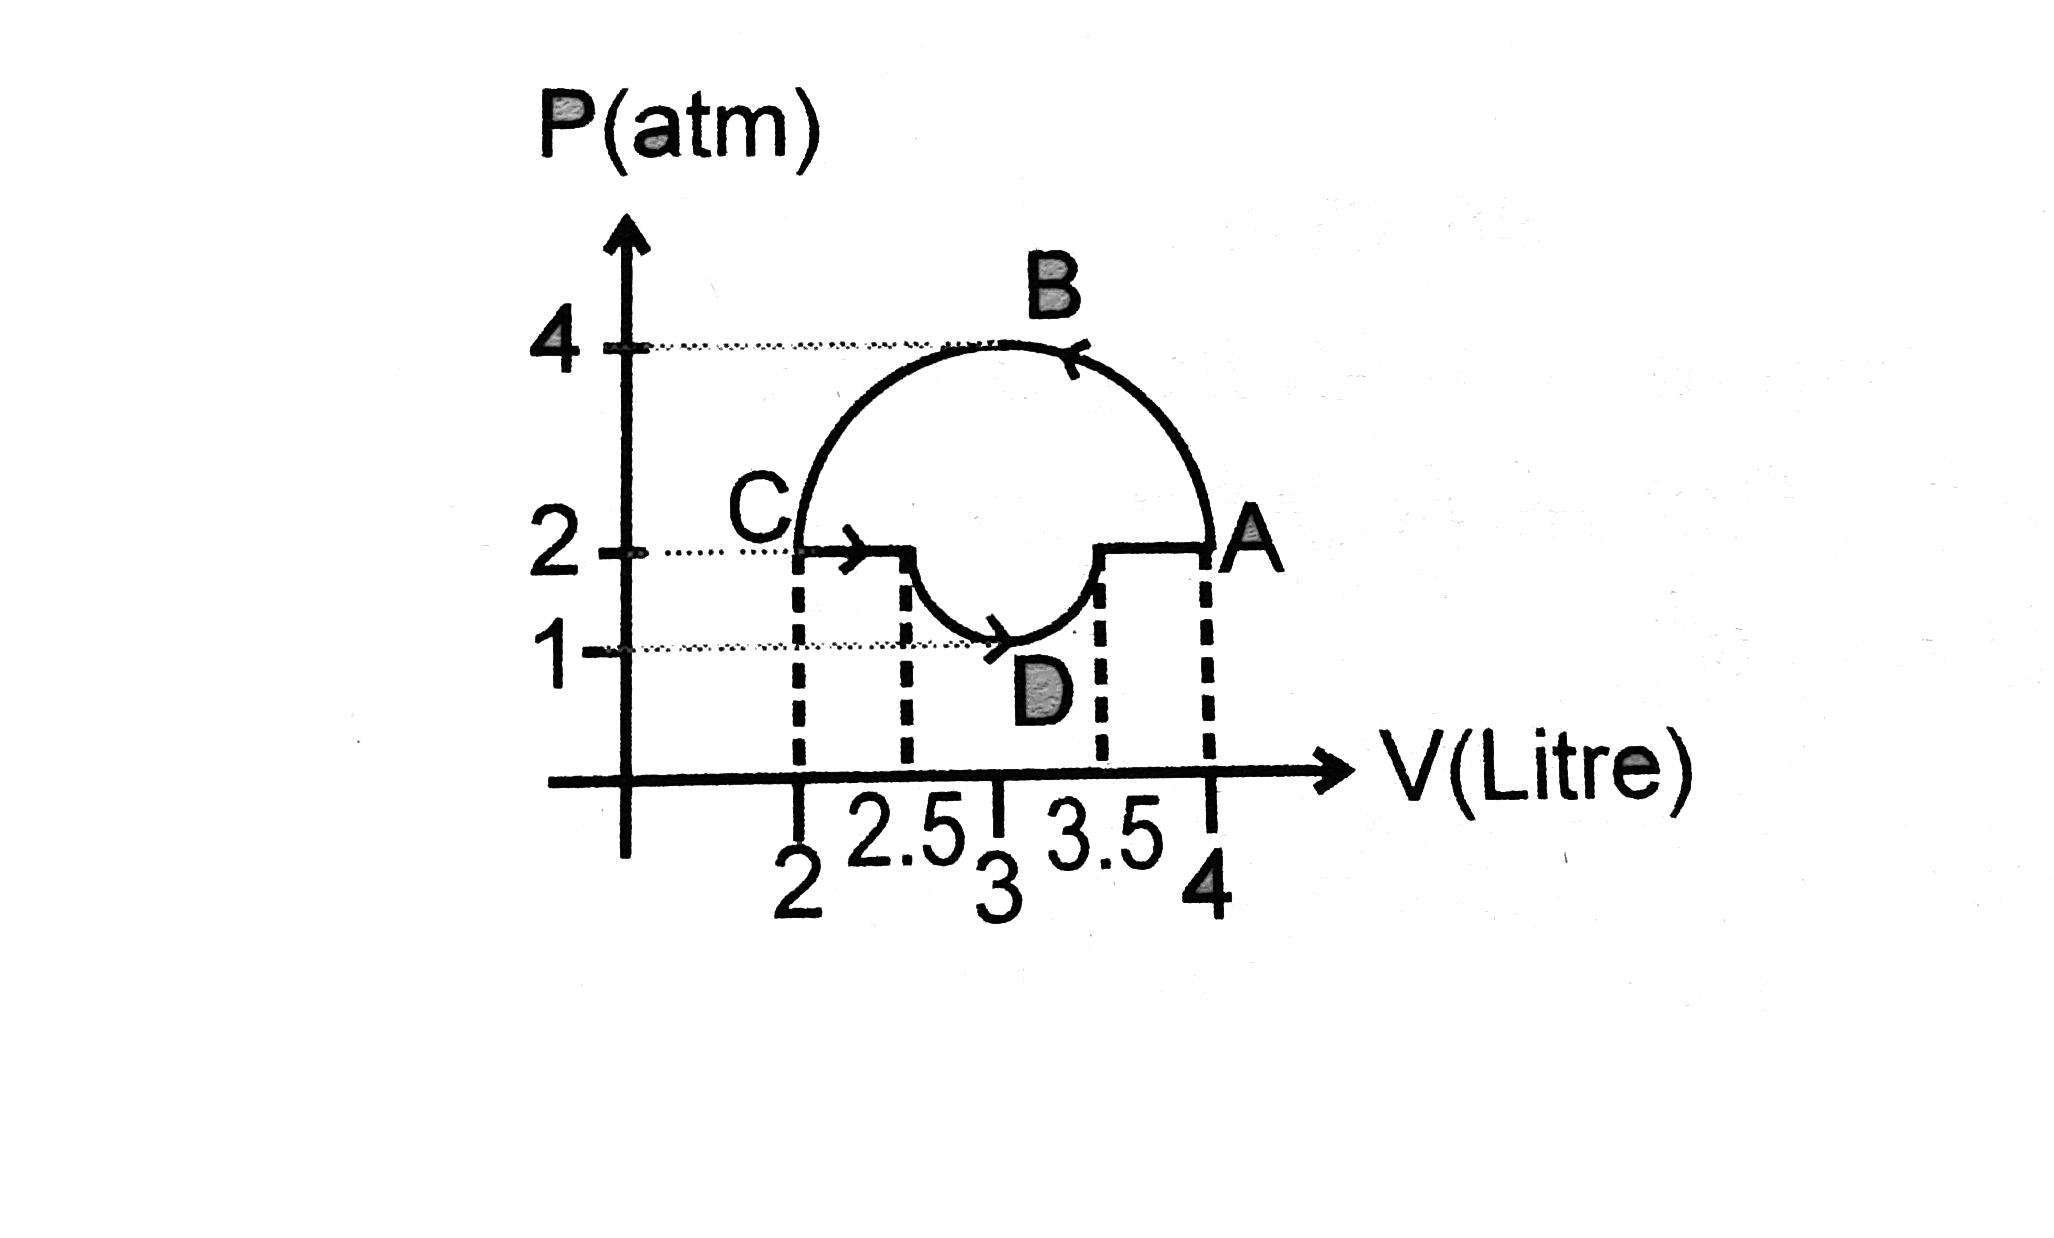 A52πatmLB52atmLC−32πatmLD−54πatmL
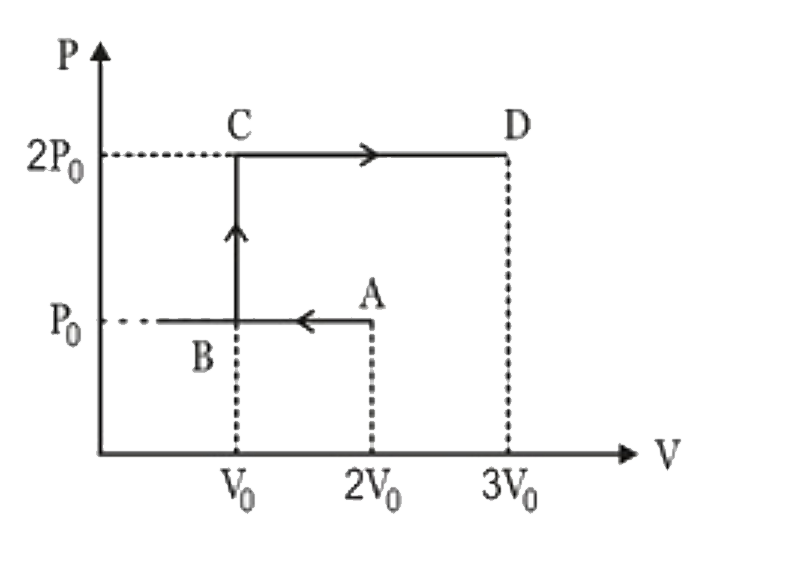
Two moles of helium gas are taken along the path ABCD (as shown in Fig.) The work done by the gas is
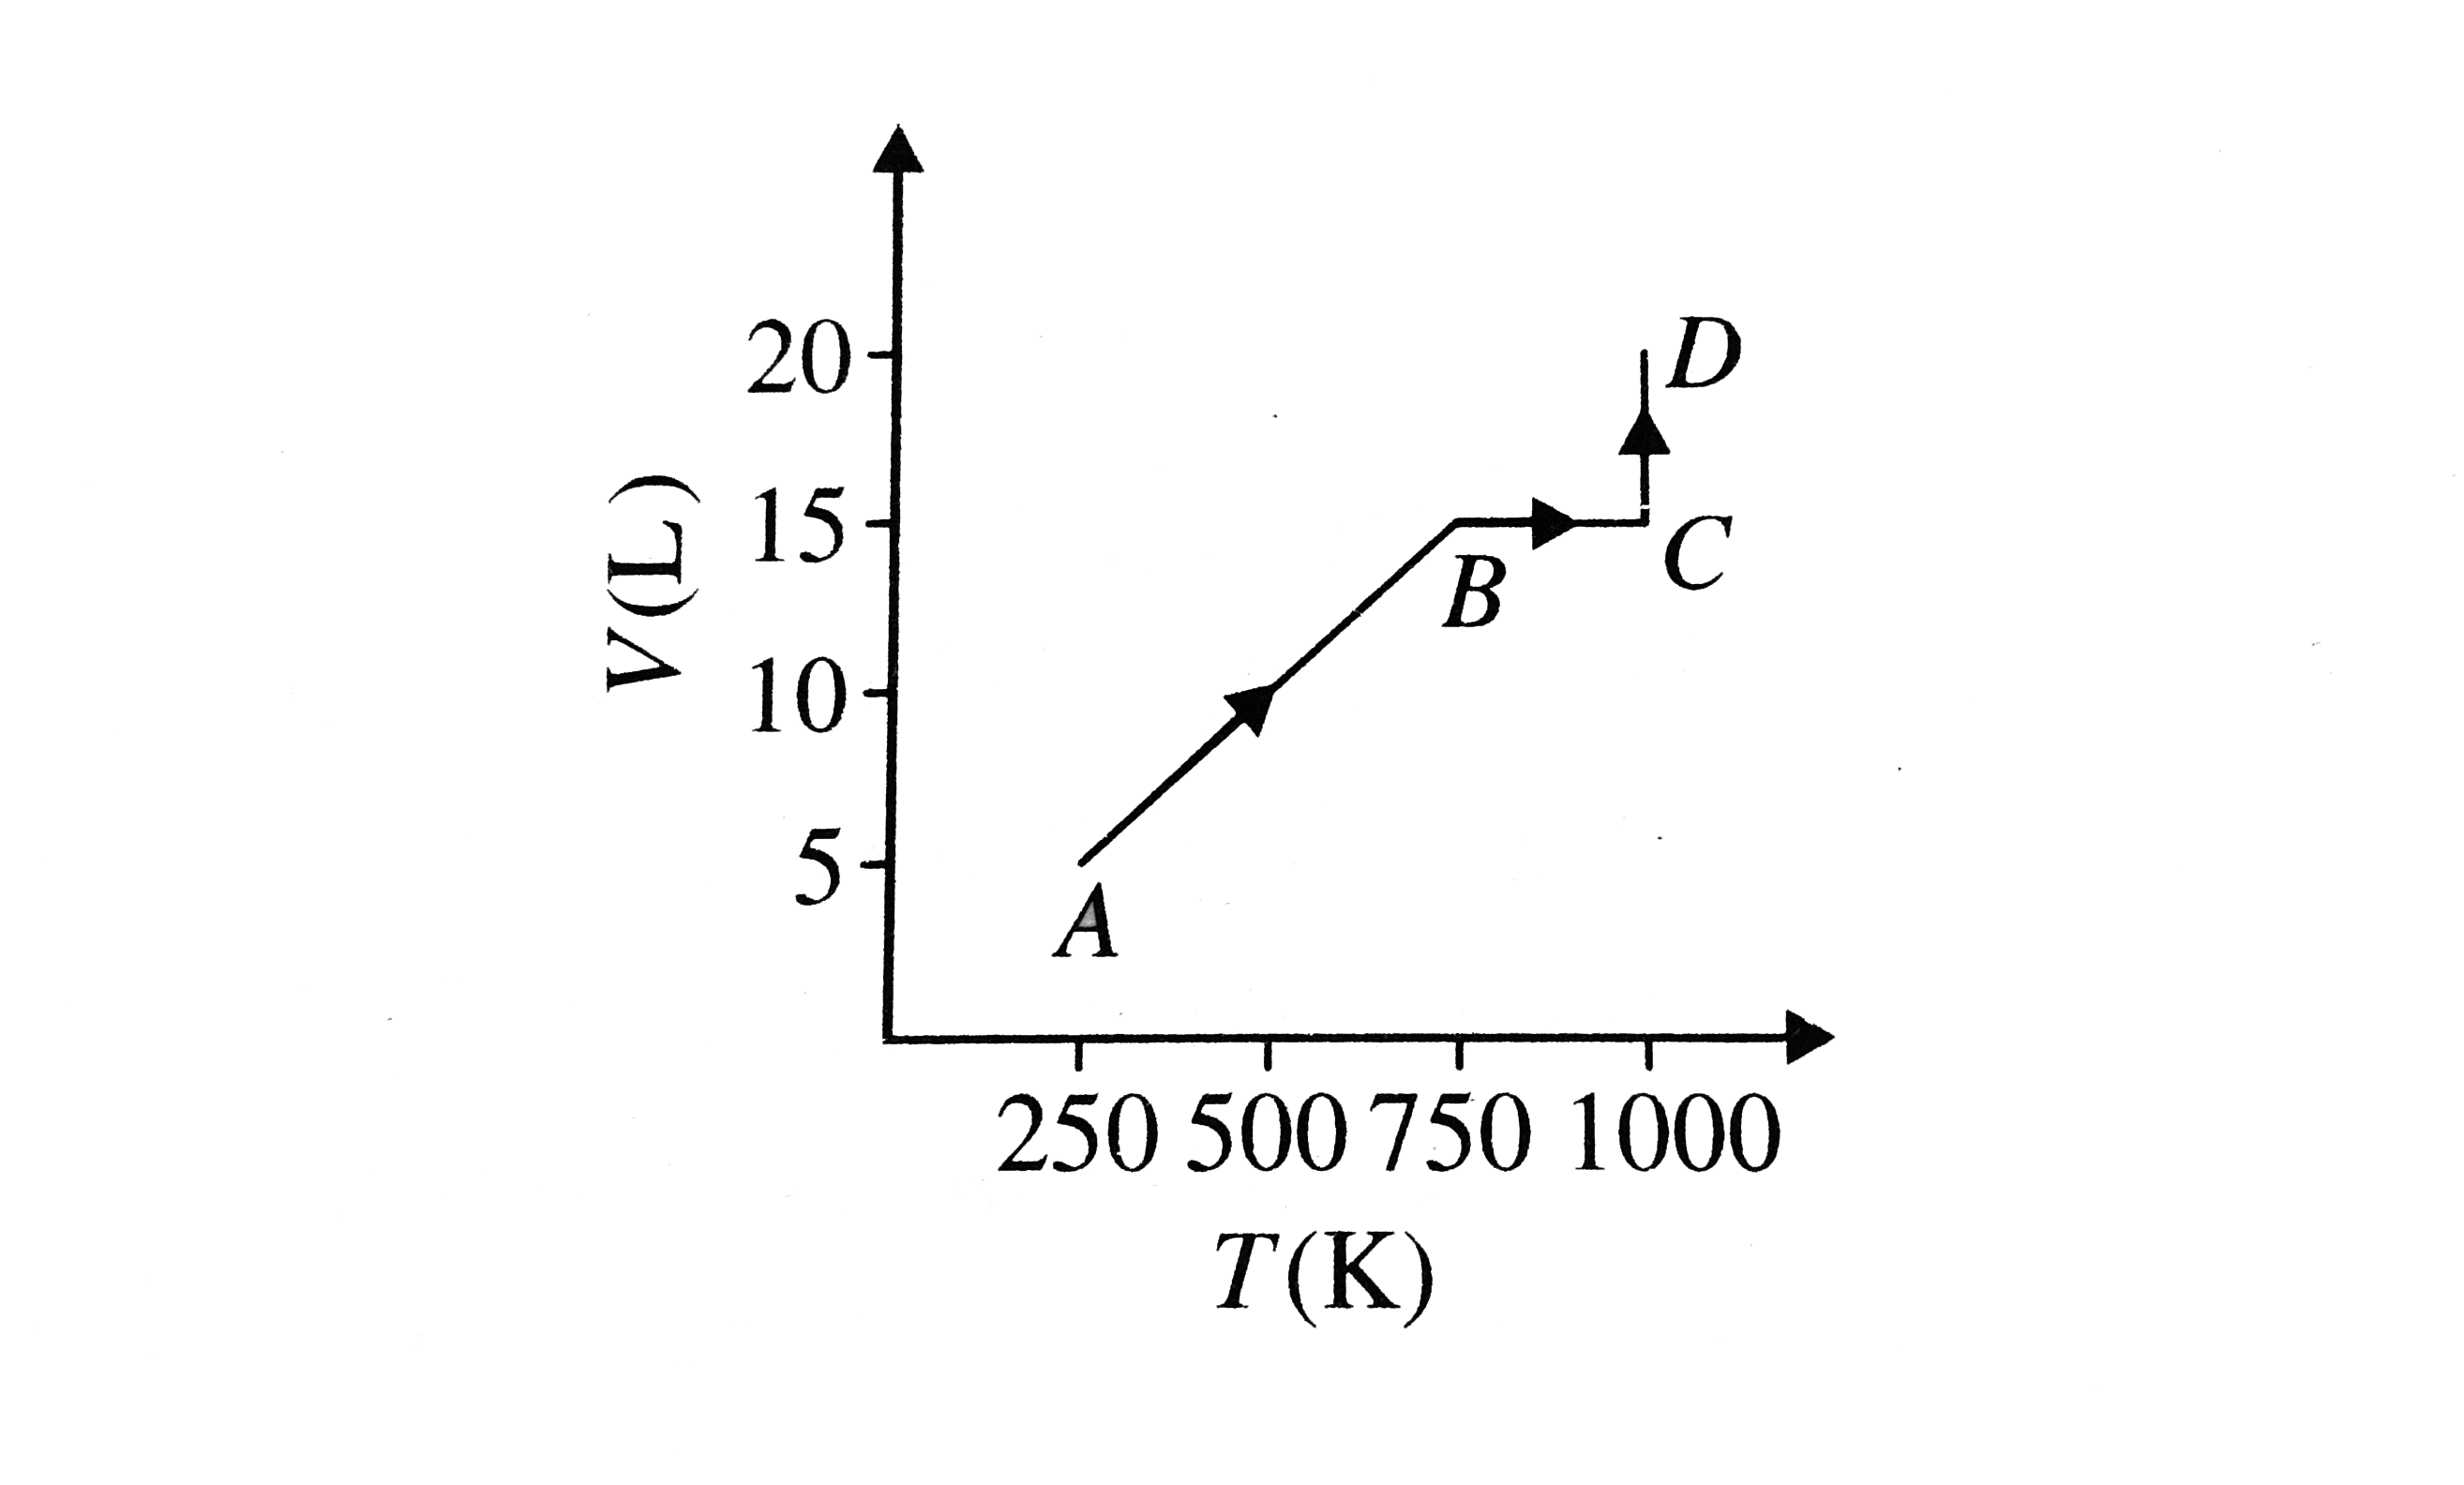 A2000R(12+1n43)B500R(R+1n4)C500R(2+1n169)D1000R(1+1n169)
Find work done by the gas in the process shown in figure :
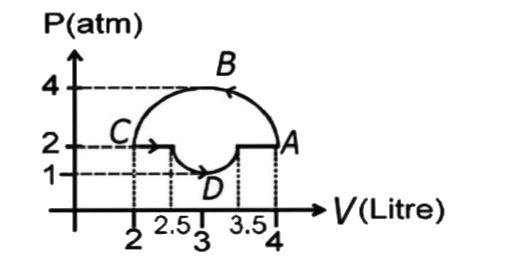 A52πatmLB52atmLC−32πatmLD−54πatmL
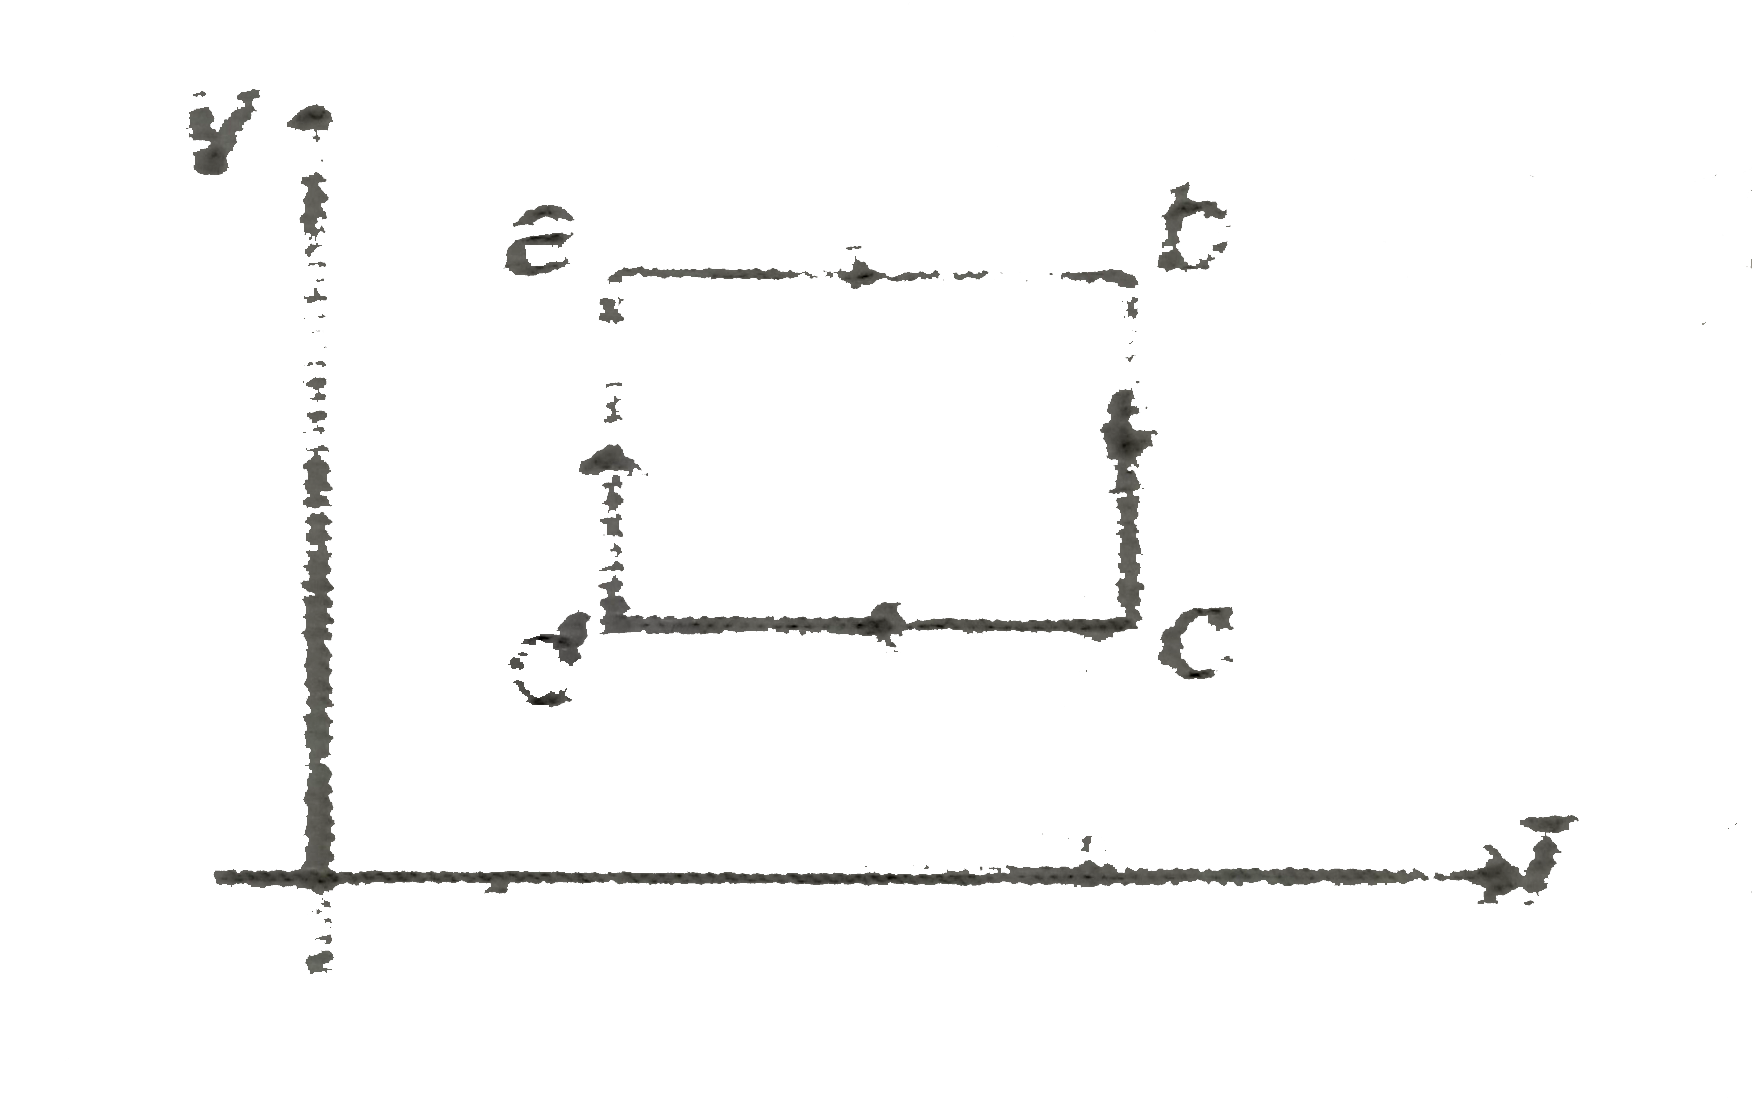
V-T graph of a process of monoatomic ideal gas is shown in figure.
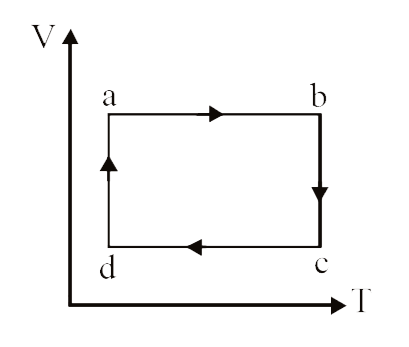
Sum of work done by the gas in process abod is-
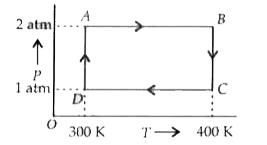
View SolutionTwo moles of helium gas undergo a cyclic process as shown in figure. Assuming the gas to be ideal. The net work done by the gas is
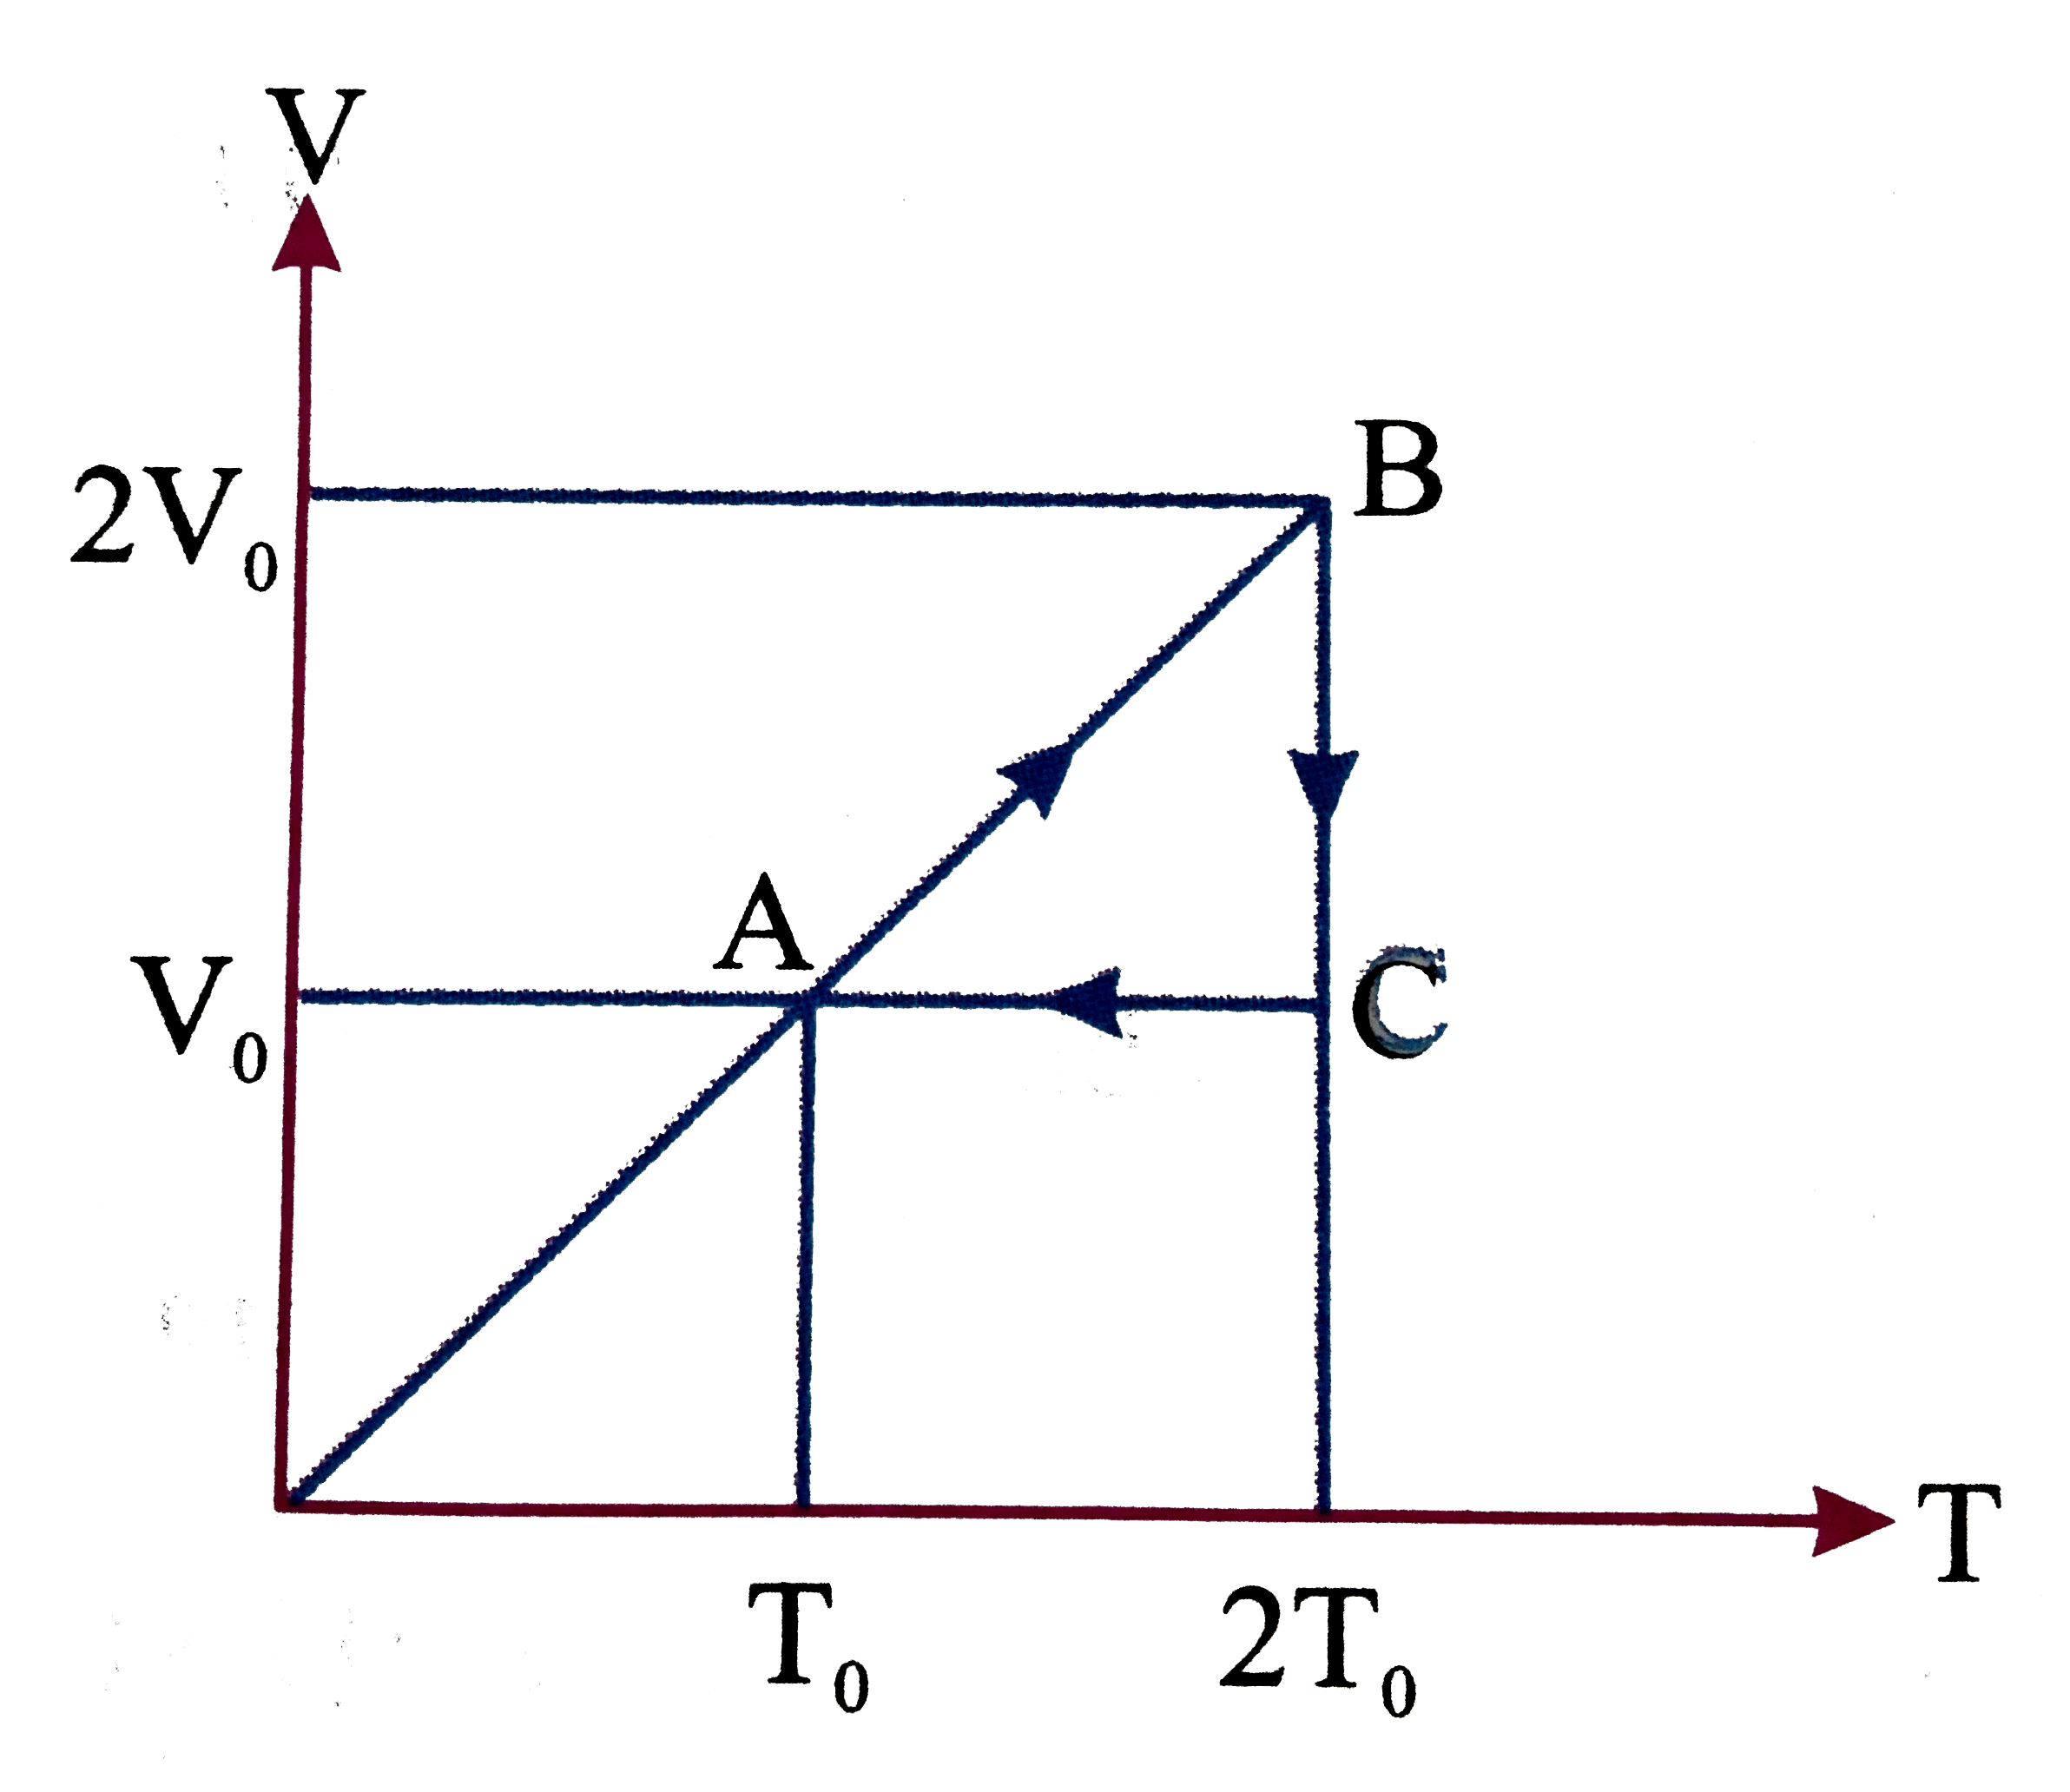
View SolutionAn ideal monoatomic gas undergoes a cyclic process ABCA as shown in the figure. The ratio of heat absorbed during AB to the work done on the gas during BC id
View Solutiongraph of an ideal gas is as shown in figure.
Heat is supplied to the gas in process (s).
View SolutionP – V graph of an ideal gas is as shown in the diagram . Work done by the gas in the process ABCD is
View Solution


