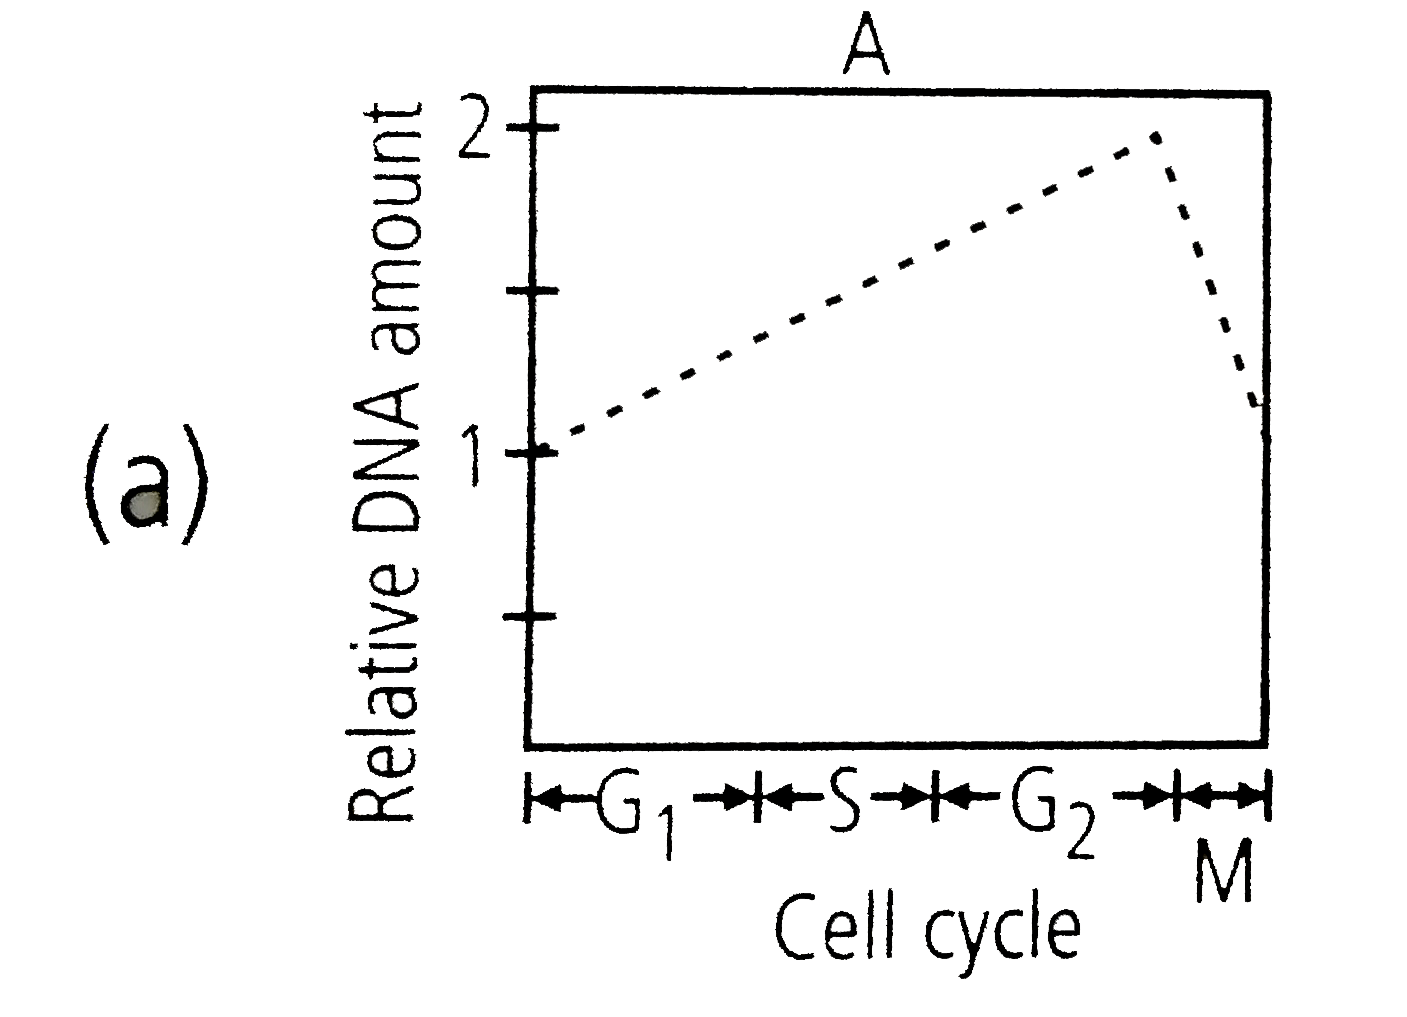
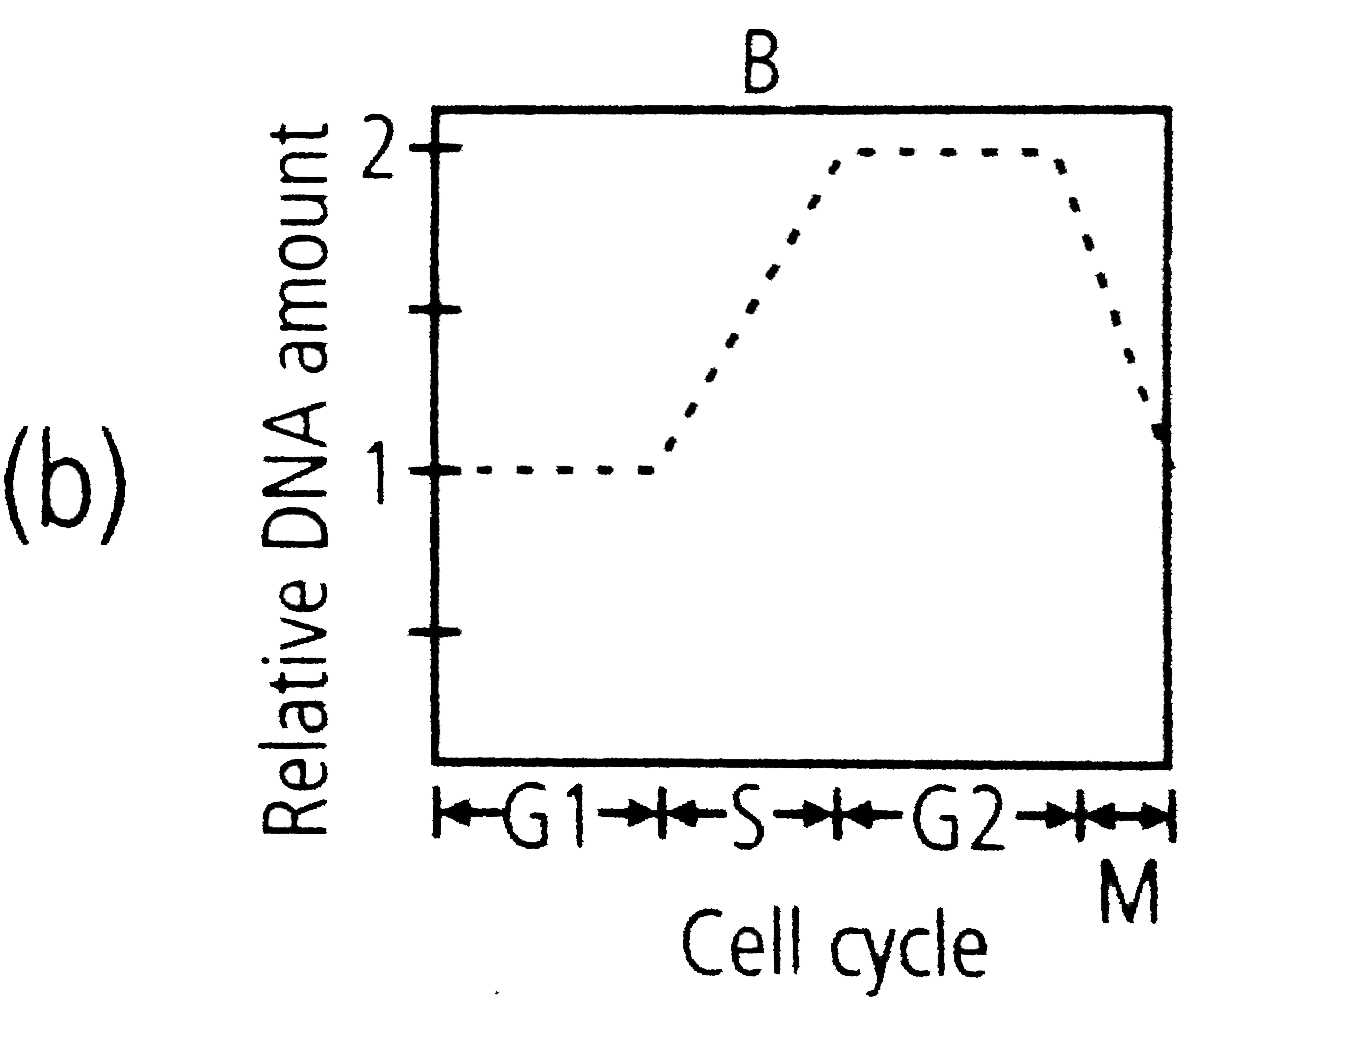
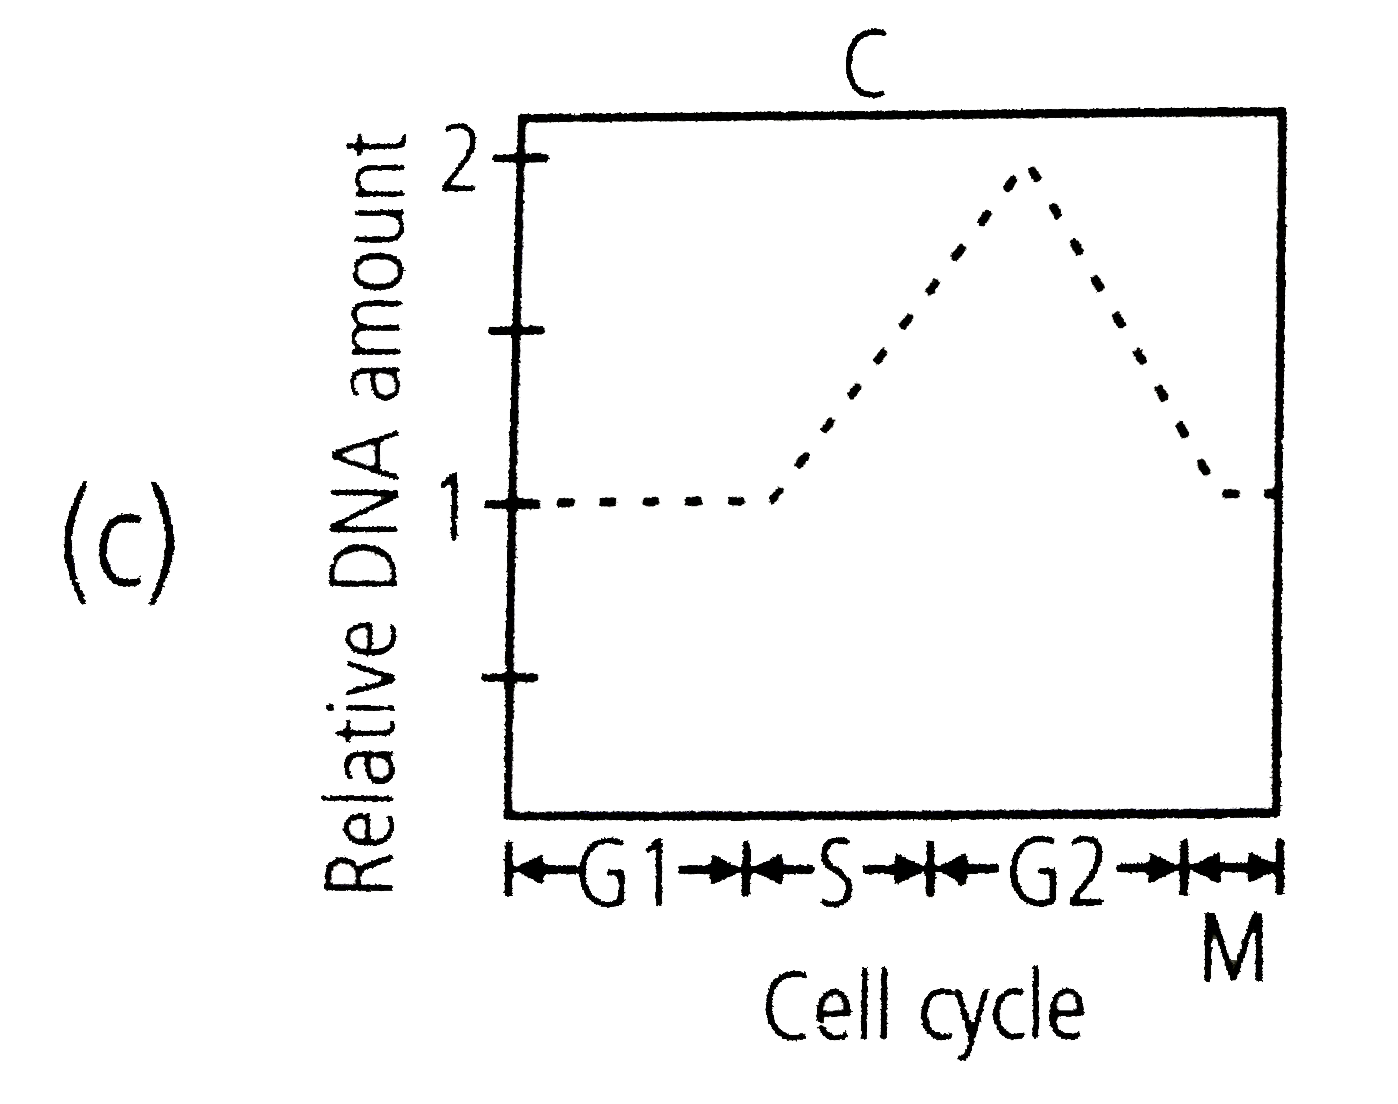
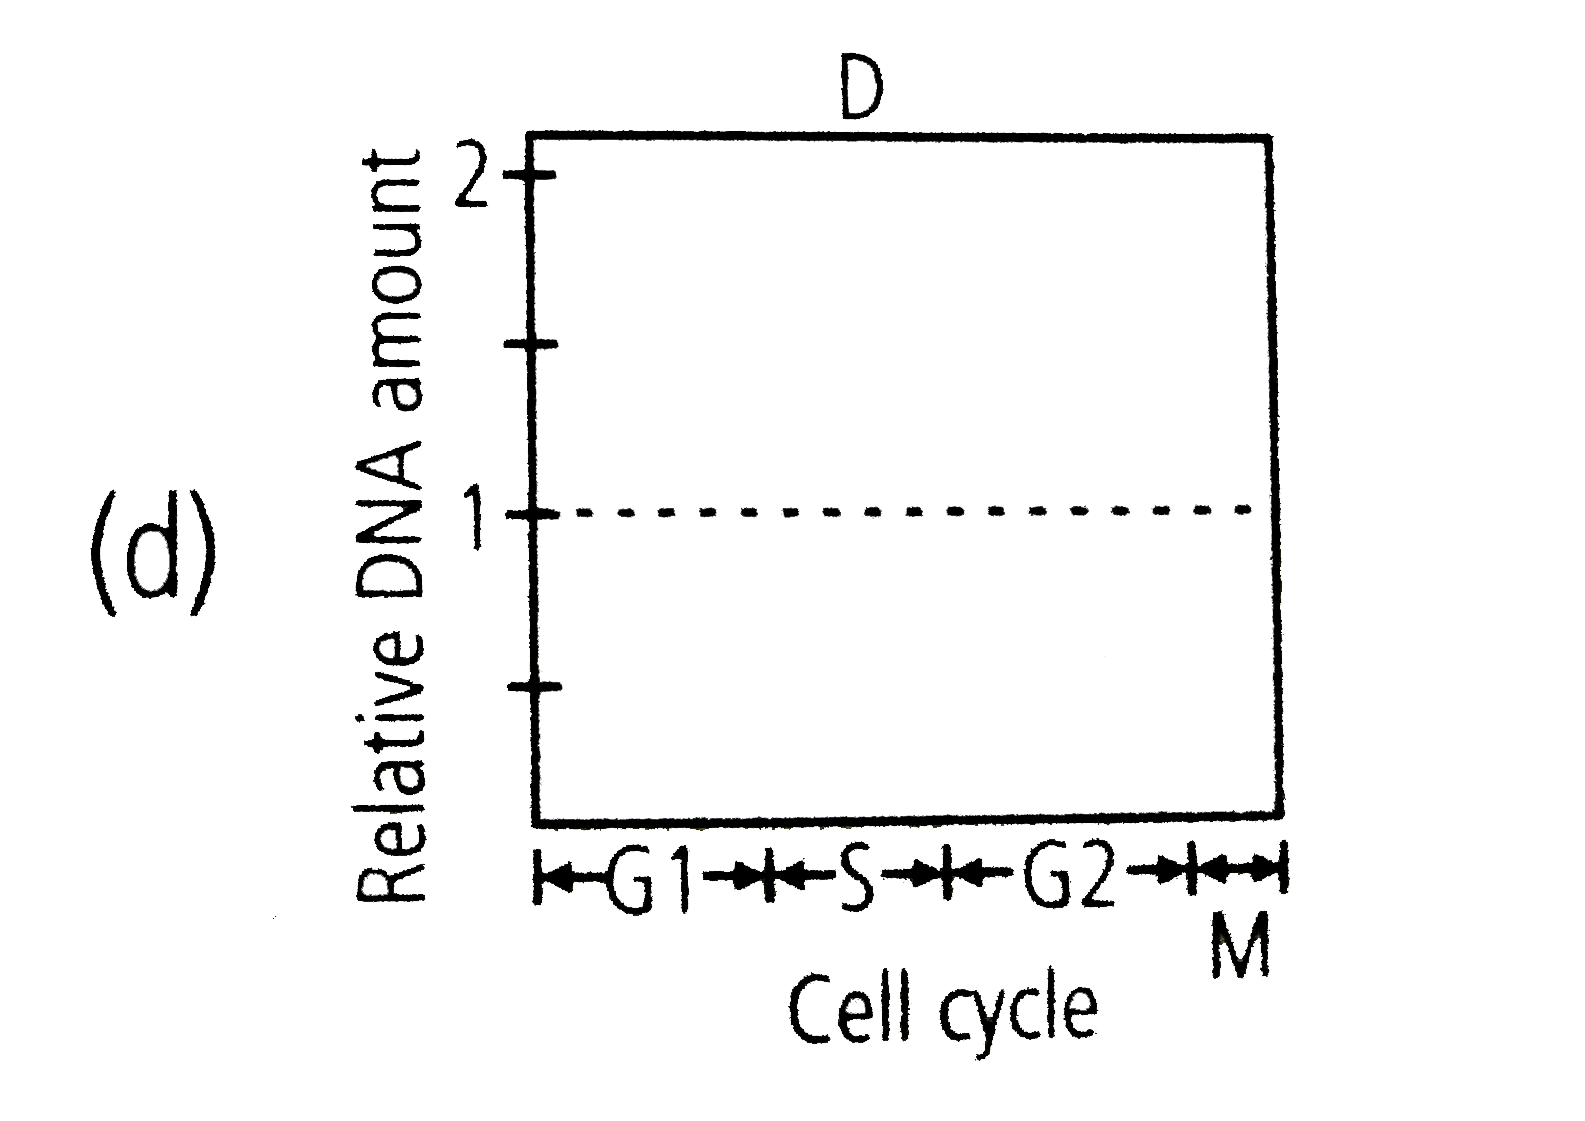
Which of the following graphs shows the relative change in the amount of mitochondrial DNA of a cell undergoing mitosis?
A
B
C
D
Video Solution
Text Solution
The correct Answer is:A
Mitochondrion has its own replication cycle. Completely separate from the cell in which if resides.
|
Topper's Solved these Questions
Similar Questions
Knowledge Check
Haploid cells undergo mitosis in
AAll plants and all animalsBSome lower plants some social insectsCAll higher plants and higher animalsDMuscle cells of humanIn which of the following graphs, the total change in momentum is zero ?
A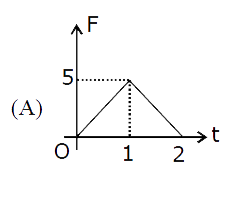 B
B C
C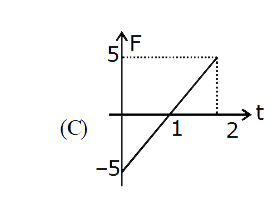 D
D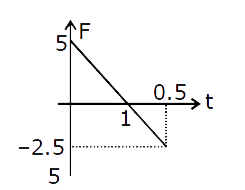
Which of the following processes results in a change of the cellular amount of DNA ?
ABlastulationBFertilizationCCytokinesisDSpore formation
Which of the following graphs show the v−t graph of a ball thrown upwards ?
View SolutionWhich of the following substances undergoes chemical change an heating?
View SolutionWhich of the following graphs shows the change in pH when zinc carbonate is added to hydrochloric acid until it is excess ?
View SolutionWhich of the following sets of cell organelles contain DNA :-
View SolutionWhich of the following undergoes change in mutation :-
View Solution

