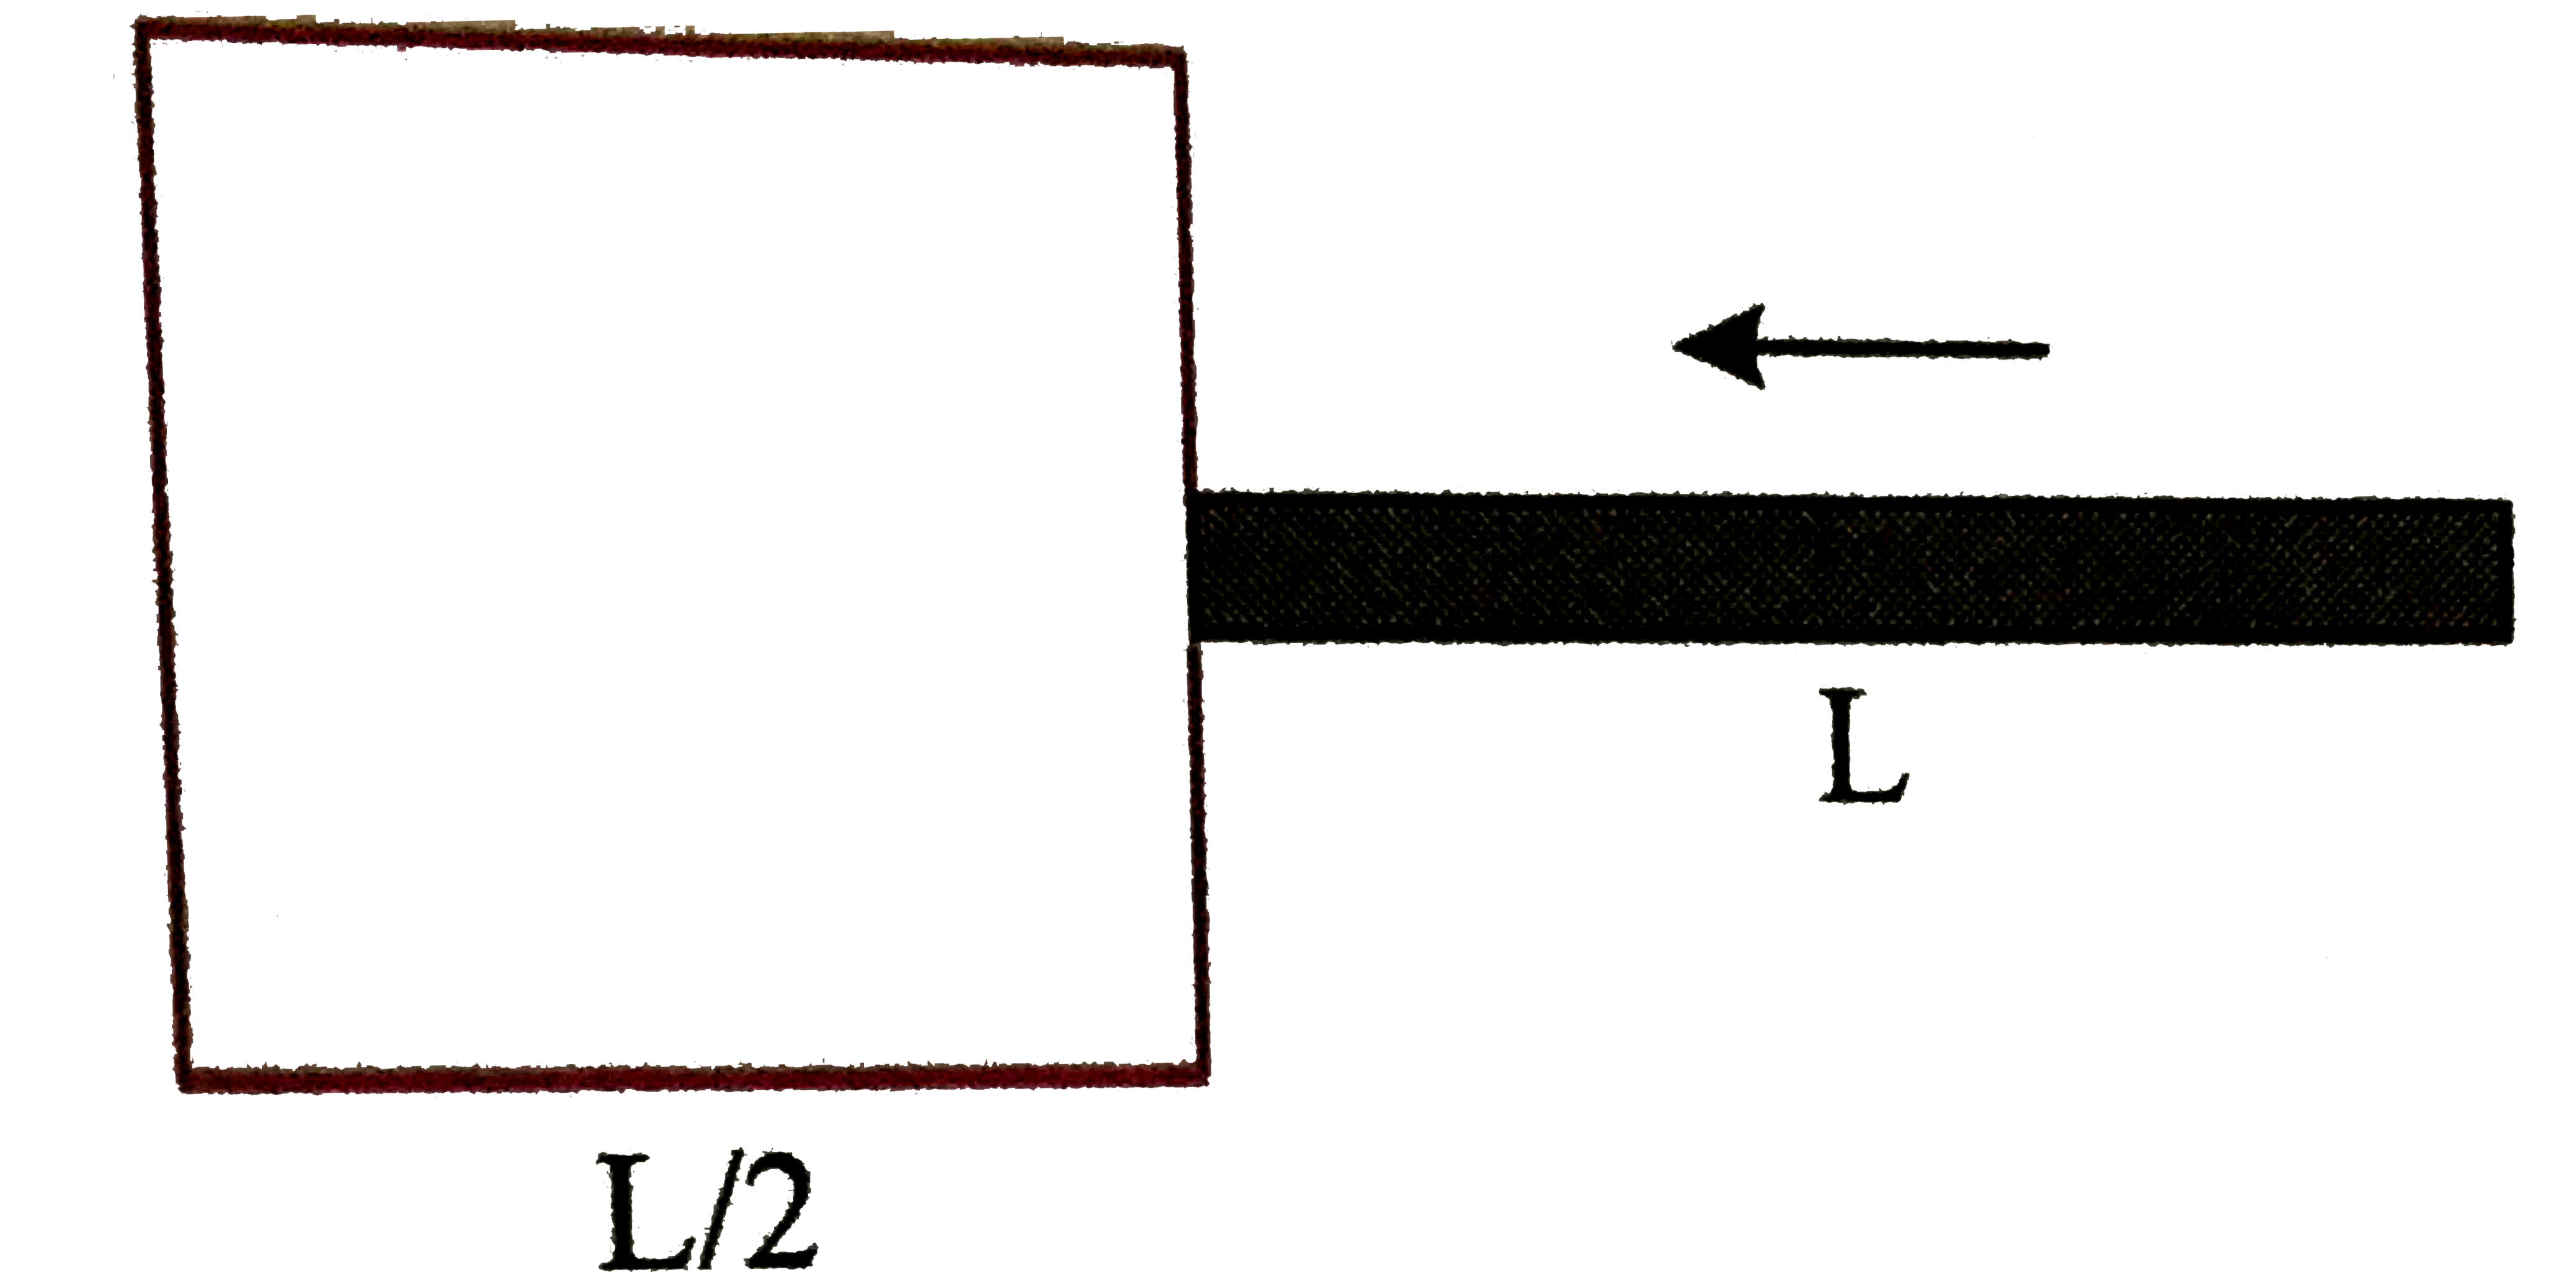
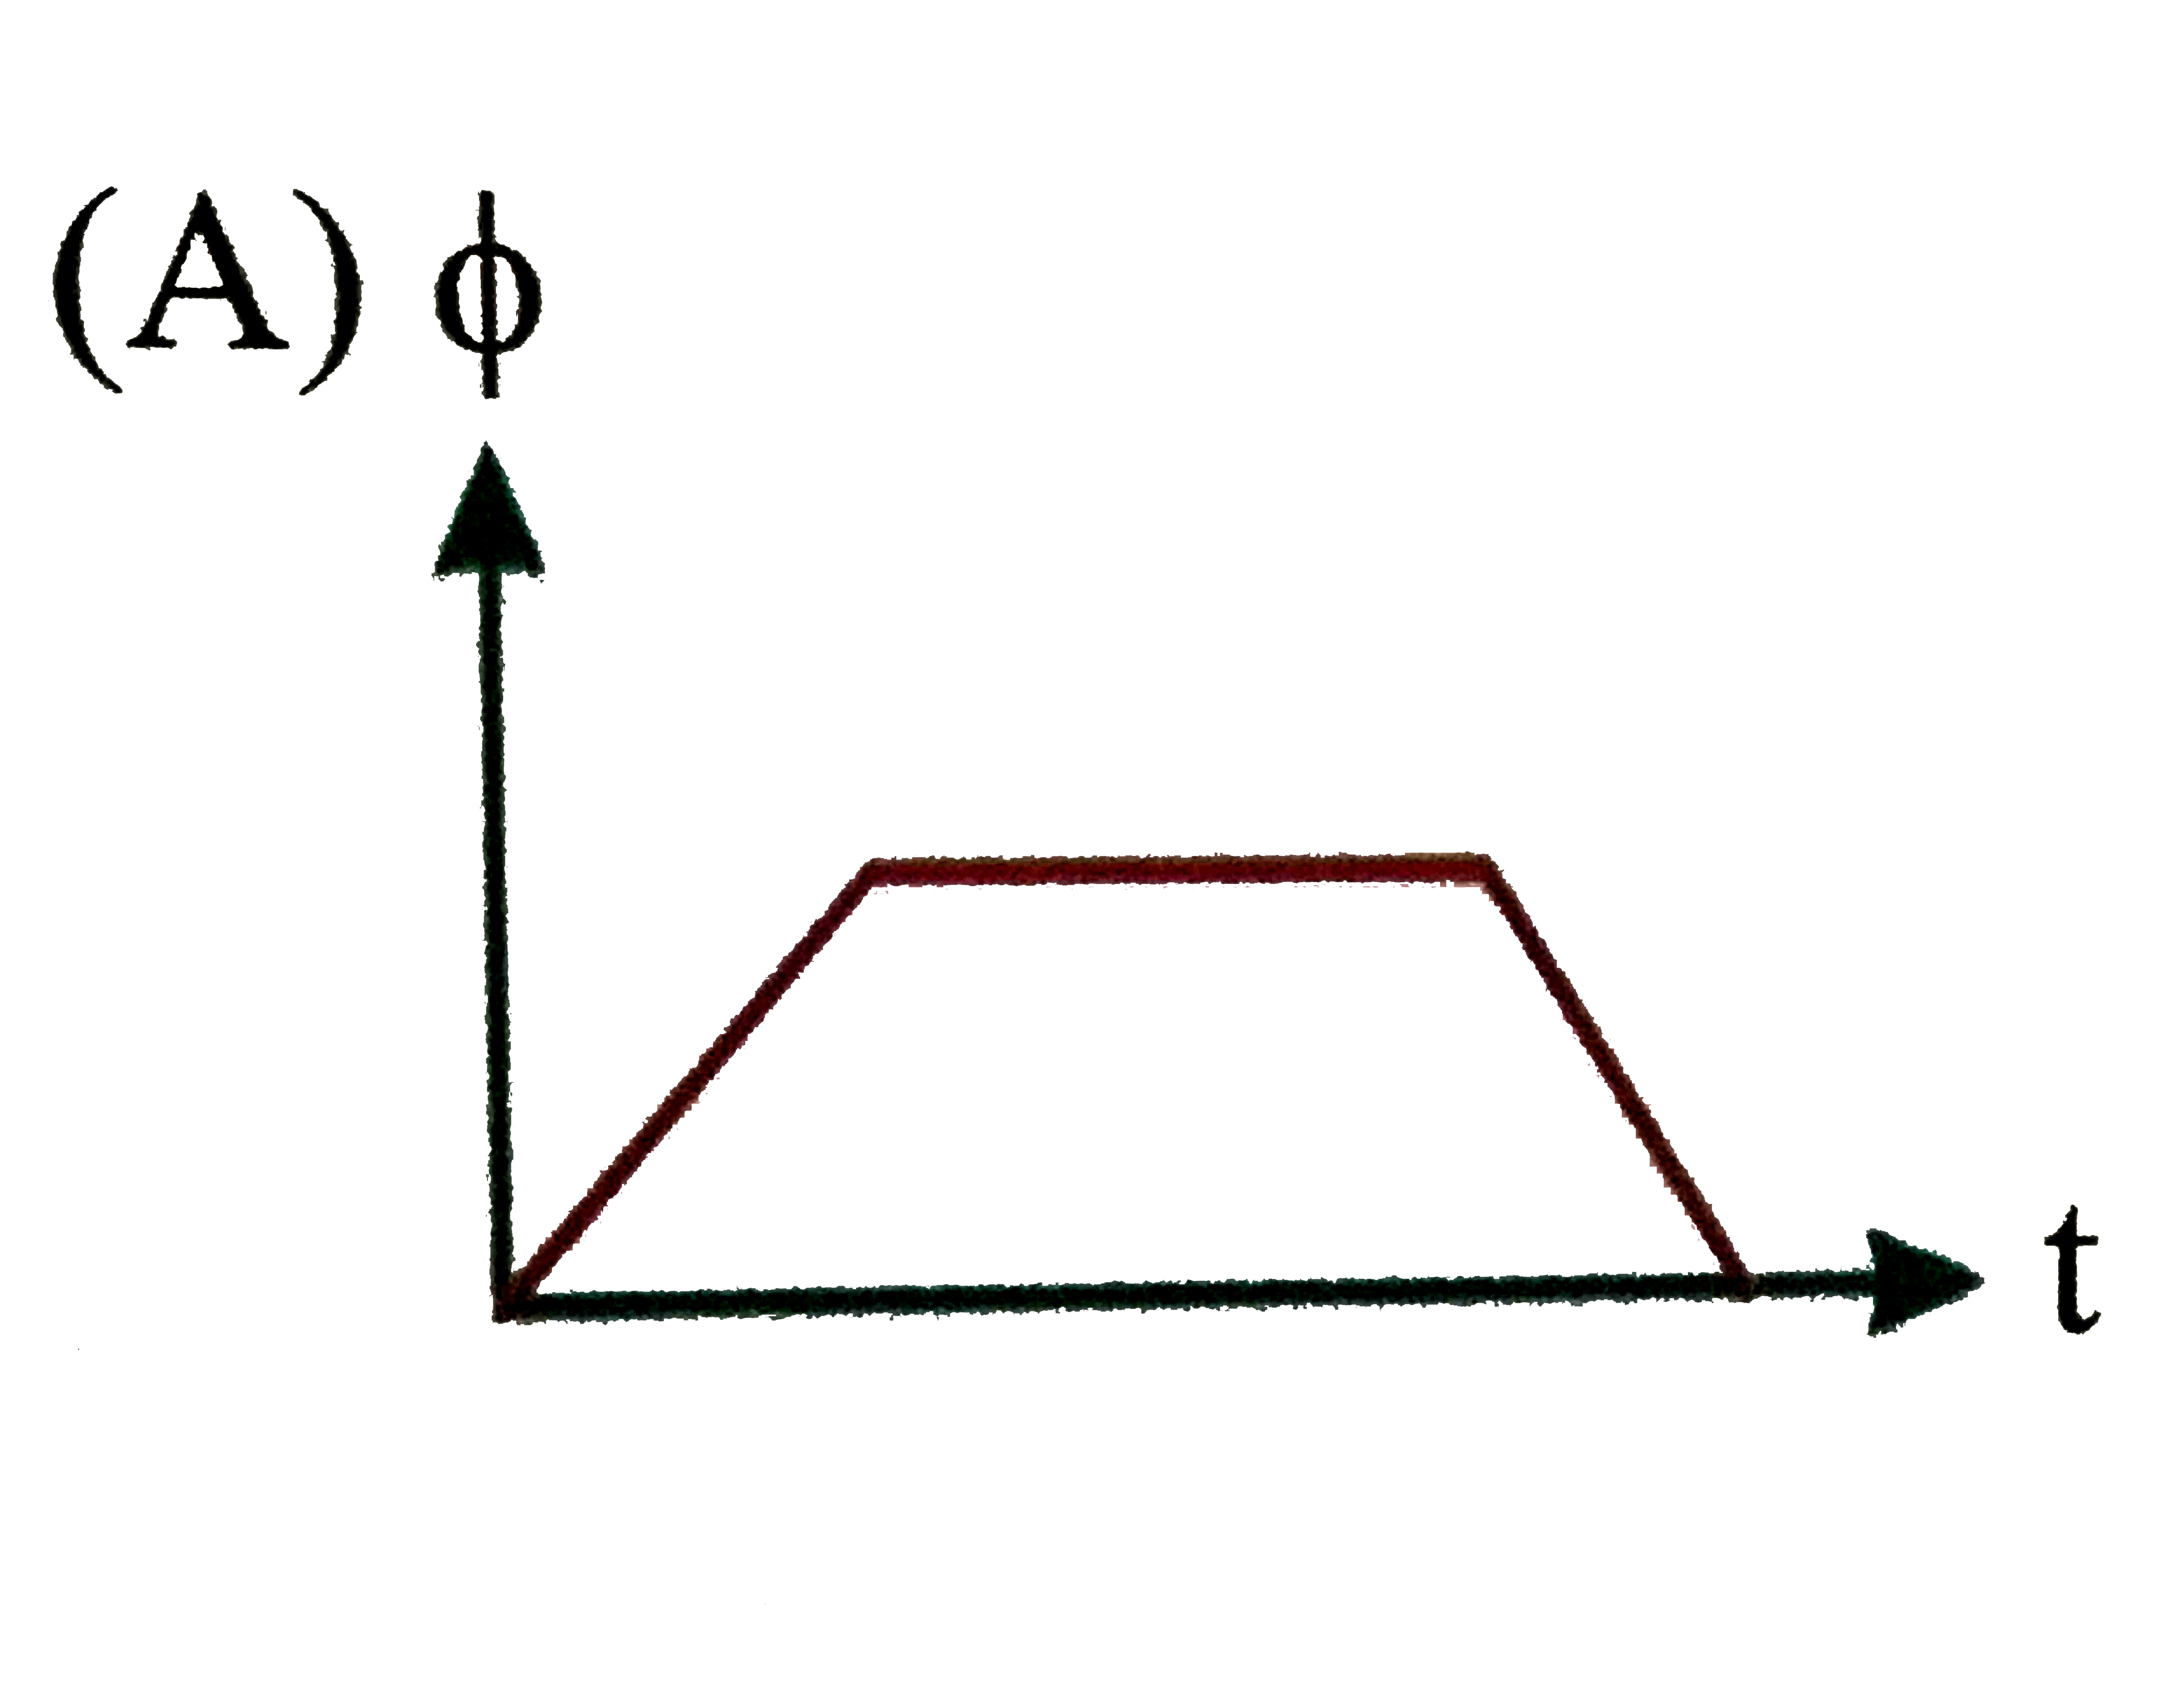
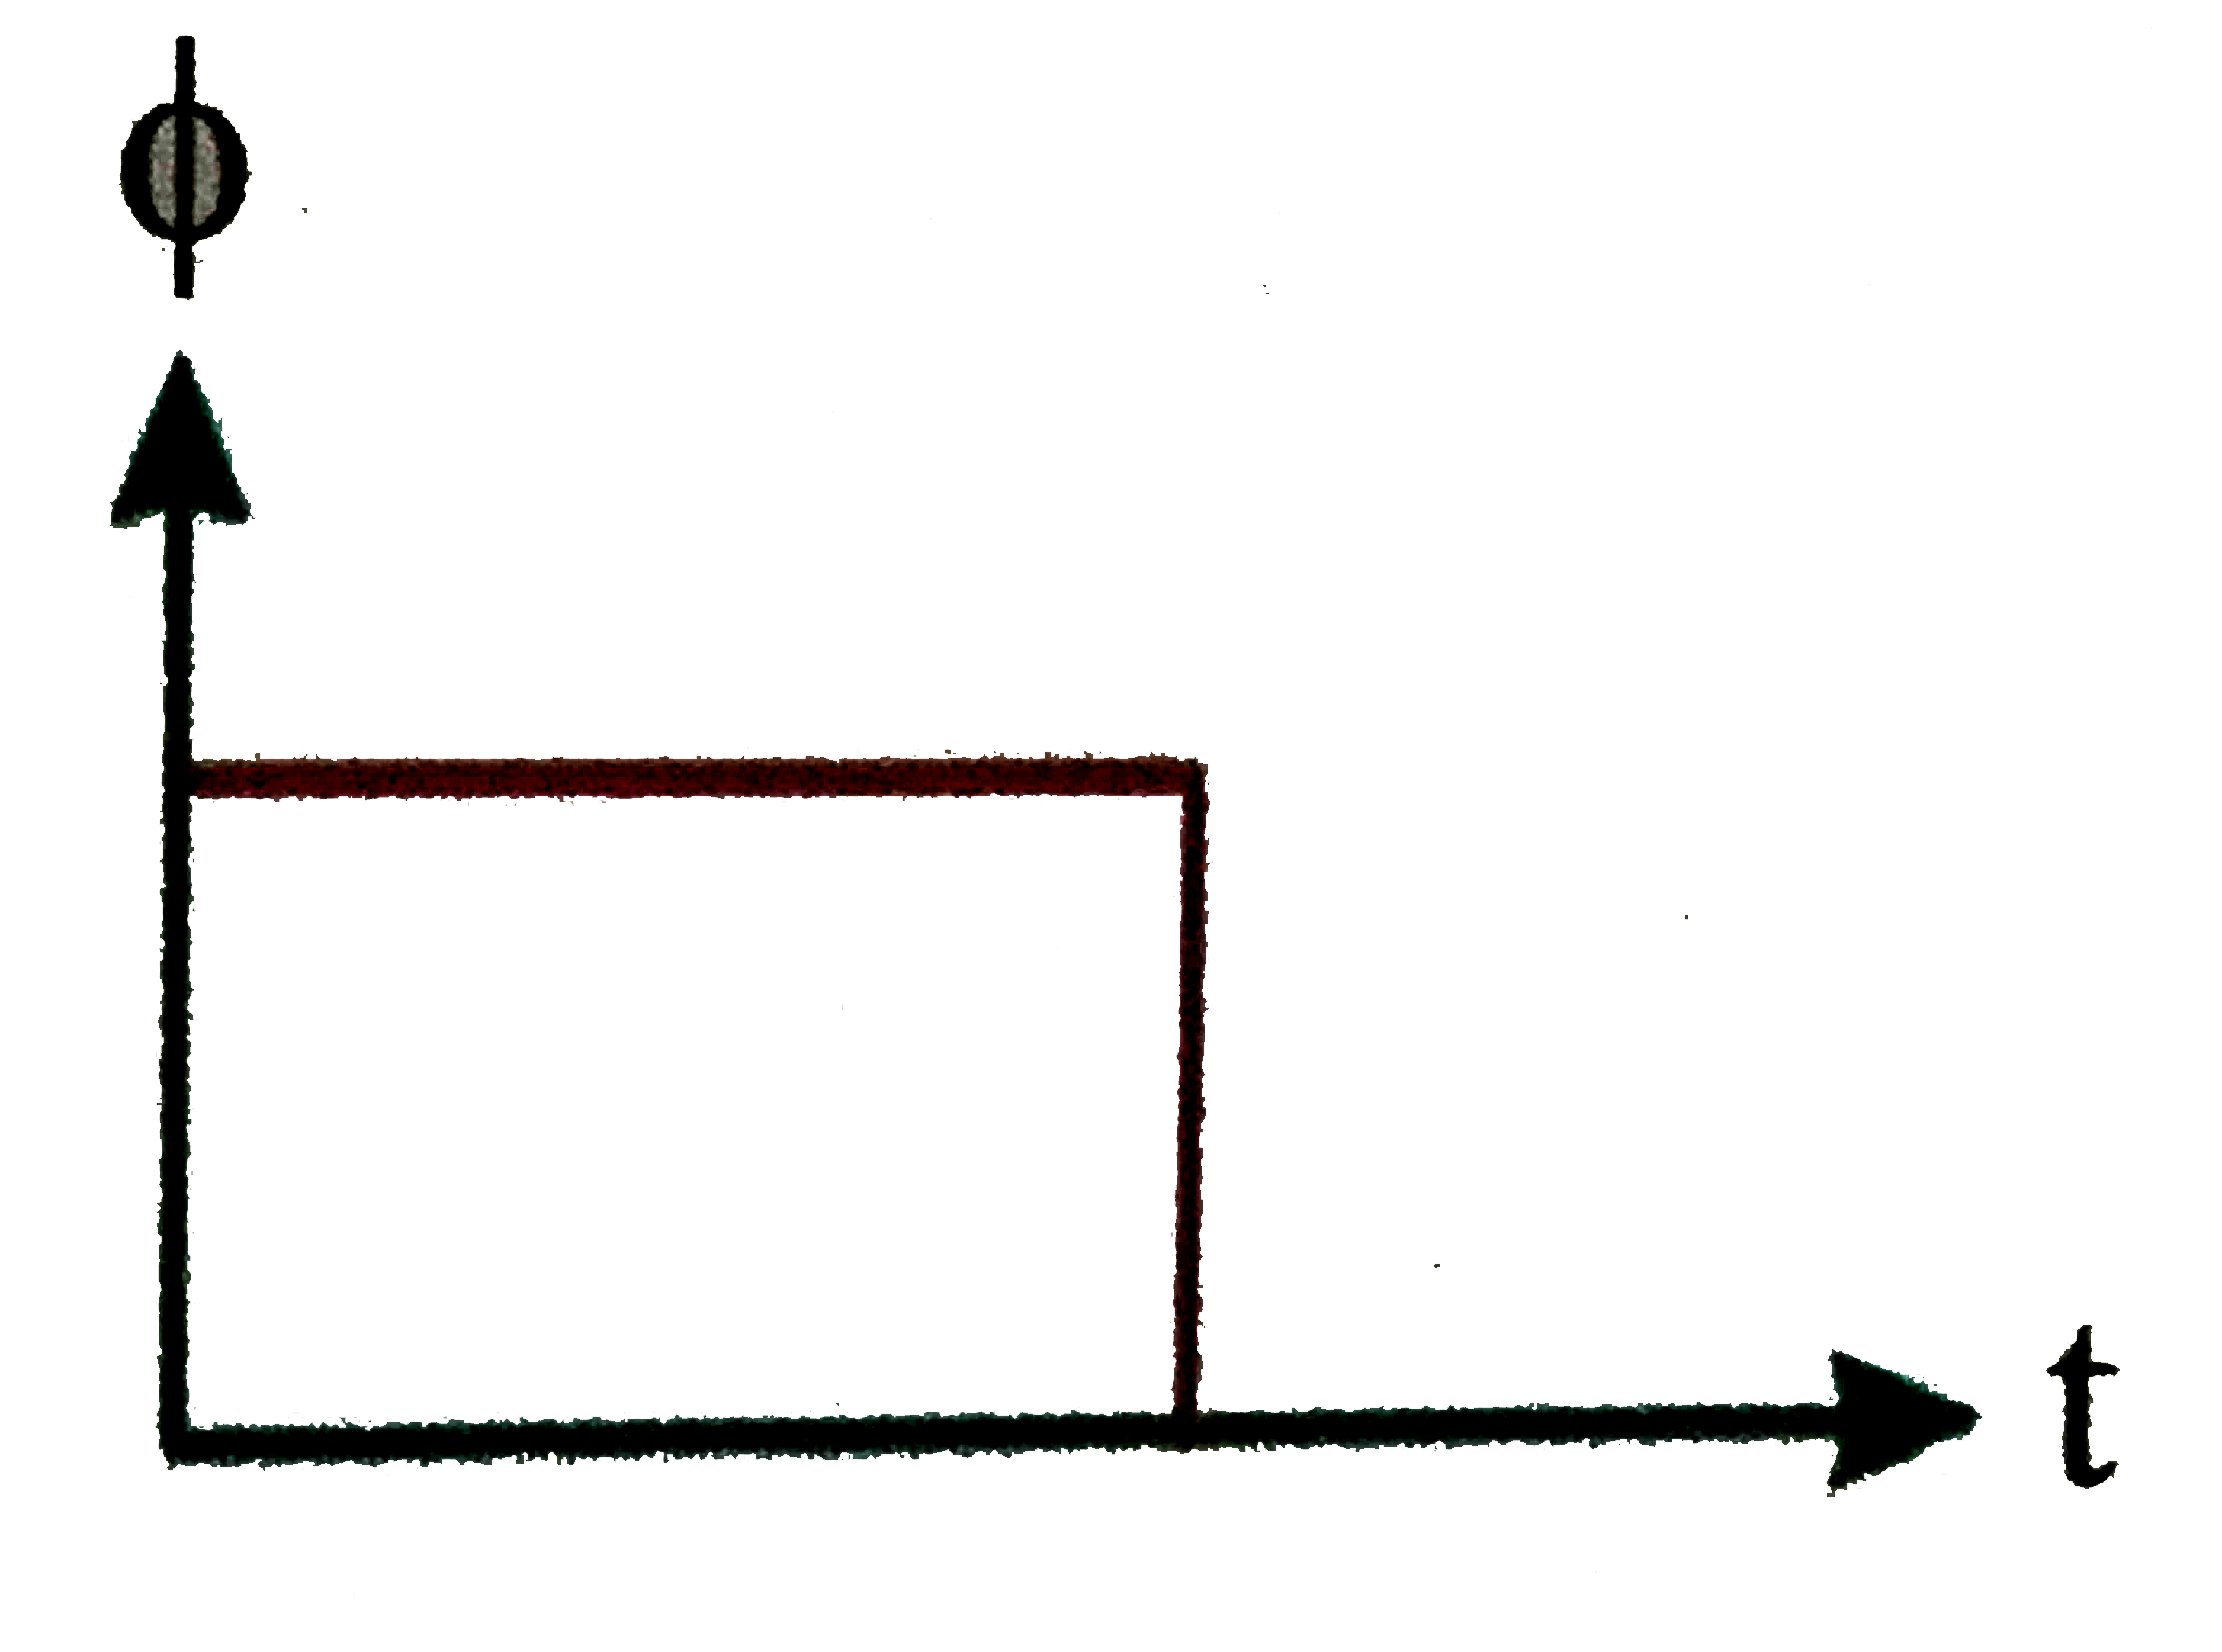
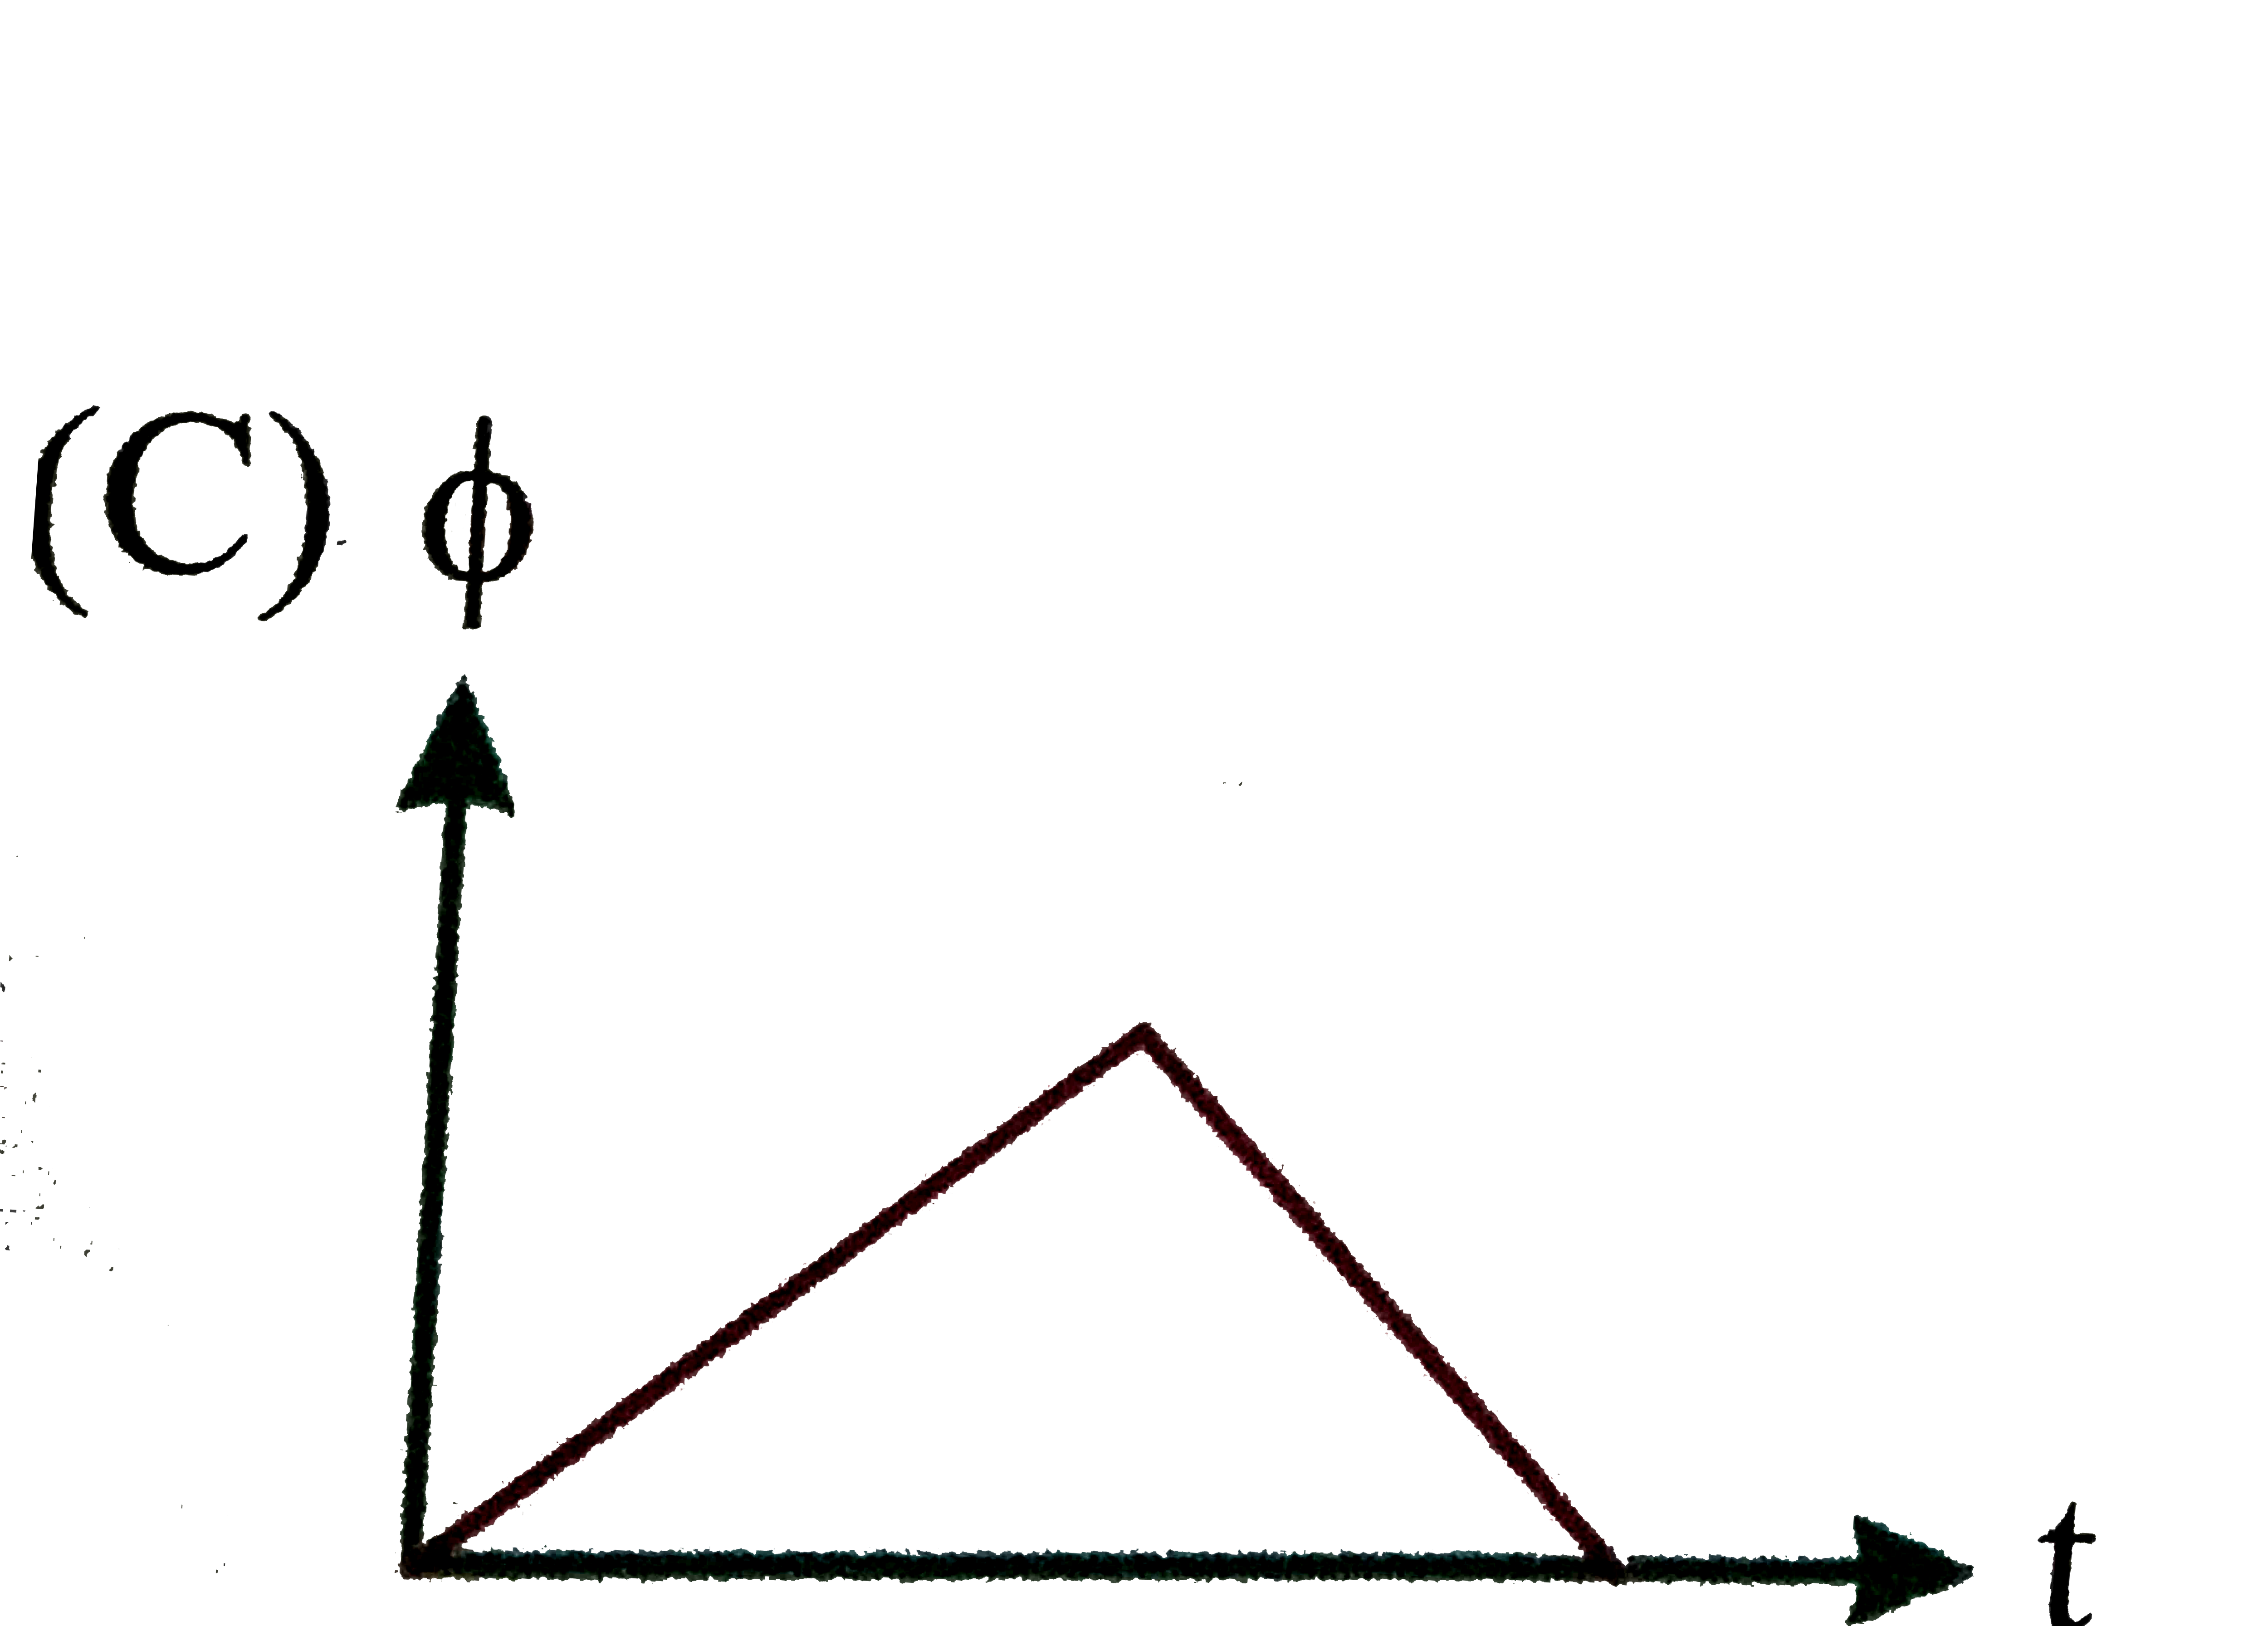
The figure shows an imaginary cube of length L/2 and a uniformly charged rod of length L touching the centre of the centre of the right face of the cube normally.At time t=0 the rod starts moving to the left slowly at a constant speed v .The electric flux (F) thriguh the cube si plotted against time (t) .The correct graph showing the variation of flux with time is
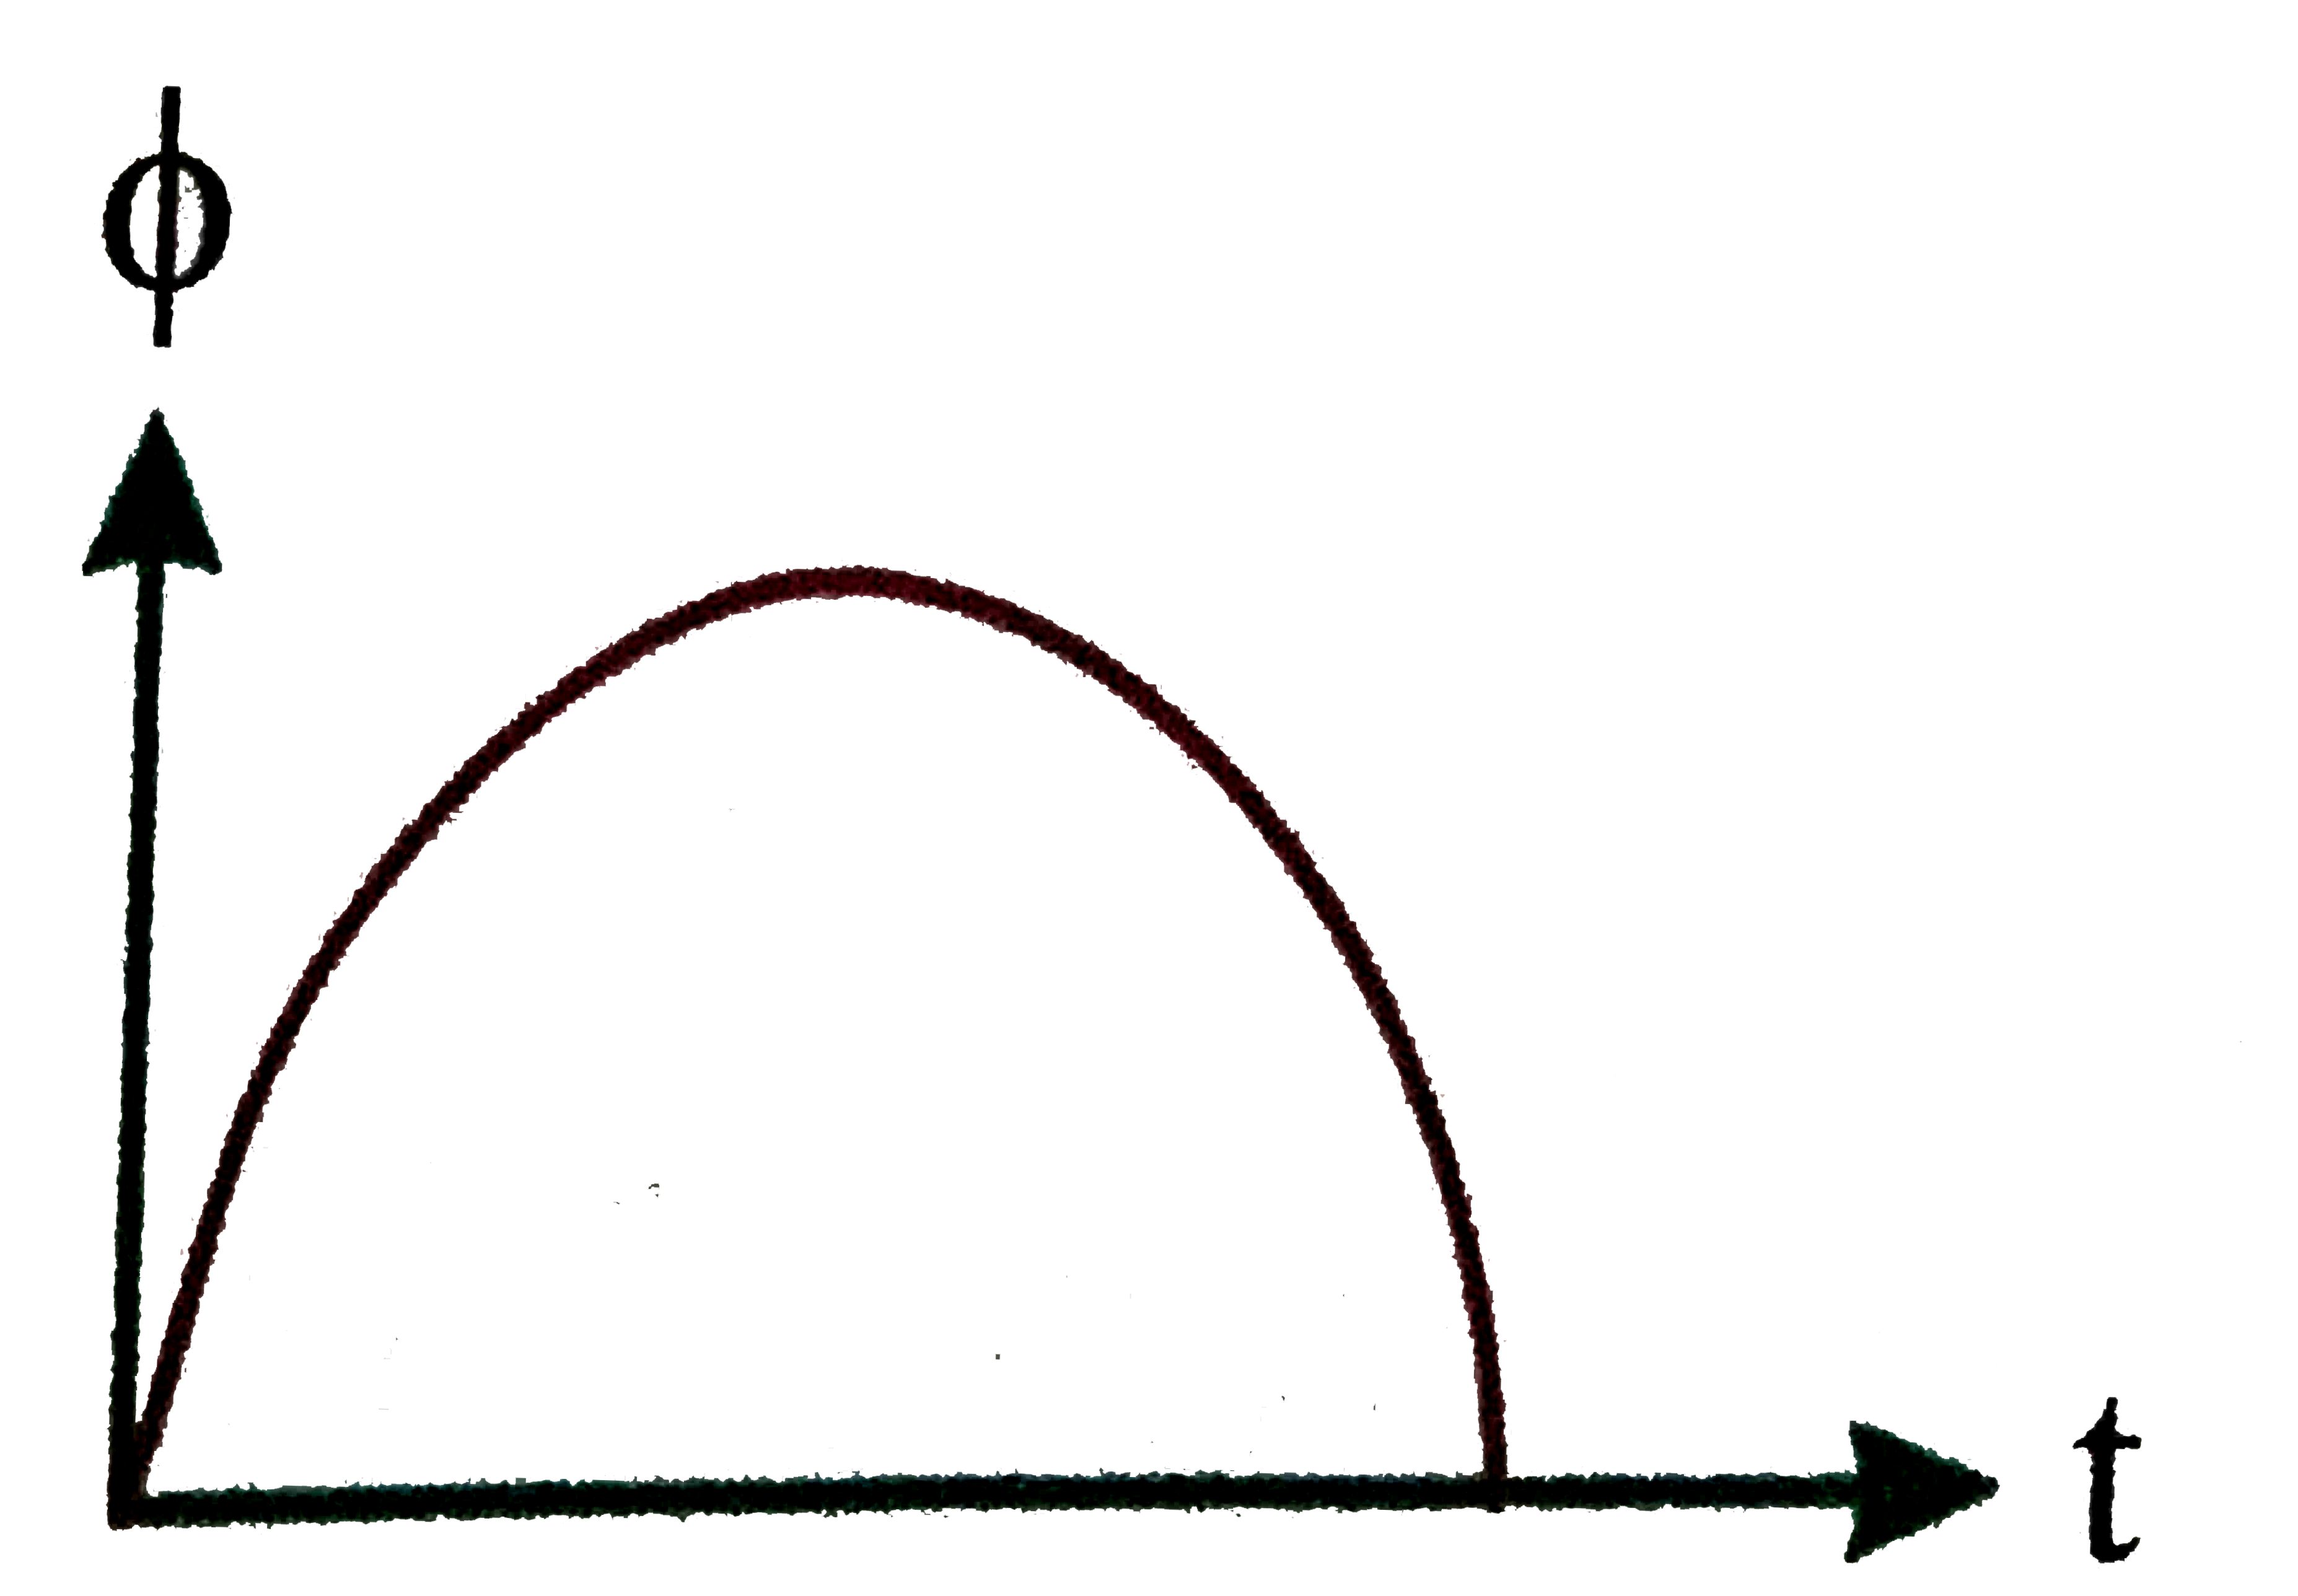
The correct Answer is:C
Flux first increase linearly (:.v is constant remains cosntant (when length L/2 is inside the cube) and then decrease linearly (as rod moves out)
Topper's Solved these Questions
- ELECTROSTATICS AND GAUSS LAWBook:NARAYNAChapter:ELECTROSTATICS AND GAUSS LAWExercise:Passage I
Explore 3 Videos
- ELECTROSTATICS AND GAUSS LAWBook:NARAYNAChapter:ELECTROSTATICS AND GAUSS LAWExercise:Passage II
Explore 3 Videos
- ELECTROSTATICS AND GAUSS LAWBook:NARAYNAChapter:ELECTROSTATICS AND GAUSS LAWExercise:NCERT based Question
Explore 14 Videos
- ELECTROSTATIC POTENTIAL AND CAPACITANCEBook:NARAYNAChapter:ELECTROSTATIC POTENTIAL AND CAPACITANCEExercise:ADDITIONAL PROBLEMS
Explore 14 Videos
- EXPERIMENTAL PHYSICSBook:NARAYNAChapter:EXPERIMENTAL PHYSICSExercise:Comprehension type
Explore 6 Videos
Similar Questions
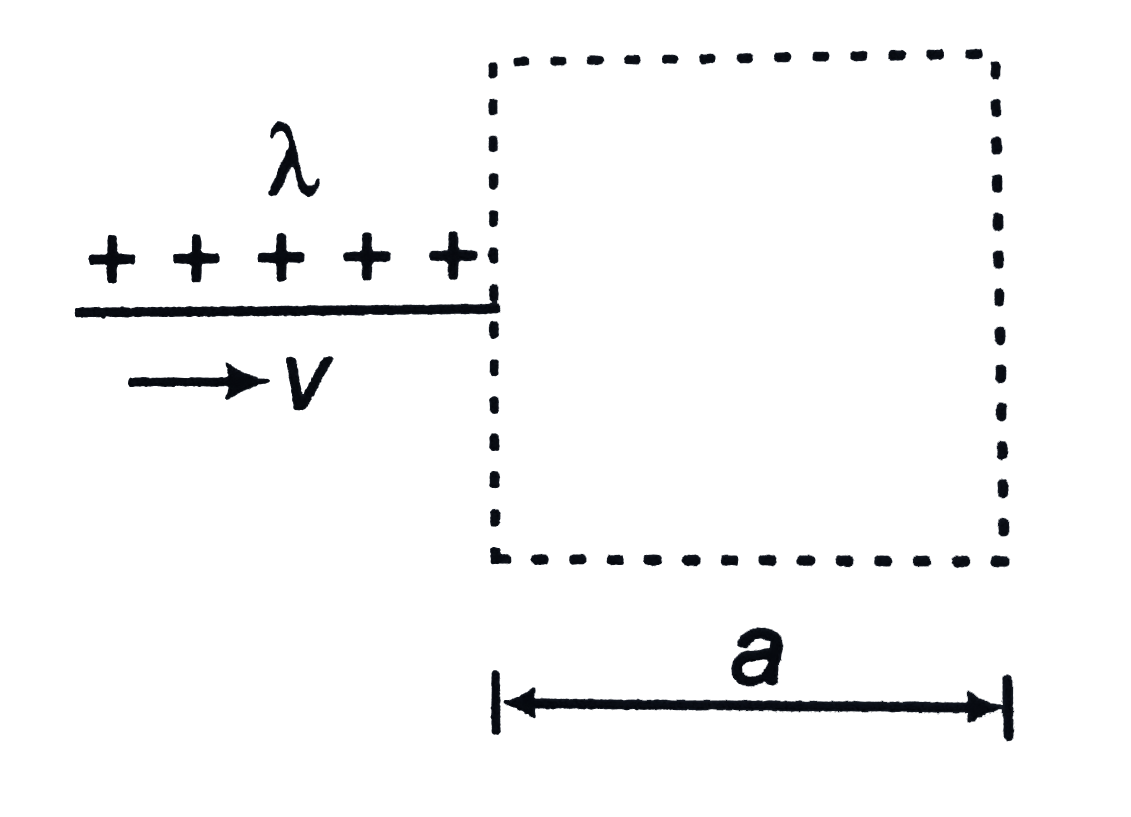
Figure shows an imaginary cube of side a. A uniformly charged rod of length a moves towards right at a constant speed v. At t=0 the right end of the just touches the left face of the cube. Plot a graph between electric flux passing through the cube versus time.
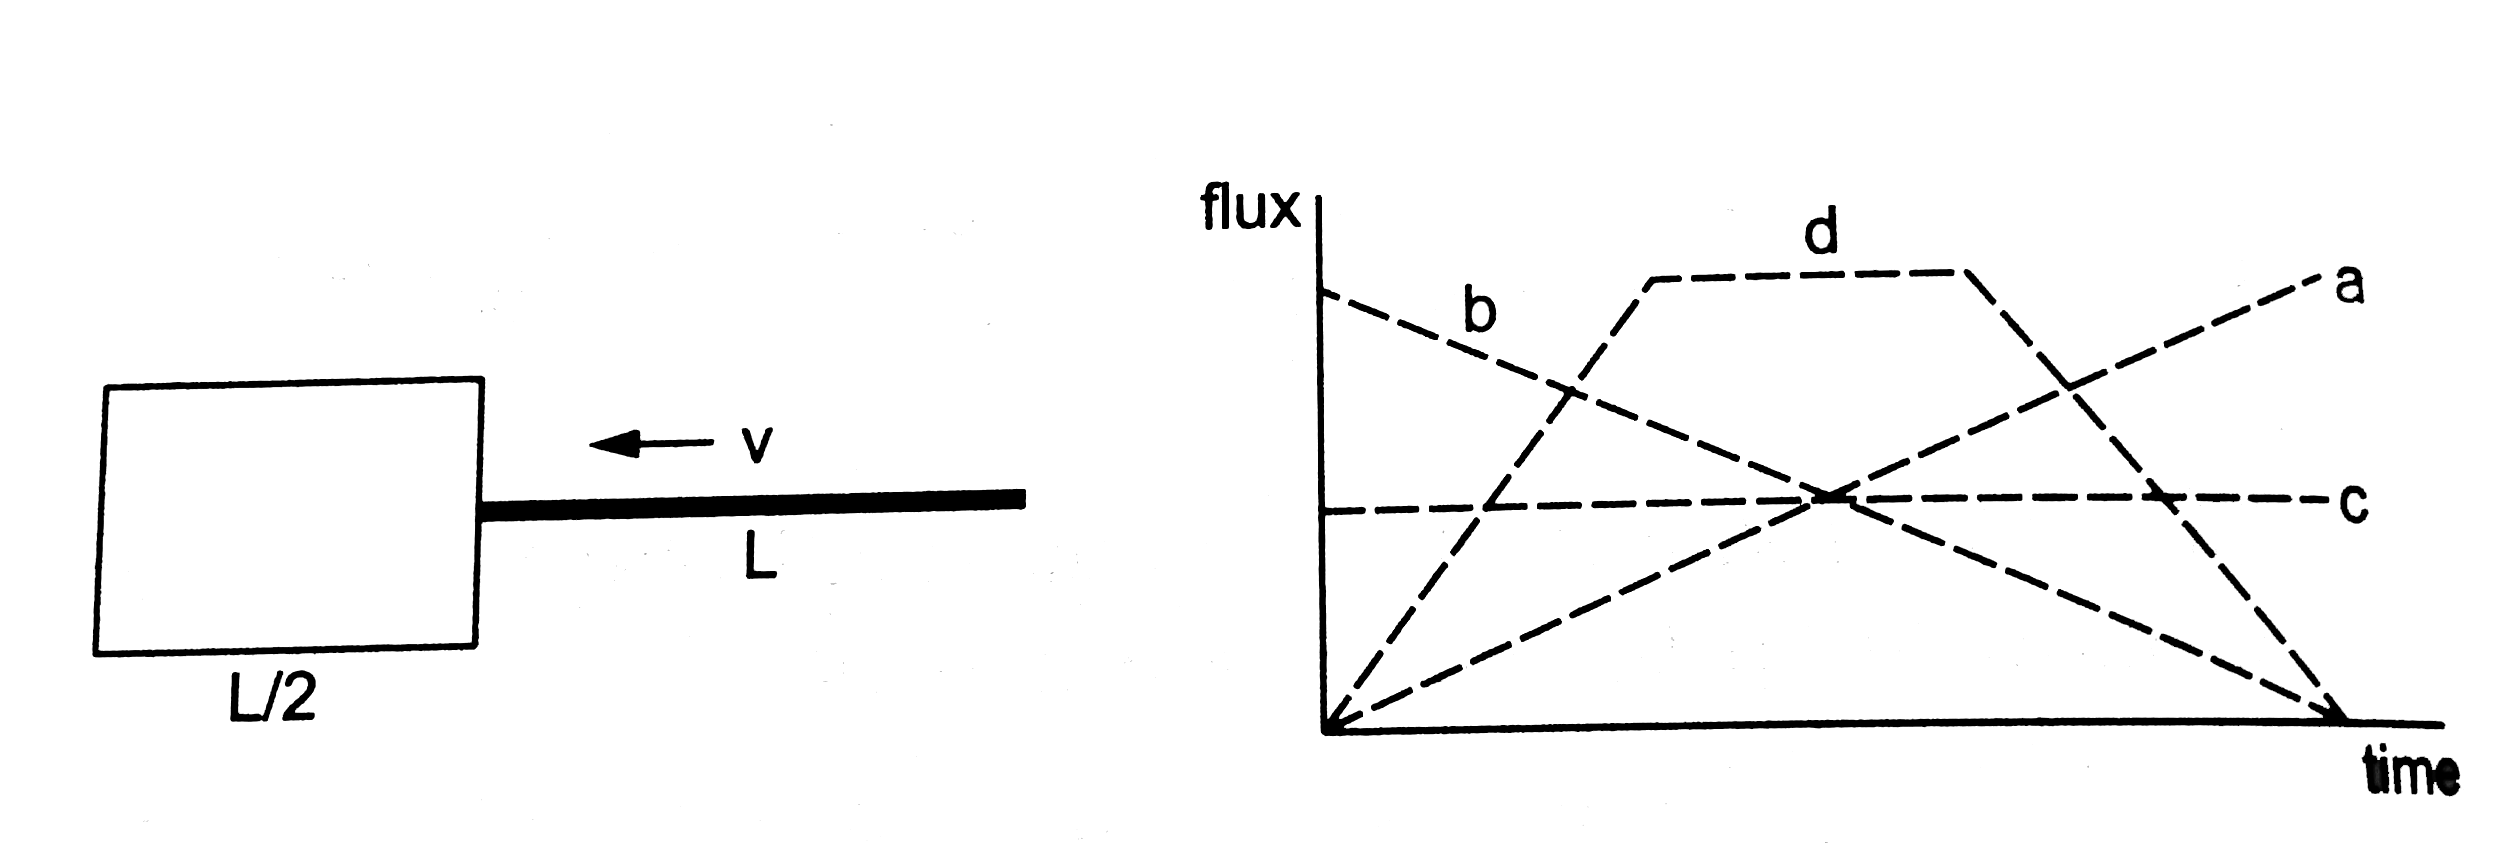
View SolutionFigure shown an imaginary cube of edge L/2. A uniformly Charged rod of length L moves towards left at a small but constant speed v. At t=0, the left end just touches the centre of the cube opposite it. Which of the graphs shown in figure represents the flux of the electic field through the cube as the rod goes through it?
View Solution
Knowledge Check
A uniform rod of length l is rotating with constant angular speed ω as shown in figure. Choose the graph which correctly shows the variation of T with x.
_2019_CBT7_E01_017_Q01.png) A
A_2019_CBT7_E01_017_O01.png) B
B_2019_CBT7_E01_017_O02.png) C
C_2019_CBT7_E01_017_O03.png) D
D_2019_CBT7_E01_017_O04.png)
Find the electric field at point P (as shown in figure) on the perpendicular bisector of a uniformly charged thin wire of length L carrying a charge Q. The distance of the point P from the centre of the rod is a =√32L.
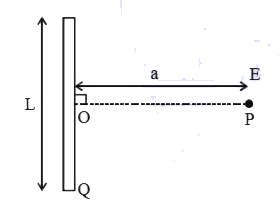 A√3Q4πε0L2BQ3πε0L2CQ2√3πε0L2DQ4πε0L2
A wheel ios rolling without sliding on a horizontal surface. The centre of the wheelk moves with a constant speed v0. Consider a point P on the rim which is at the top at time t=0. The square of speed of point P is plooted against time t. The correct plot is (R is radius of the wheel)
A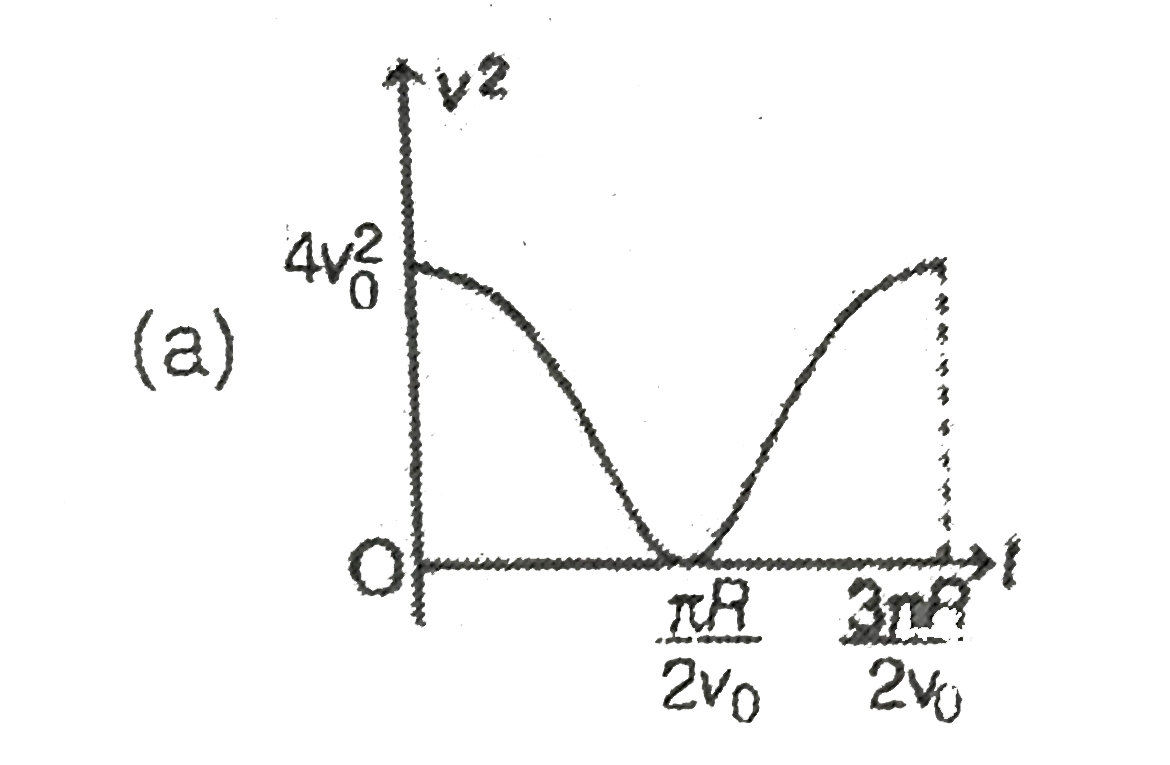 B
B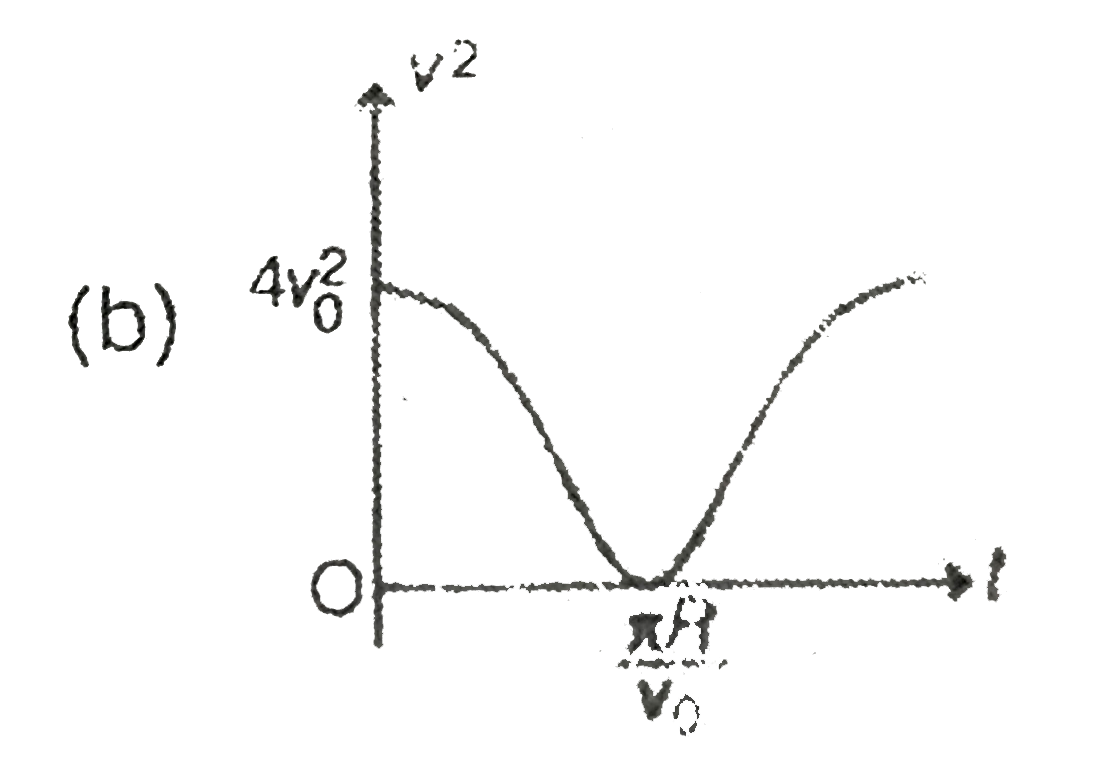 C
C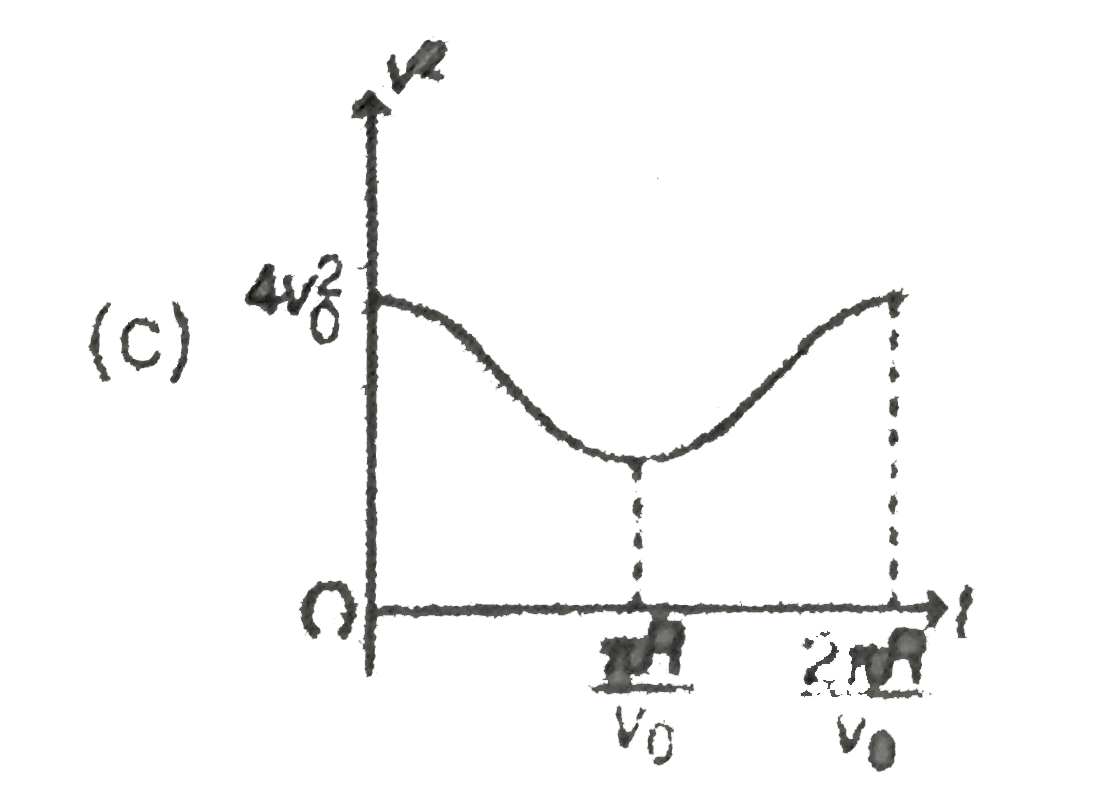 D
D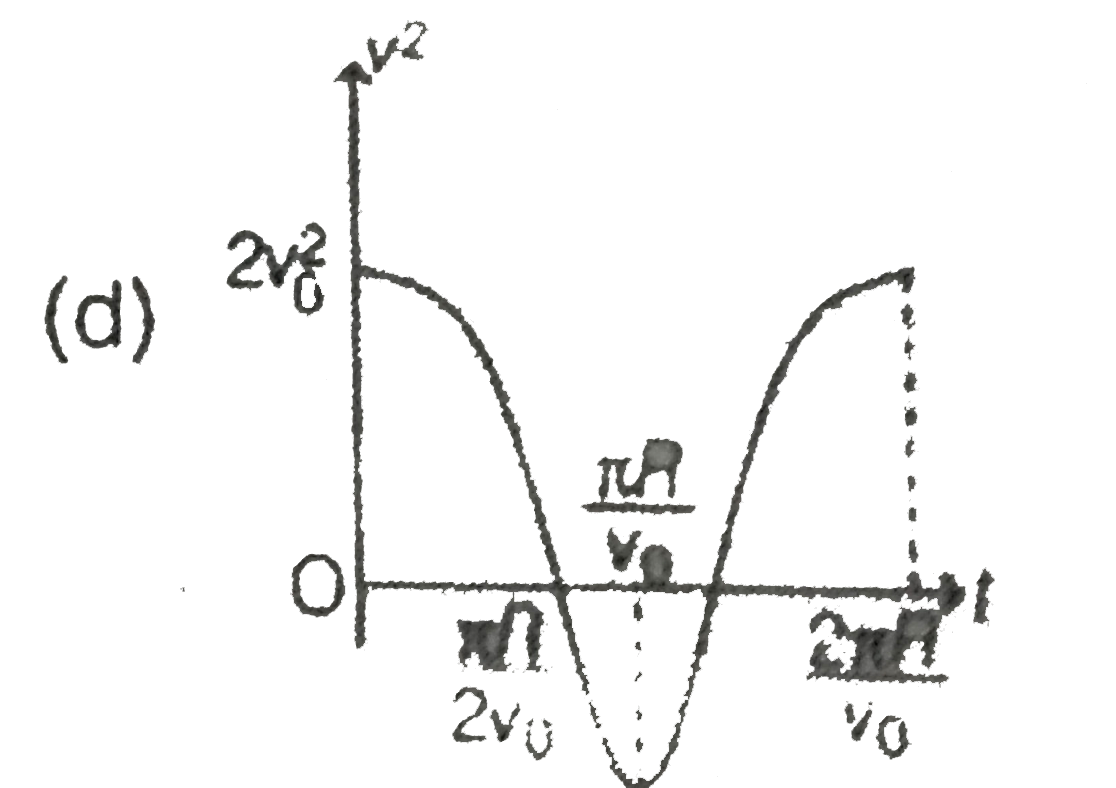
A charge Q is uniformly distributed over a rod of length ι. Condider a hypothetical cube of edge ι with the centre of the cube at one end of the rod. Find the minimum possible flux of the electric field through the entire surface of the cube.
View SolutionAn imaginary cube of edge length is shown in the figure. A uniformly charged rod having linear charge density and length L moves towards left with constant speed v. At time t = 0, the left end just touches the centre of face of the cube. v= constant Choose the correct graph which represents the flux of the electric field through the cube as rod goes through it. flux- time- flux - time
View SolutionA uniform rod of mass m and length l is struck at an end by a force F perpendicular to the rod for a short time interval t. Calculate
the speed of the centre of mass,
View SolutionA charge Q is placed at the corner of a cube of edge length L. The electric flux linked to one of the faces not touching the charge Q is
View SolutionIn an L-R circuit connected to a battery of constant e.m.f. E switch S is closed at time t=0. If e denotes the magnitude of induced e.m.f. across inductor and i the current in the circuite at any time t. Then which of the following graphs shows the variation of e with i?
View Solution

