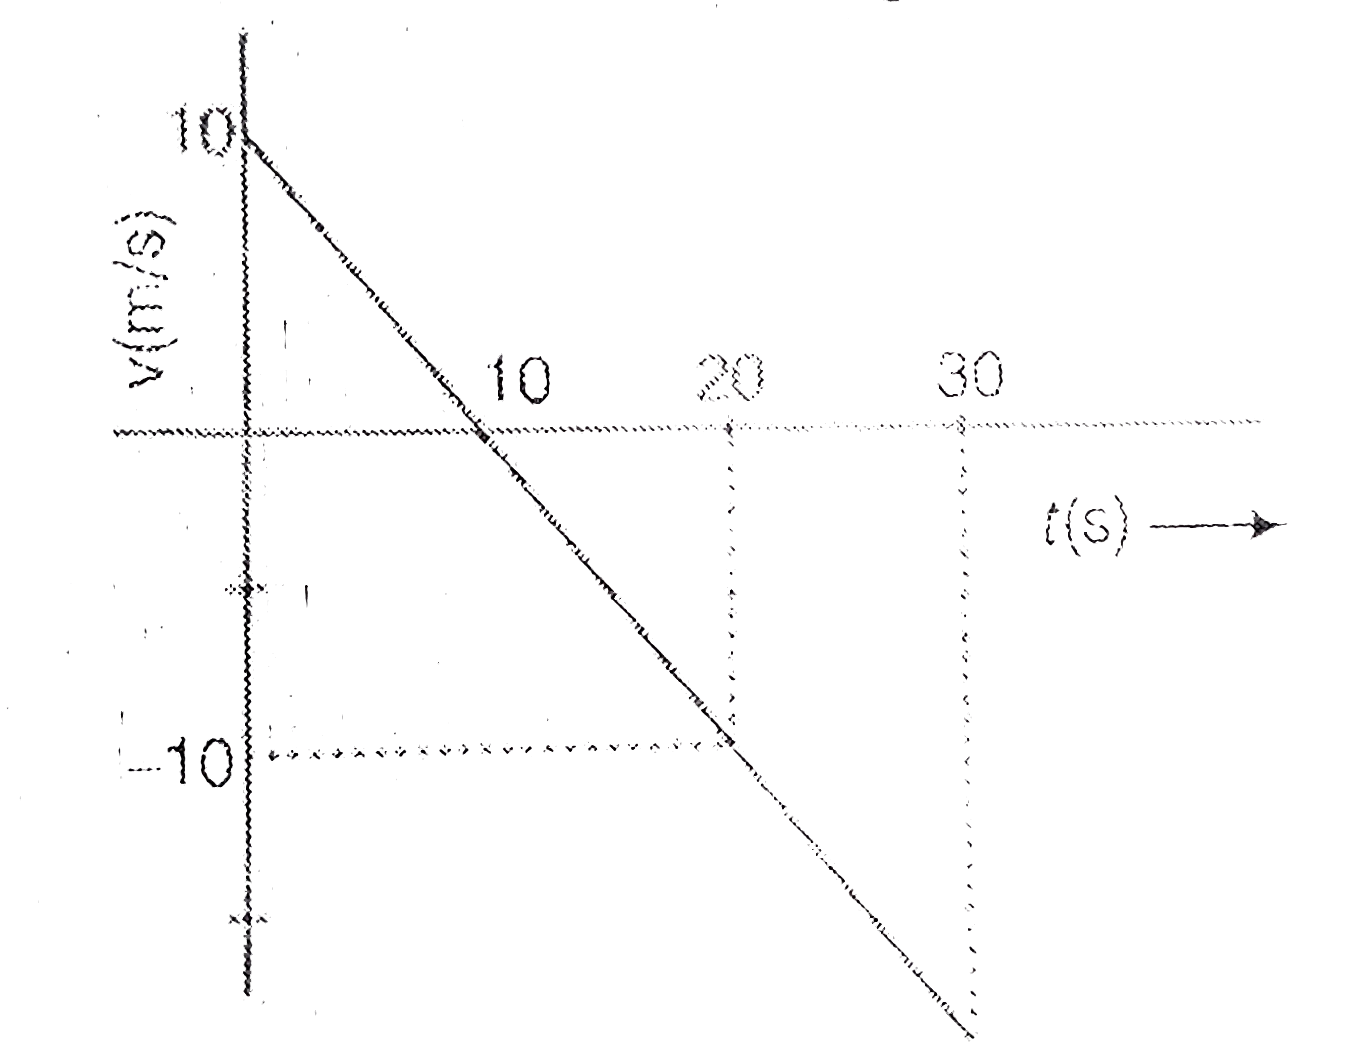
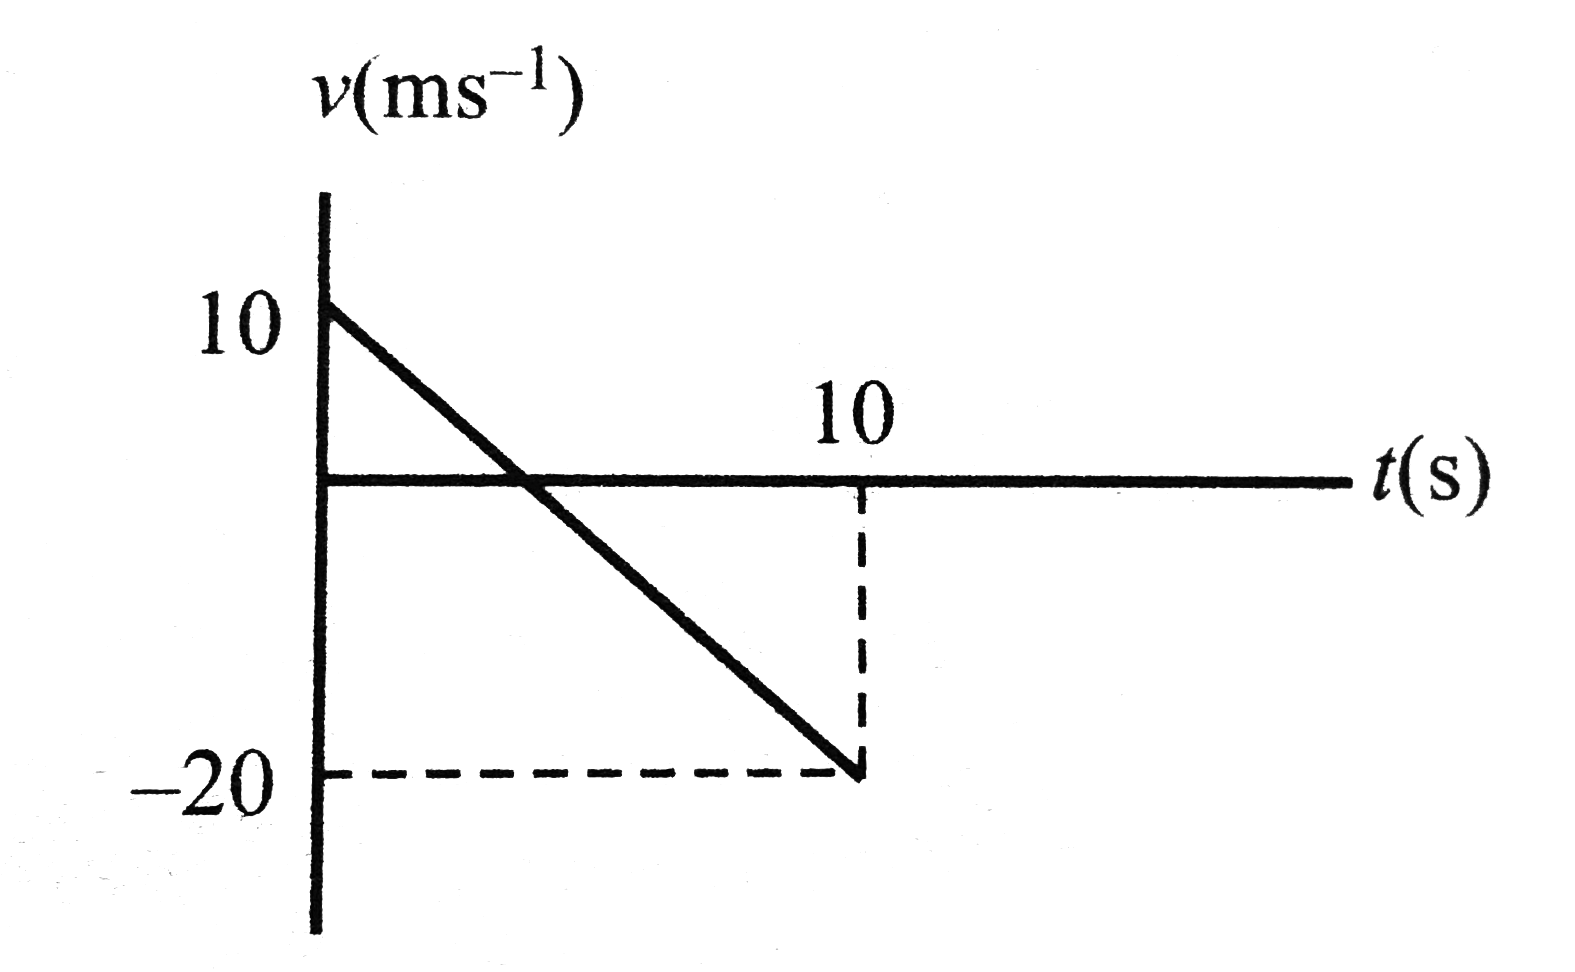
The velocity time plot for a particle moving on straight line is shown in the figure.

The particle has a constant acceleration
The particle has never tuned around
The particle has zero displacement
The average speed in the interval 0 to 10 s is the same as the average speed in the interval 10 s to 20 s.
The correct Answer is:A, D
Since the graph is astraight line, its slope is constant it means acceleration of the pariticle is constant. Velocity of the particle changes from positive to negative at t=10s so particle changes direction at this time. The particle has zero displacement up to 20 s, but not for the entire motion. The average speed in the interval of 0 to 10 s is the same as the average speed in the internal of 10 s to 20 s because distance covered in both time interval is same.
Topper's Solved these Questions
- MOTION IN A STRAIGHT LINEBOOK - NARAYNACHAPTER - MOTION IN A STRAIGHT LINEEXERCISE - Integer Type Question
13 Videos
- MOTION IN A STRAIGHT LINEBOOK - NARAYNACHAPTER - MOTION IN A STRAIGHT LINEEXERCISE - Single Answer Question
8 Videos
- MOTION IN A STRAIGHT LINEBOOK - NARAYNACHAPTER - MOTION IN A STRAIGHT LINEEXERCISE - Passage Type Questions
16 Videos
- MOTION IN A PLANEBOOK - NARAYNACHAPTER - MOTION IN A PLANEEXERCISE - Level-II(H.W)
31 Videos
- NEWTONS LAWS OF MOTIONBOOK - NARAYNACHAPTER - NEWTONS LAWS OF MOTIONEXERCISE - PASSAGE TYPE QUESTION
6 Videos
Similar Questions
Knowledge Check
The velocity- time plot for a particle moving on a straight line is shown in the figure
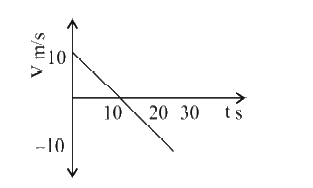 Athe particle has a non uniform accelerationBthe particle has never turned aroundCthe particle has zero displacementDthe average speed in the interval 0 to 10 s is the same as the average speed in the interval 10 s to 20 s
The velocity-time plot for a particle moving on a straight line is shown in figure.
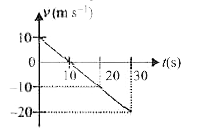 AThe particle has a constant acceleration.BThe particle has never tumed around.CThe particle has zero displacement.DThe average speed in the interval 0 to 10 s is the same as the average speed in the interval 10s to 20 s.
The velocity-time plot for a particle moving on a straight line is shown in figure. Choose correct options .
(##VMC_PHY_XI_WOR_BOK_01_C02_E03_026_Q01.png" width="80%">AThe particle has a constant accelerationBThe particle has never turned aroundCThe particle has zero displacementDThe average speed in the interval 0 to 10 s is same as the average speed in the interval 10 s to 20 s
The velocity-time graph of a particle moving along a straight line is shown in Figure 2.W7.Is the motion uniform?
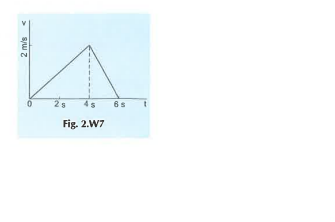
View SolutionThe velocity-time graph of a particle moving along a straight line is shown in Figure 2.W7.
Does the particle change its direction of motion ?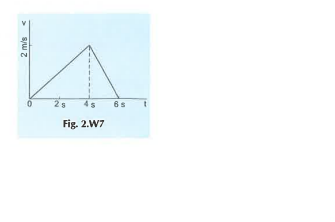
View SolutionThe velocity time graph of a particle moving along a straight line is shown in the figure. In the time interval from t=0 to t=8 second, answer the following three question.
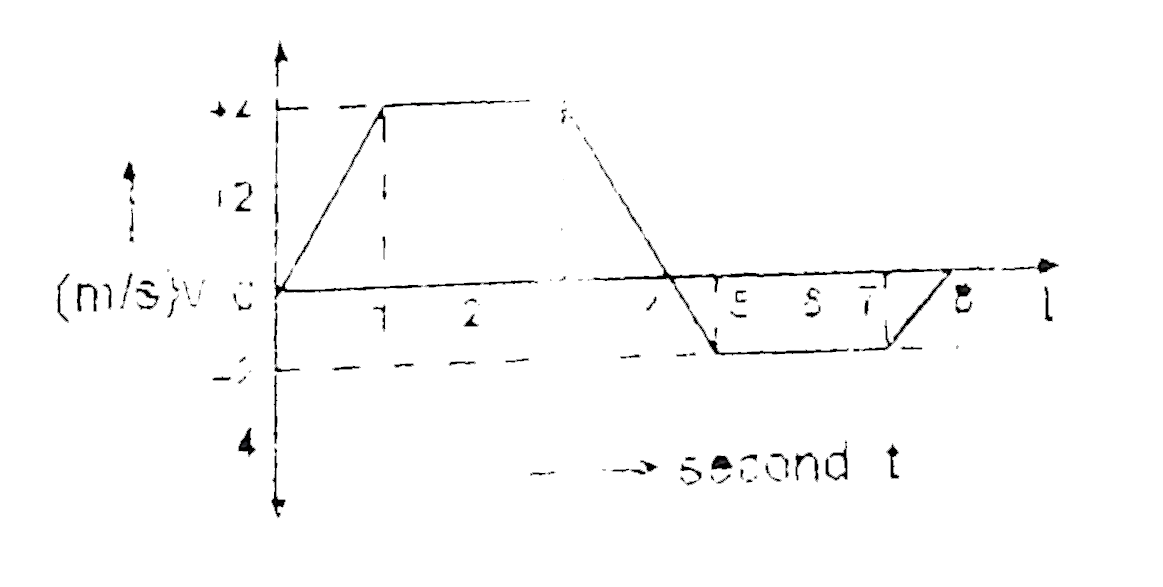
The distance travelled by the particle is :
View SolutionThe velocity - time graph of a particle moving along a straight line is shown in the figure given below
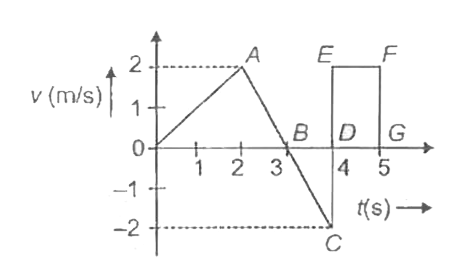
The displacement of the particle in 5 second is
View SolutionThe velocity-time graph of a particle moving in a straight line is shown in figure. The mass of the particle is 2kg. Work done by all the forces acting on the particle in time interval between t=0 to t=10s is
View Solution

