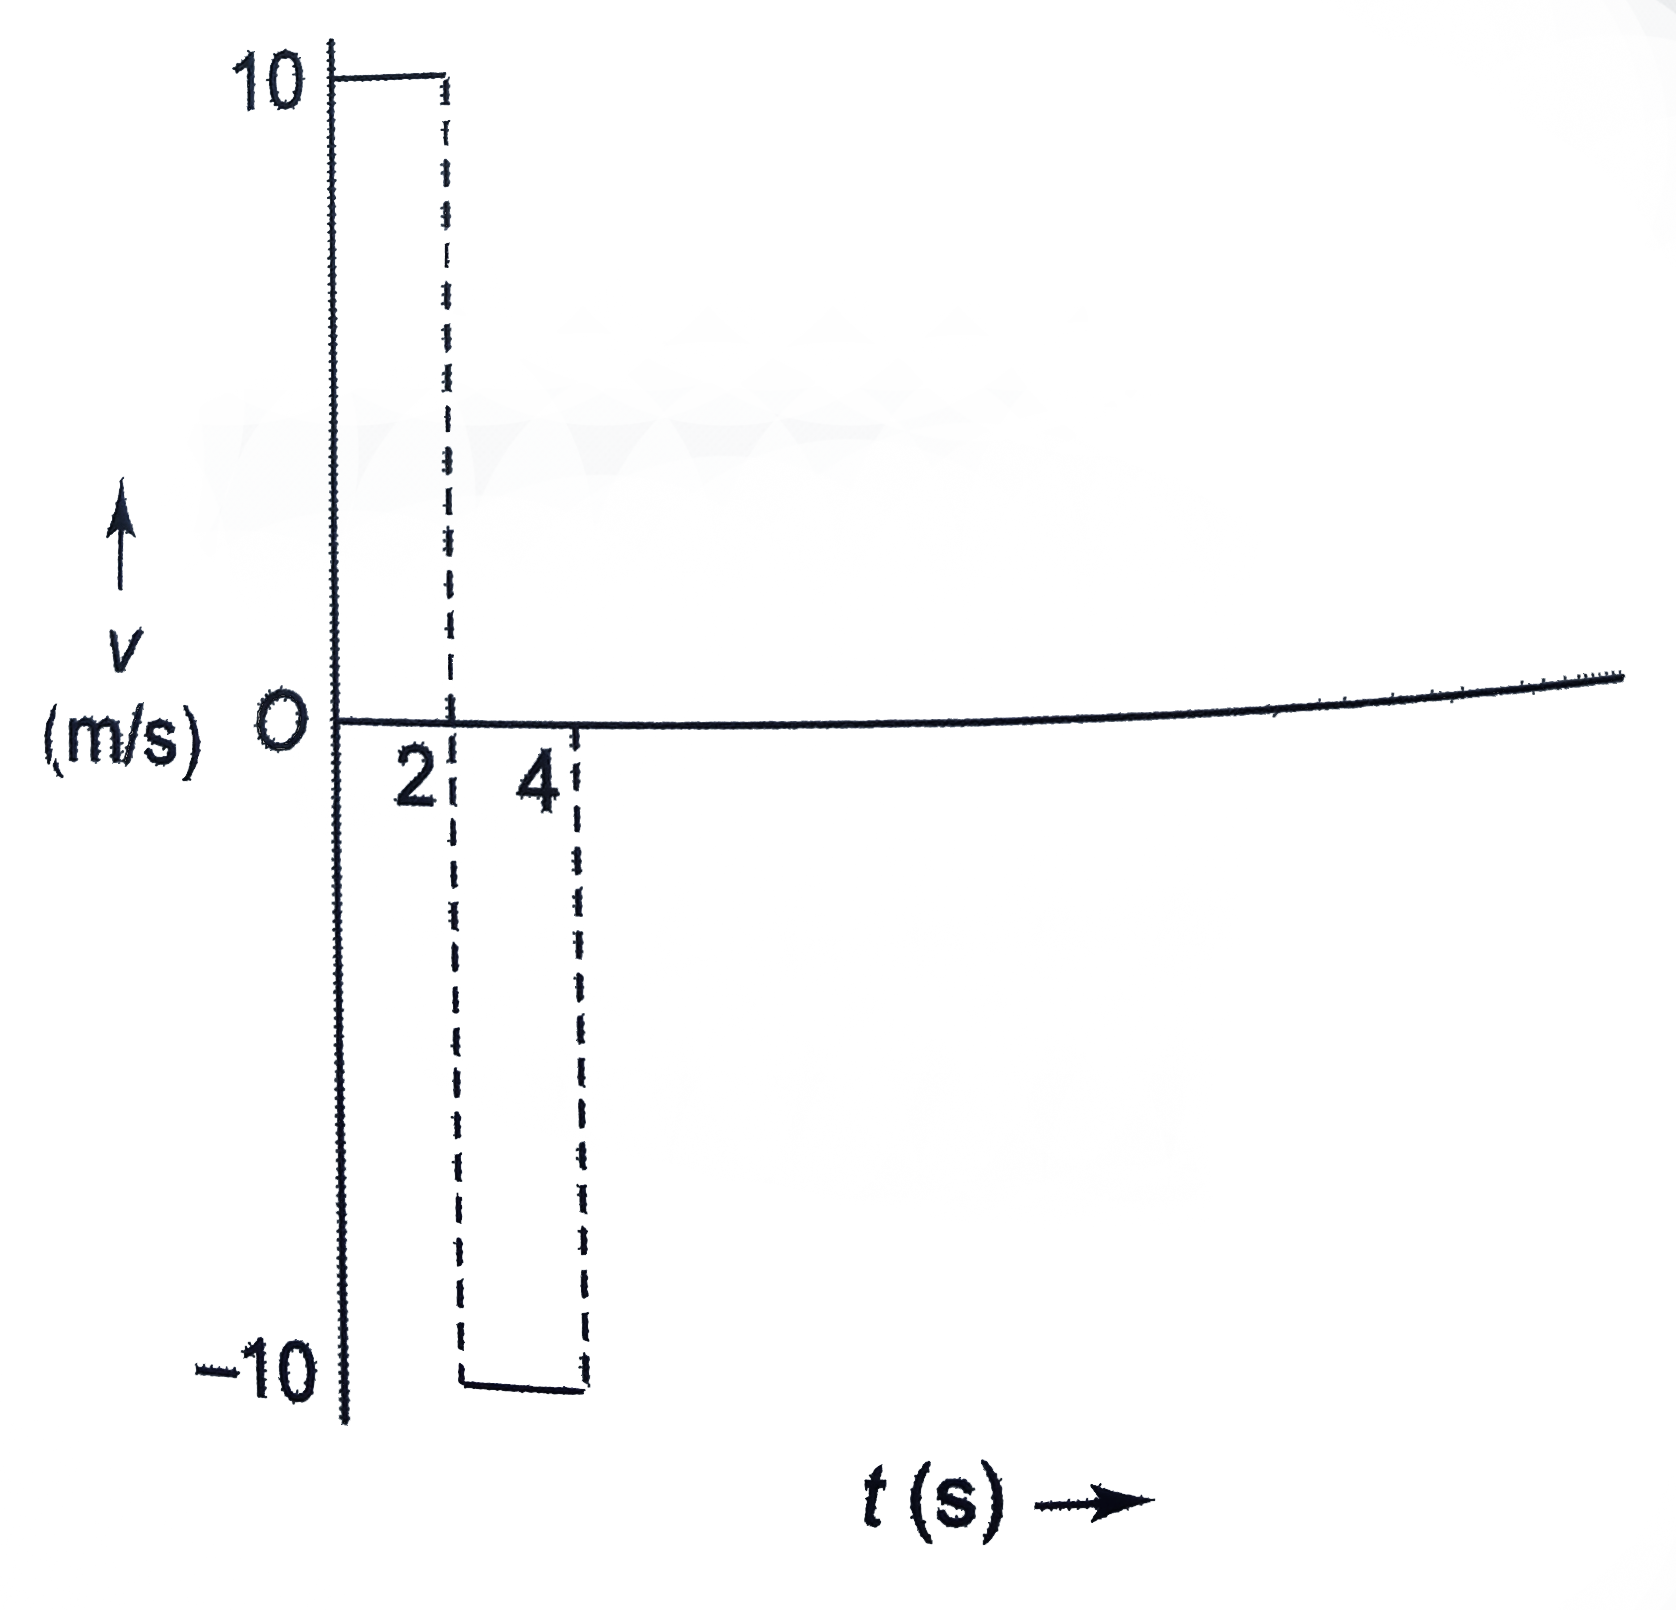
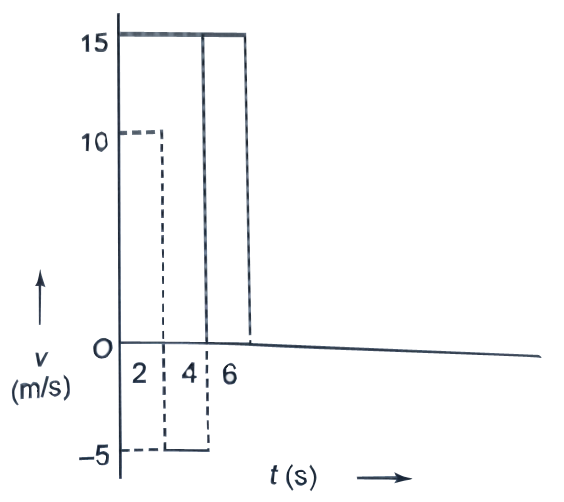
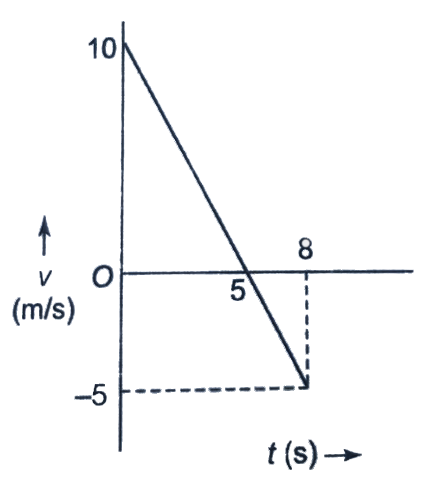
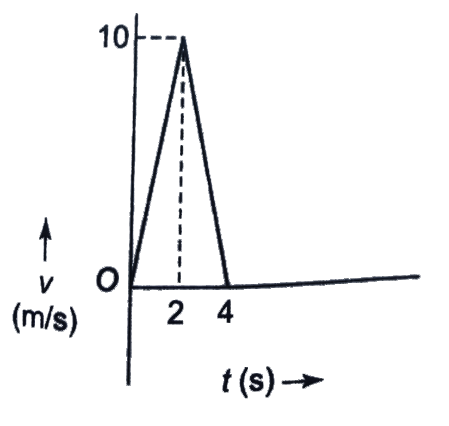
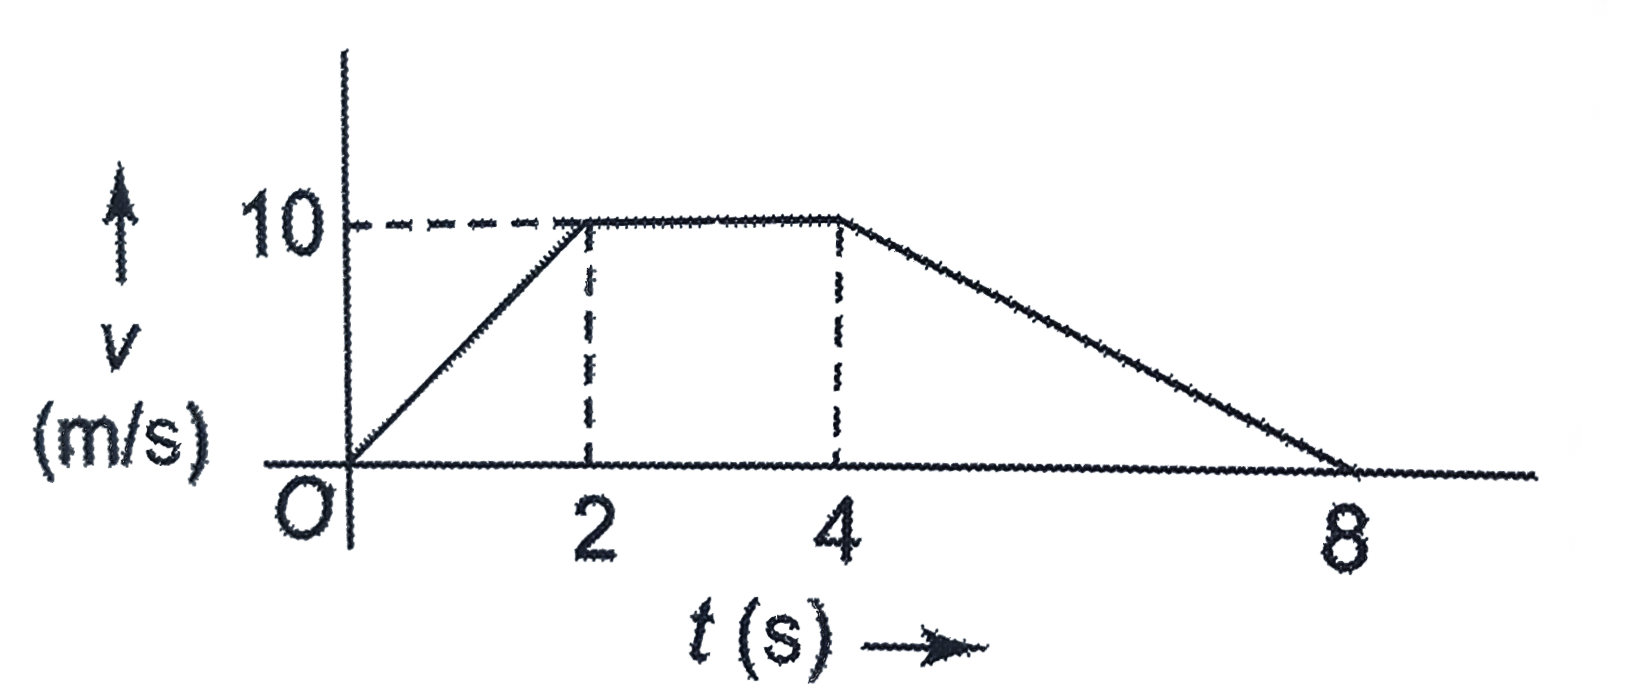
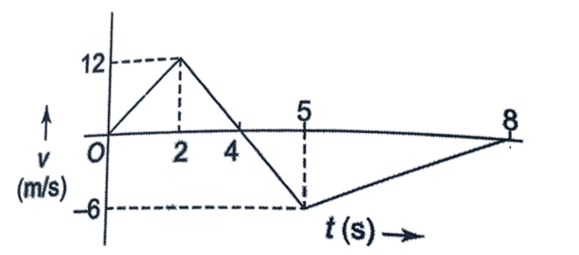
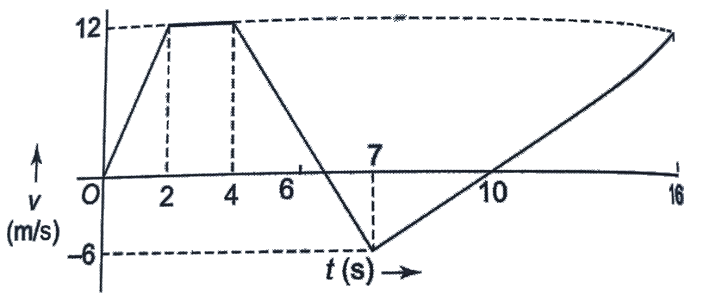
A particle is moving in a straight line along the xaxis. Its velocity-time graph is as shown. Sketch the displacement-time and distance-time grapgs.
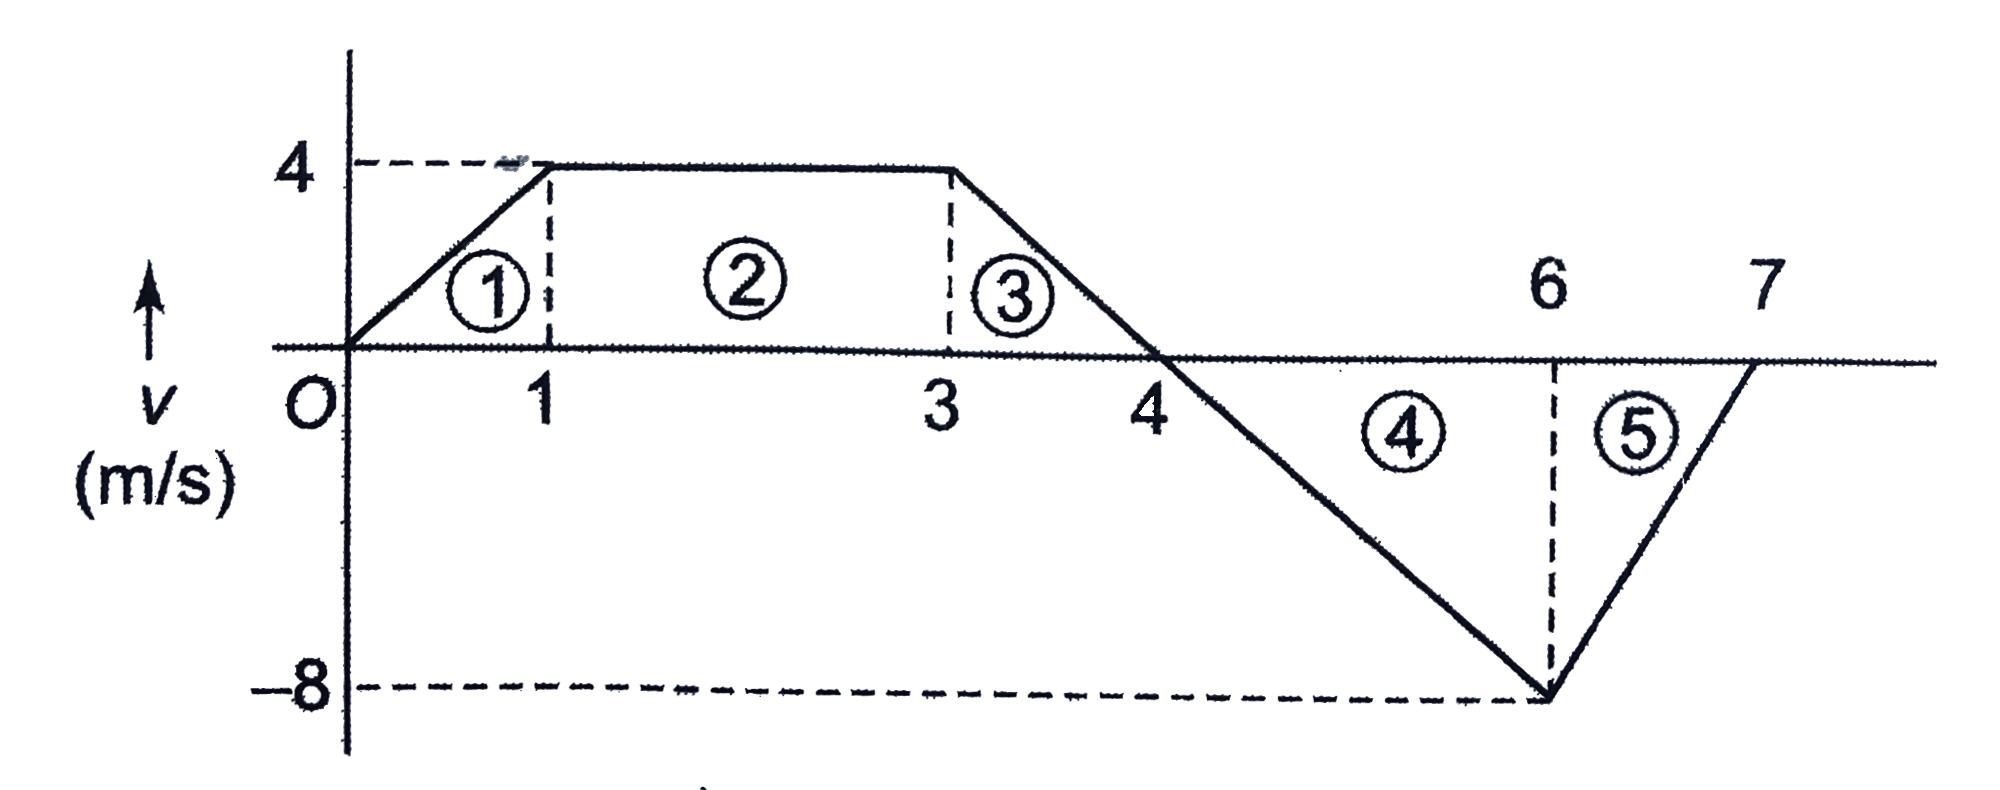
For displacement,
Area(1)=2,Area(2)=8,Area(3)=2,Area(4)=−8,Area(5)=−4
For distance,
Area(4)=8,Area(5)=4
Displacement(m)Distance(m)t=0to1s22t=0to3s1010t=0to4s1212t=0to6s420t=0to7s024
From t=0 to t=1s, a=4m/s2,v>0, slope of the s-t graph is increasing.
From t=1 to t=3s, a=0,v is constant, slope of the s-t graph is constant.
From t=3 to 6s, a=−4m/s2.
From t=3 to 4s,v>0,a<0 the particle is slowing down, slope of the s-t graph is decreasing.
From t=0 to t=4s, the graph for diplacement and distance is the same.
From t=4 to 6s,v<0,a<0, the particle is speeding up.
1. v<0, s is decreasing, slope of the s-t graph is -ve and decreasing.
2. ∣∣∣bsdt∣∣∣>0, Distance is increasing, slope of the distance-time graph is increasing
From t=6 to 7s,a=8m/s2,v<0,a>0, the particle is slowing down.
v<0, s is decreasing, slope of the s-t graph is -ve and increasing.
4. ∣∣∣dsdt∣∣∣>0, distance is increasing, slope of the distance-time is +ve and decreasing.

Topper's Solved these Questions
Similar Questions
Knowledge Check
A particle moves along a horizontal straight line with a velocity-time relationship as shown in the figure-1.129. The total distance moved by the particle is :
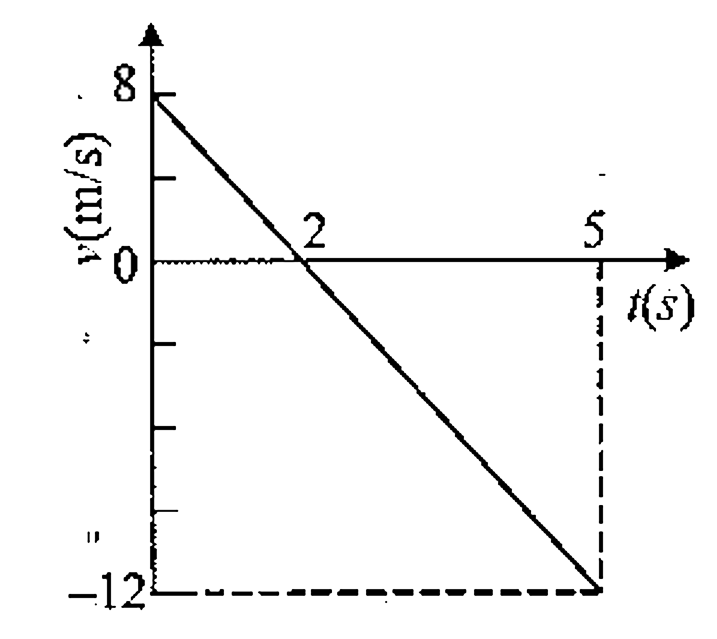 A39 mB13 mC26 mD2.6 m
For a particle moving along x-axis, velocity-time graph is as shown in figure. Find the displacement of the particle?
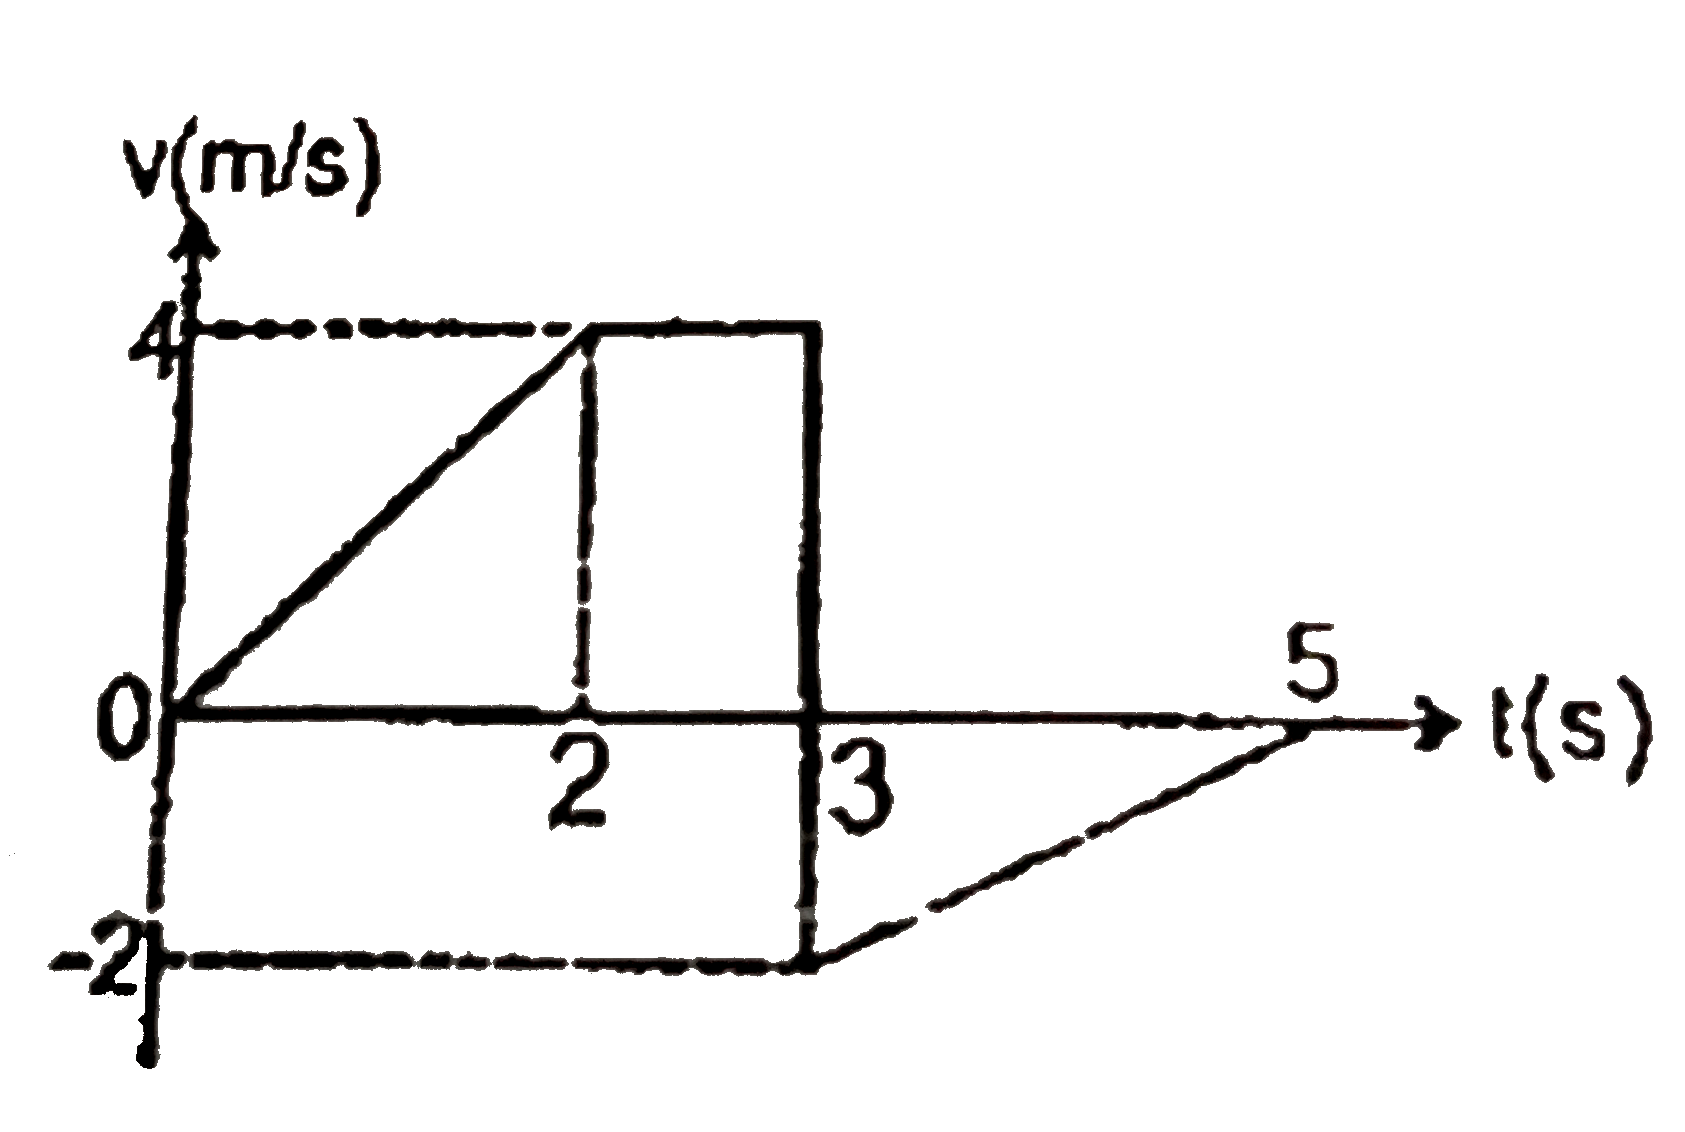
View SolutionFor a particle moving in a straight line, the velocity-time graph is as shown in the figure. Find the acceleration at time t=1s2.5s and 5s. Sketch the acceleration time graph.
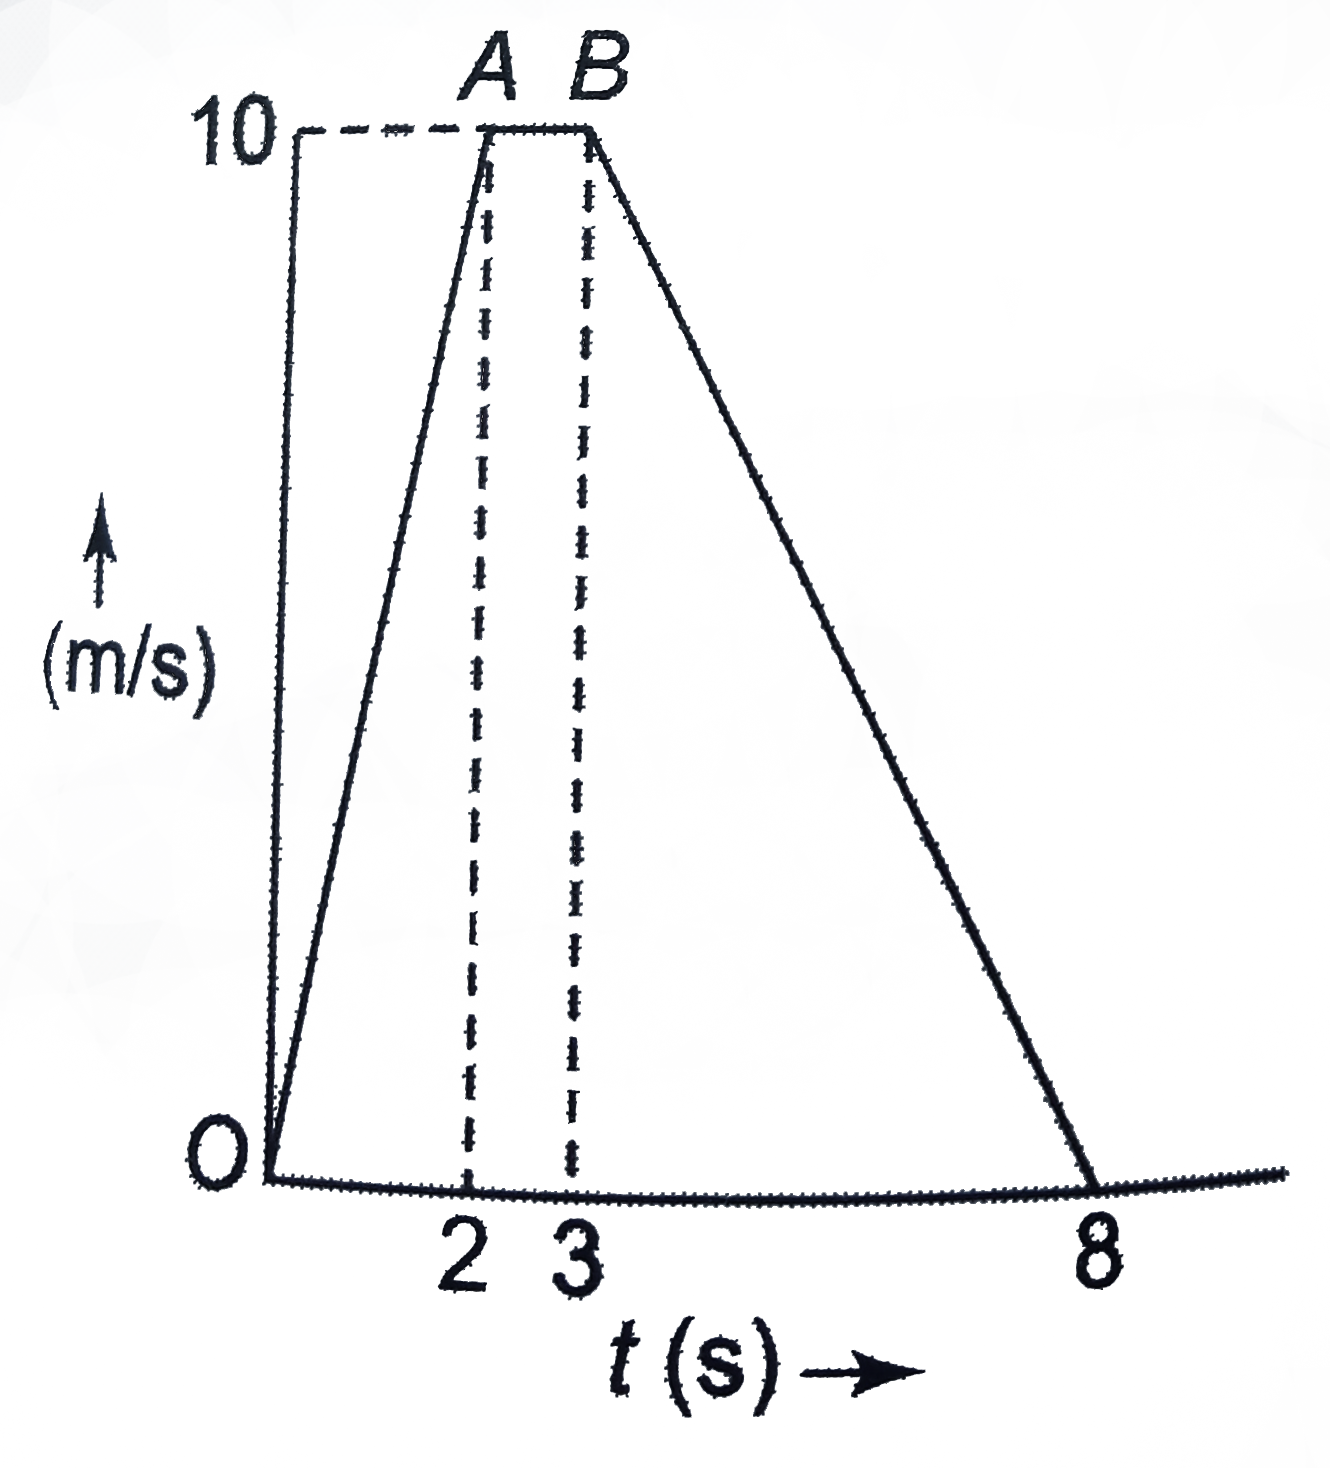
View SolutionFor a particle moving in a straight line, the position-time graph is as shown in the figure. Find the velocity of the particle at time t=1s and t=4s. Also sketch the v-t graph.
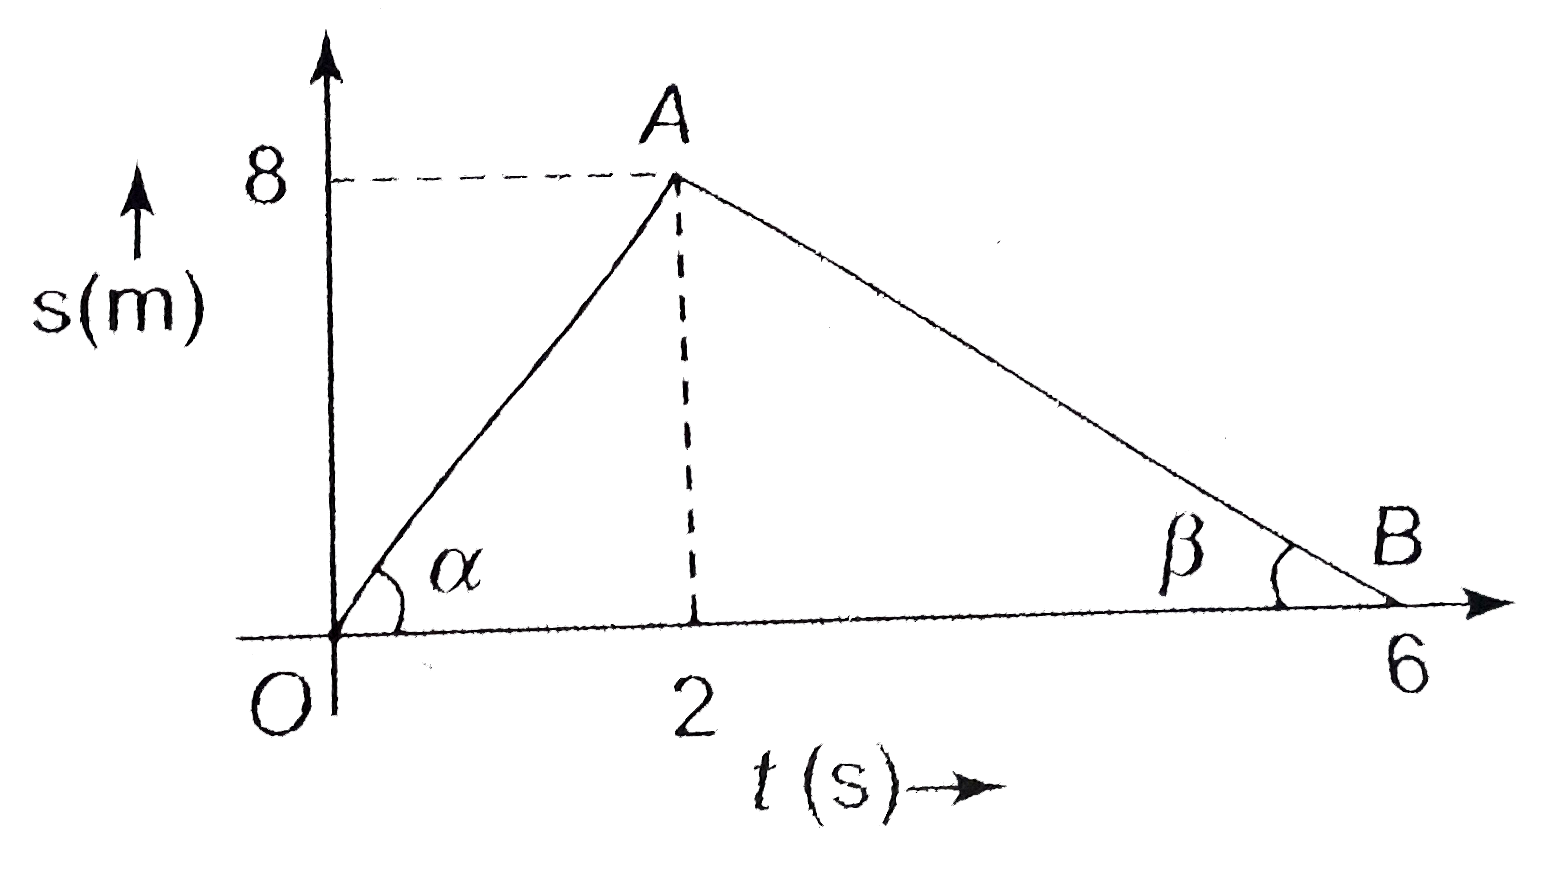
View SolutionThe displacement-time graph for a particle moving in a straight line is as shown in the figure. Determine the velocity of the particle at t=1s,3s and 6s. Sketch the velocity-time graph.
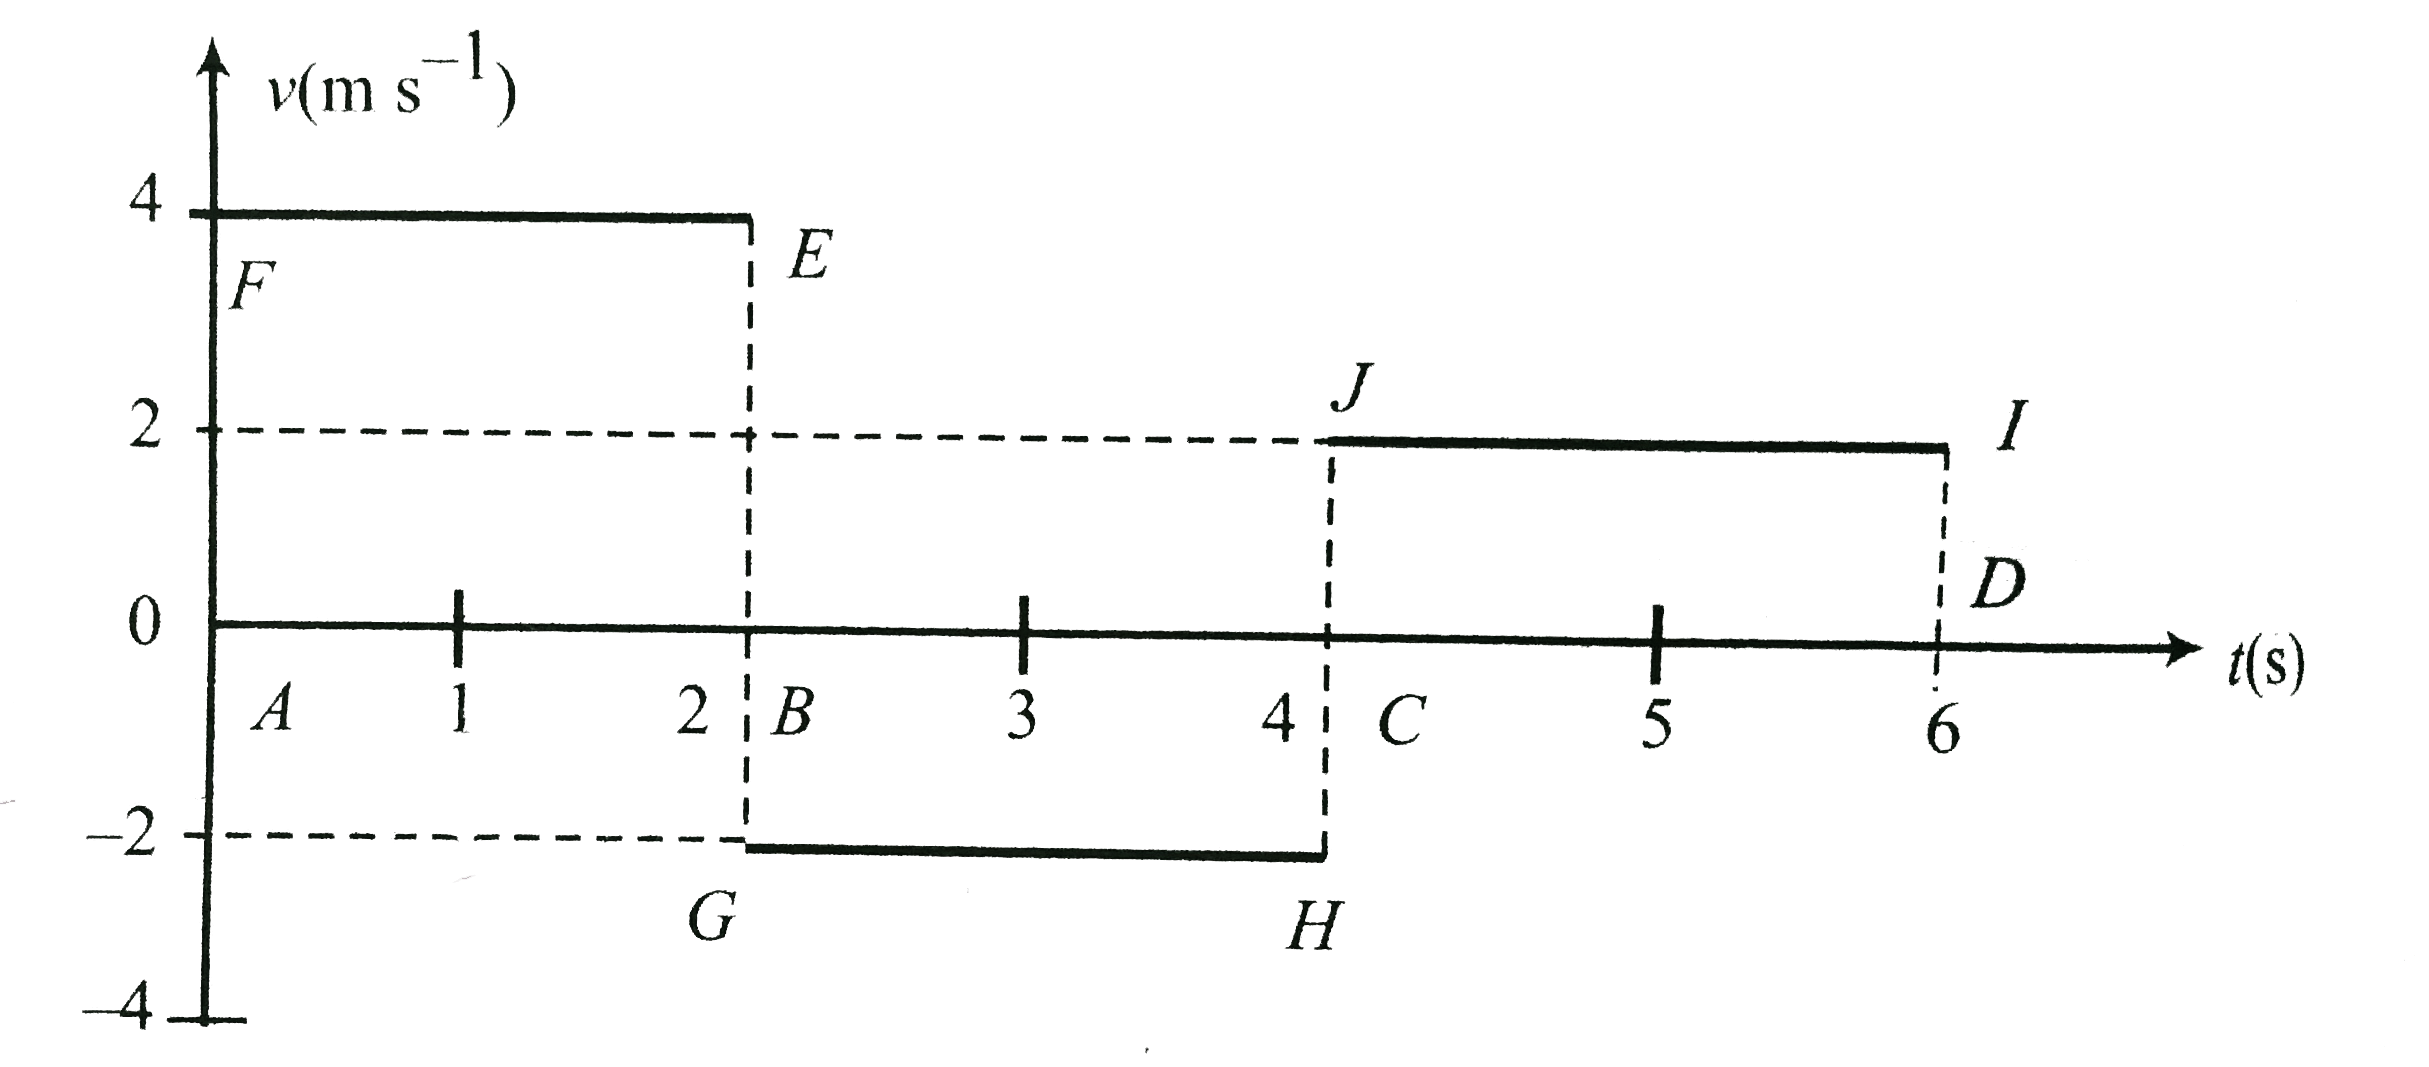
View SolutionThe velocity-time graph of a particle moving in a staight line is shown in the . Find the displacement and the distance trav elled by the particle in 6s.
 .
.
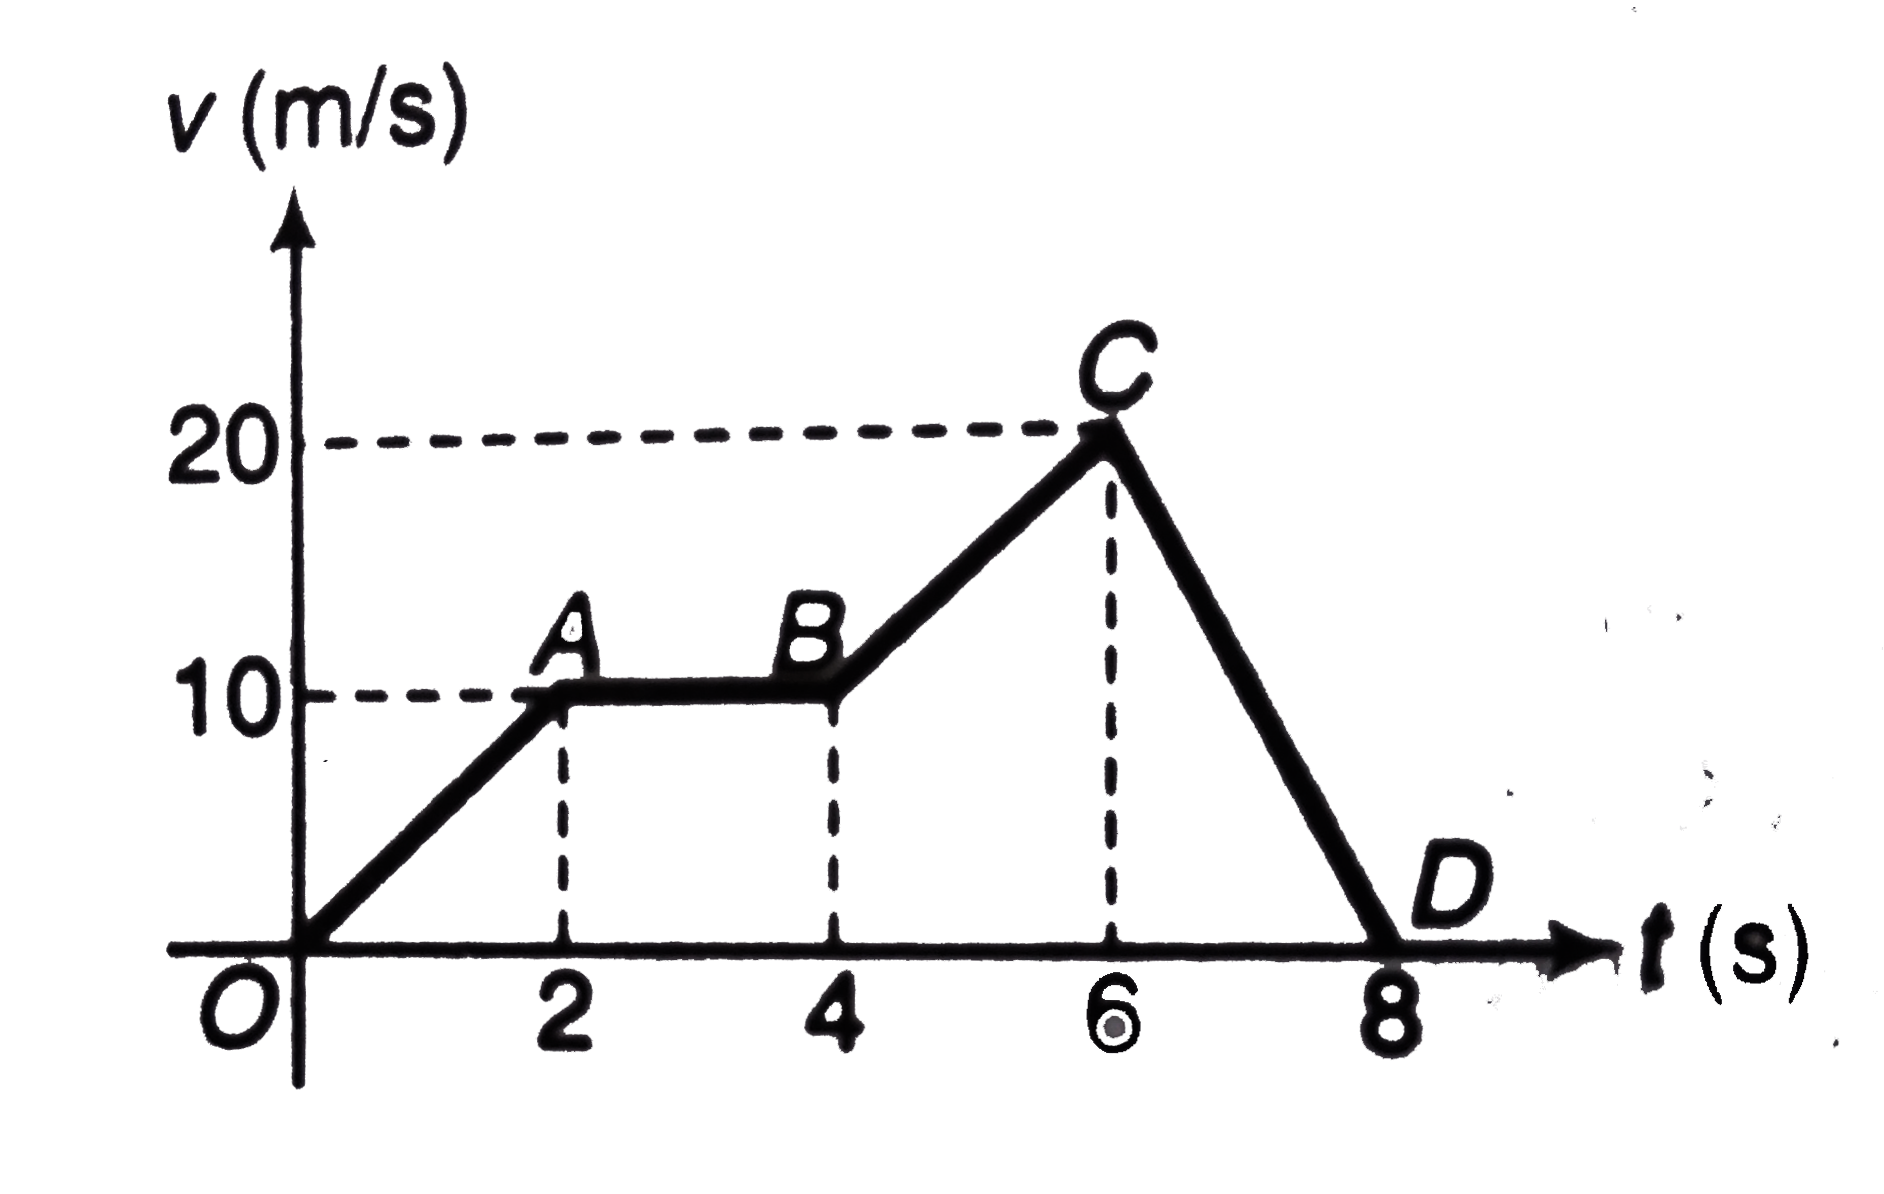
View SolutionVelocity-time graph of a particle moving in a straight line is shown in figure. Plot the corresponding displacement-time graph of the particle if at time t=0, displacement s=0.
View SolutionA car is moving along a straight line. It's displacemetn (x)- time (t) grapg is shown in column II. Match the entries in column I with points on graph.

View Solution

