Within elastic limit, slope of the graph of bulk strain against bulk stress gives the
Poisson's ratio
Compressibility
Extension or compression
Modulus of elasticity
The correct Answer is:B
K=VdPdV
∴C=1B=dVVdP=dVVdP=Bulk strainBulk stress
∴ The graph of bulk strain against bulk stress gives the compressiblity.
Topper's Solved these Questions
- ELASTICITYBOOK - MARVEL PUBLICATIONCHAPTER - ELASTICITYEXERCISE - Test Your Grasp - 5
15 Videos
- CURRENT ELECTRICITYBOOK - MARVEL PUBLICATIONCHAPTER - CURRENT ELECTRICITYEXERCISE - MCQ
151 Videos
- ELECTROMAGNETIC INDUCTION AND ALTERNATING CURRENTS BOOK - MARVEL PUBLICATIONCHAPTER - ELECTROMAGNETIC INDUCTION AND ALTERNATING CURRENTS EXERCISE - TEST YOUR GRASP - 16
30 Videos
Similar Questions
Knowledge Check
Within the elastic limit, the ratio of shear stress and shearing strain is called
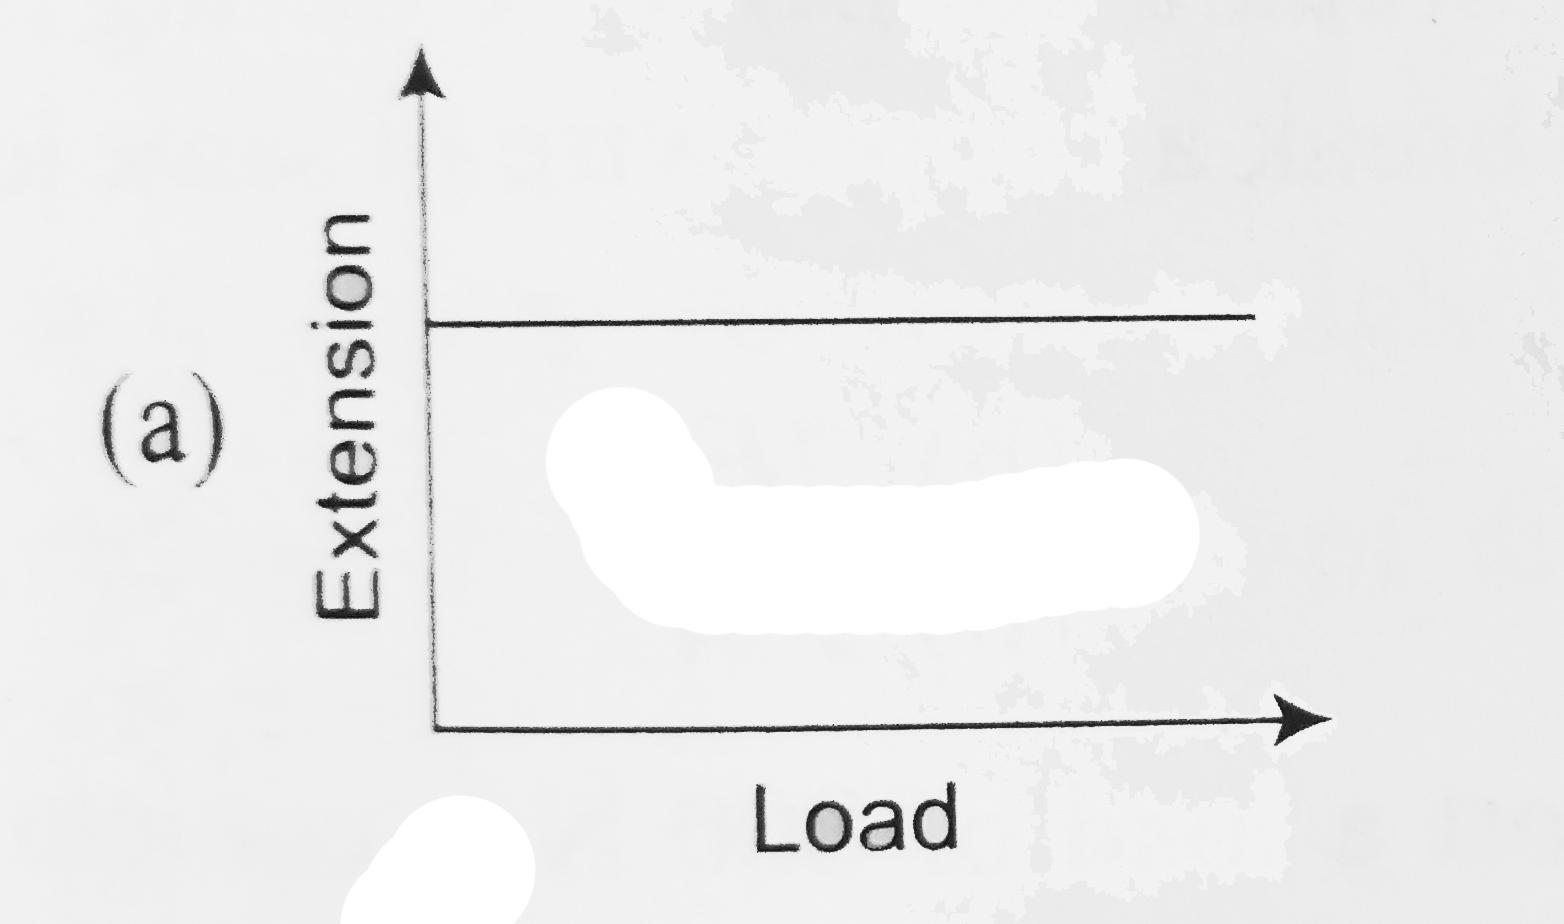
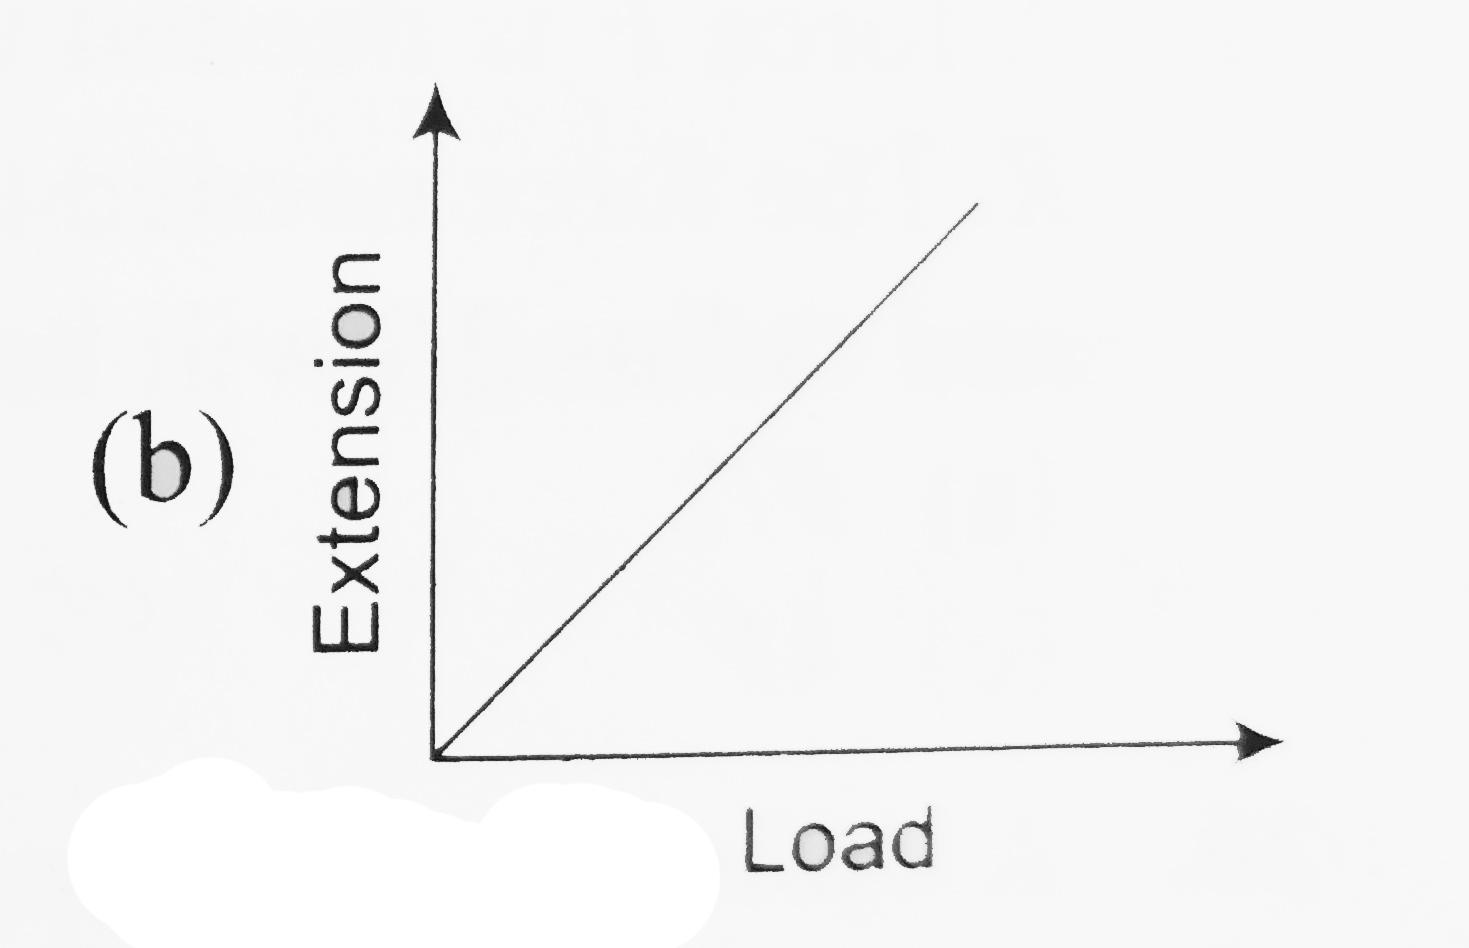
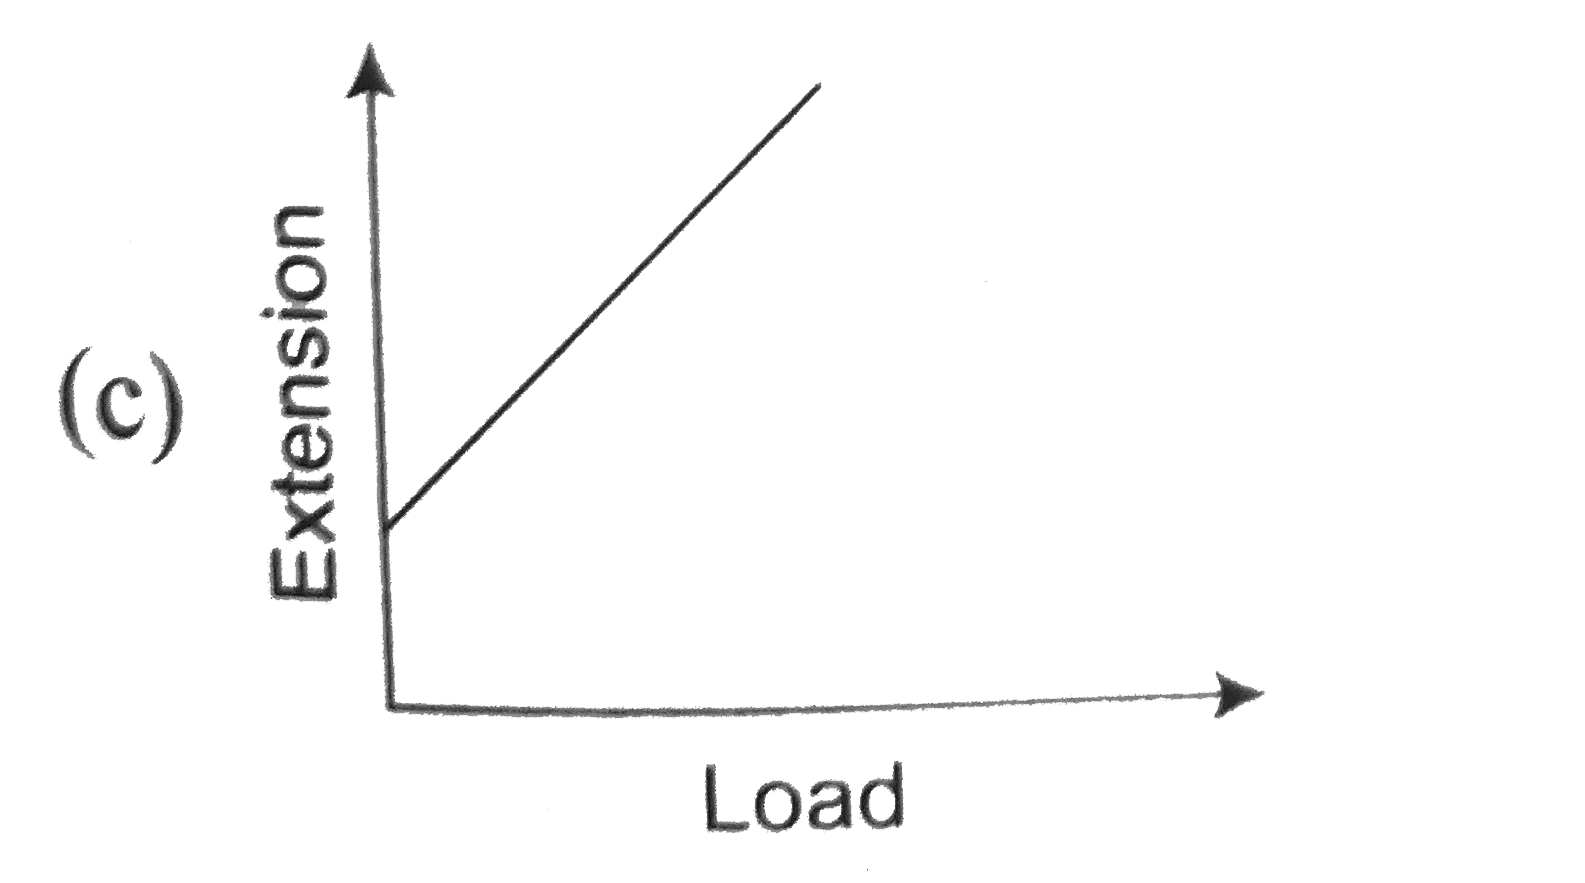
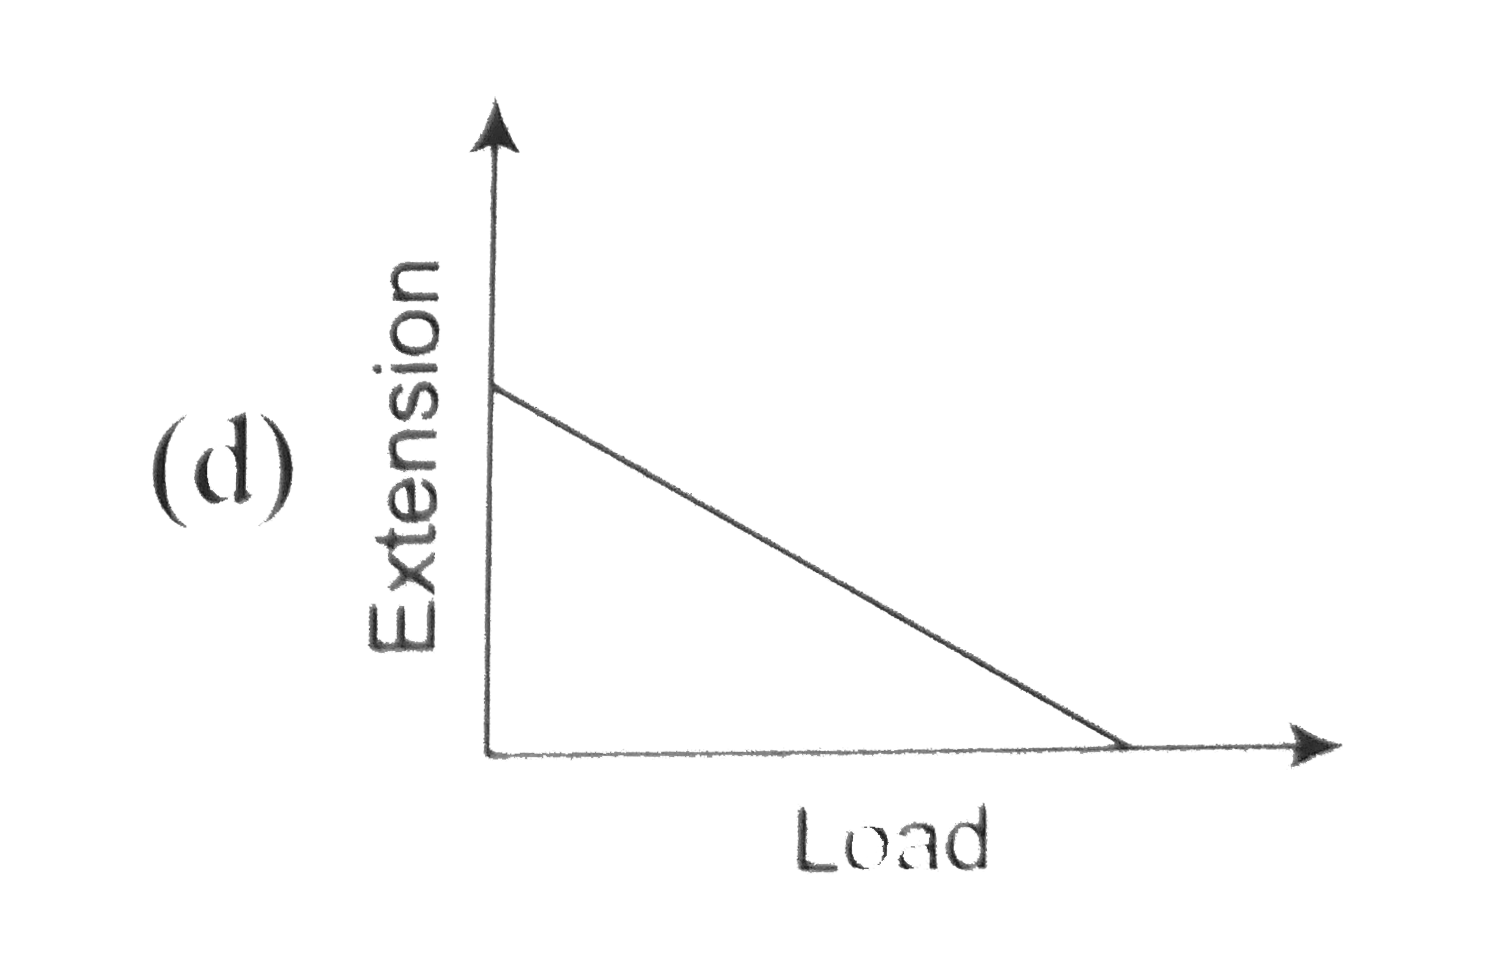
AYBKCηDσWithin elastic limit, which of the following graphs correctly represents the variation of extension in the length of wire with the external load?
A B
B C
C D
D
The graph between stress and strain represents the
AYoung's law in elasticityBBulk law in elasticityCHooke's law in elasticityDlaw of modulus rigidity
The shape of stress vs strain graph within elastic limit is :
View SolutionWithin the elastic limit, stress is directly proportional to strain produced in a body is the statement of
View SolutionA wire of uniform cross-sectional area A and young's modulus Y is stretched within the elastic limits. If s is stress in the wire, the elastic energy density stored in the wire in terms of the given parameters is
View SolutionAccording to Hooke's law, within the elastic limit stress/strain = constant. This constant depends on the type of strain or the type of force acting. Tensile stress might result in compressional or elongative strain, however, a tangential stress can only cause a shearing strain. After crossing the elastic limit, the material undergoes elongation and beyond a stage beaks. All modulus of elasticity are basically constants for the materials under stress.
If stress/strain is x in elastic region and y in the region of yield, then
View SolutionFor a planet, the graph of T2 against r3 is plotted. The slope of the graph is
View Solution
