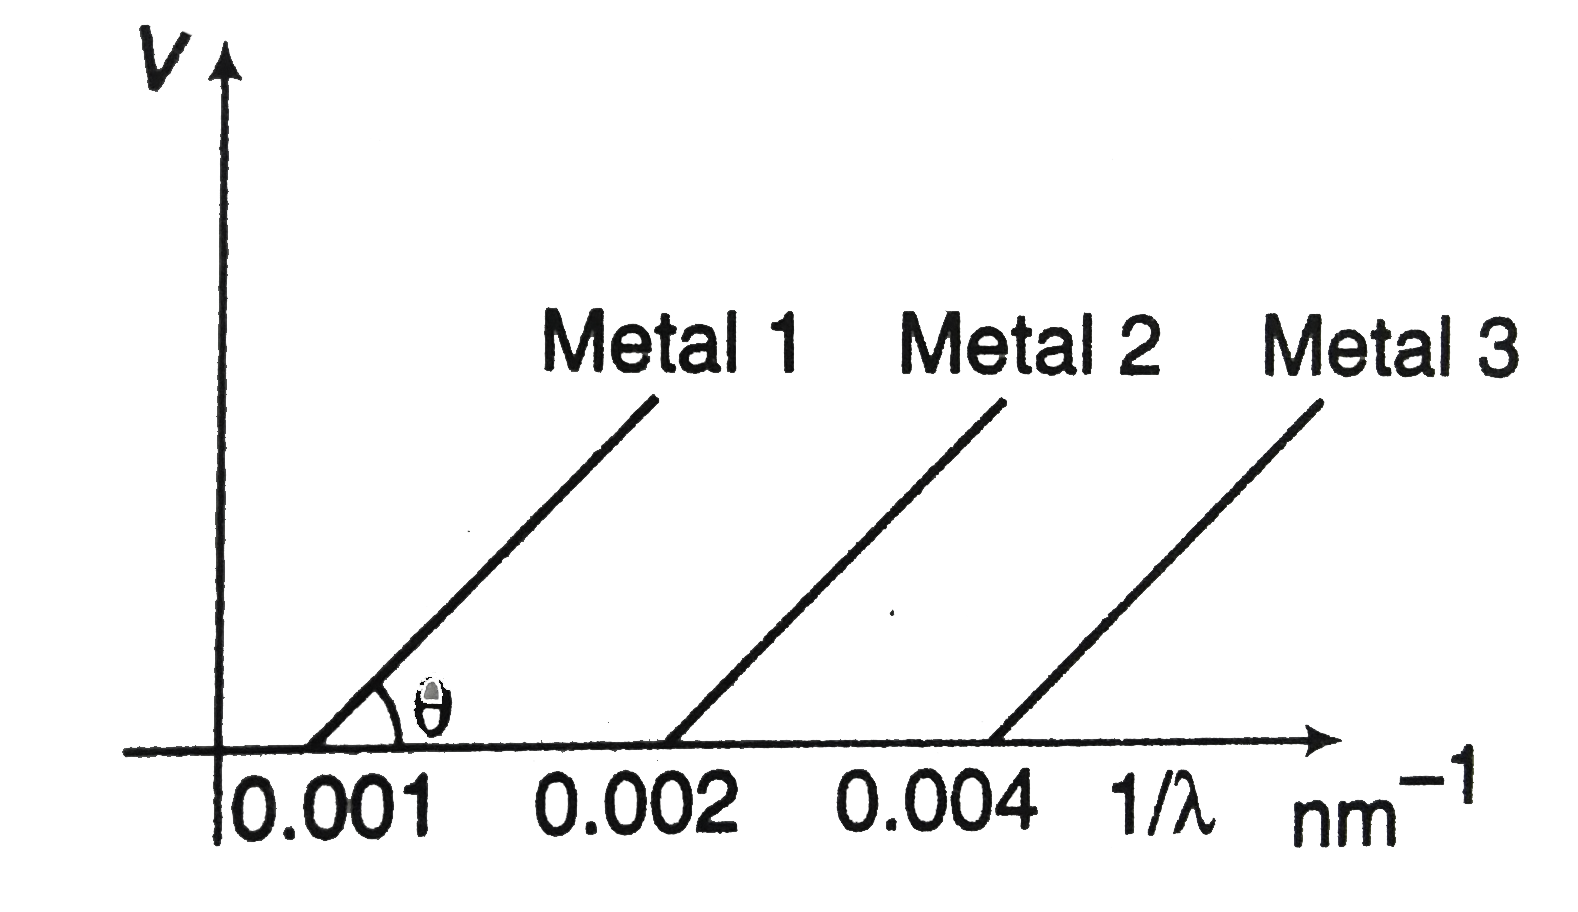
The graph between the stopping potential (V0)and(1λ) is shown in the figure ϕ1,ϕ2andϕ3 are work function , which of the following is /are correct
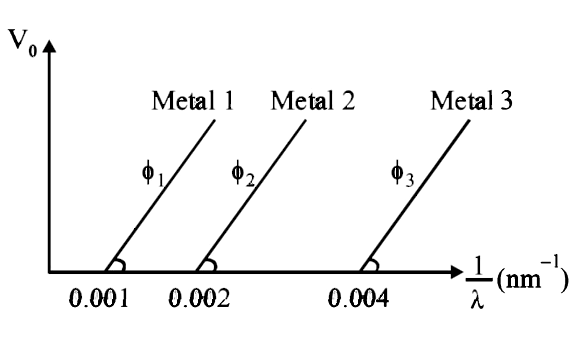
Ration of work functions ϕ1:ϕ2:ϕ3=1:2:4
Ration of work functions ϕ1:ϕ2:ϕ3=4:2:1
tanθ directly proportional to hc/e, where h is Plack's constant and c is the speed of light
The violet colour light can eject photoelectrons from metals 2 and 3.
The correct Answer is:A, C
eV=hcλ−ϕ
⇒Vhceλ−ϕe=(hce)(1λ)−ϕe
Slope=tanθ=hce
ϕ=hcλ⇒ϕ1:ϕ2:ϕ3=1λ1:1λ2:1λ3=1:2:4
Topper's Solved these Questions
- DUAL NATUREBook:NARAYNAChapter:DUAL NATUREExercise:LEVEL-VI
Explore 21 Videos
- DUAL NATUREBook:NARAYNAChapter:DUAL NATUREExercise:LEVEL-I(H.W)
Explore 7 Videos
- DUAL NATUREBook:NARAYNAChapter:DUAL NATUREExercise:NCERT BASED QUES.
Explore 26 Videos
- DUAL NATURE OF RADIATION AND MATTERBook:NARAYNAChapter:DUAL NATURE OF RADIATION AND MATTERExercise:ASSERTION AND REASON
Explore 15 Videos
- ELECTRIC CHARGES AND FIELDSBook:NARAYNAChapter:ELECTRIC CHARGES AND FIELDSExercise:EXERCISE -4
Explore 43 Videos
Similar Questions
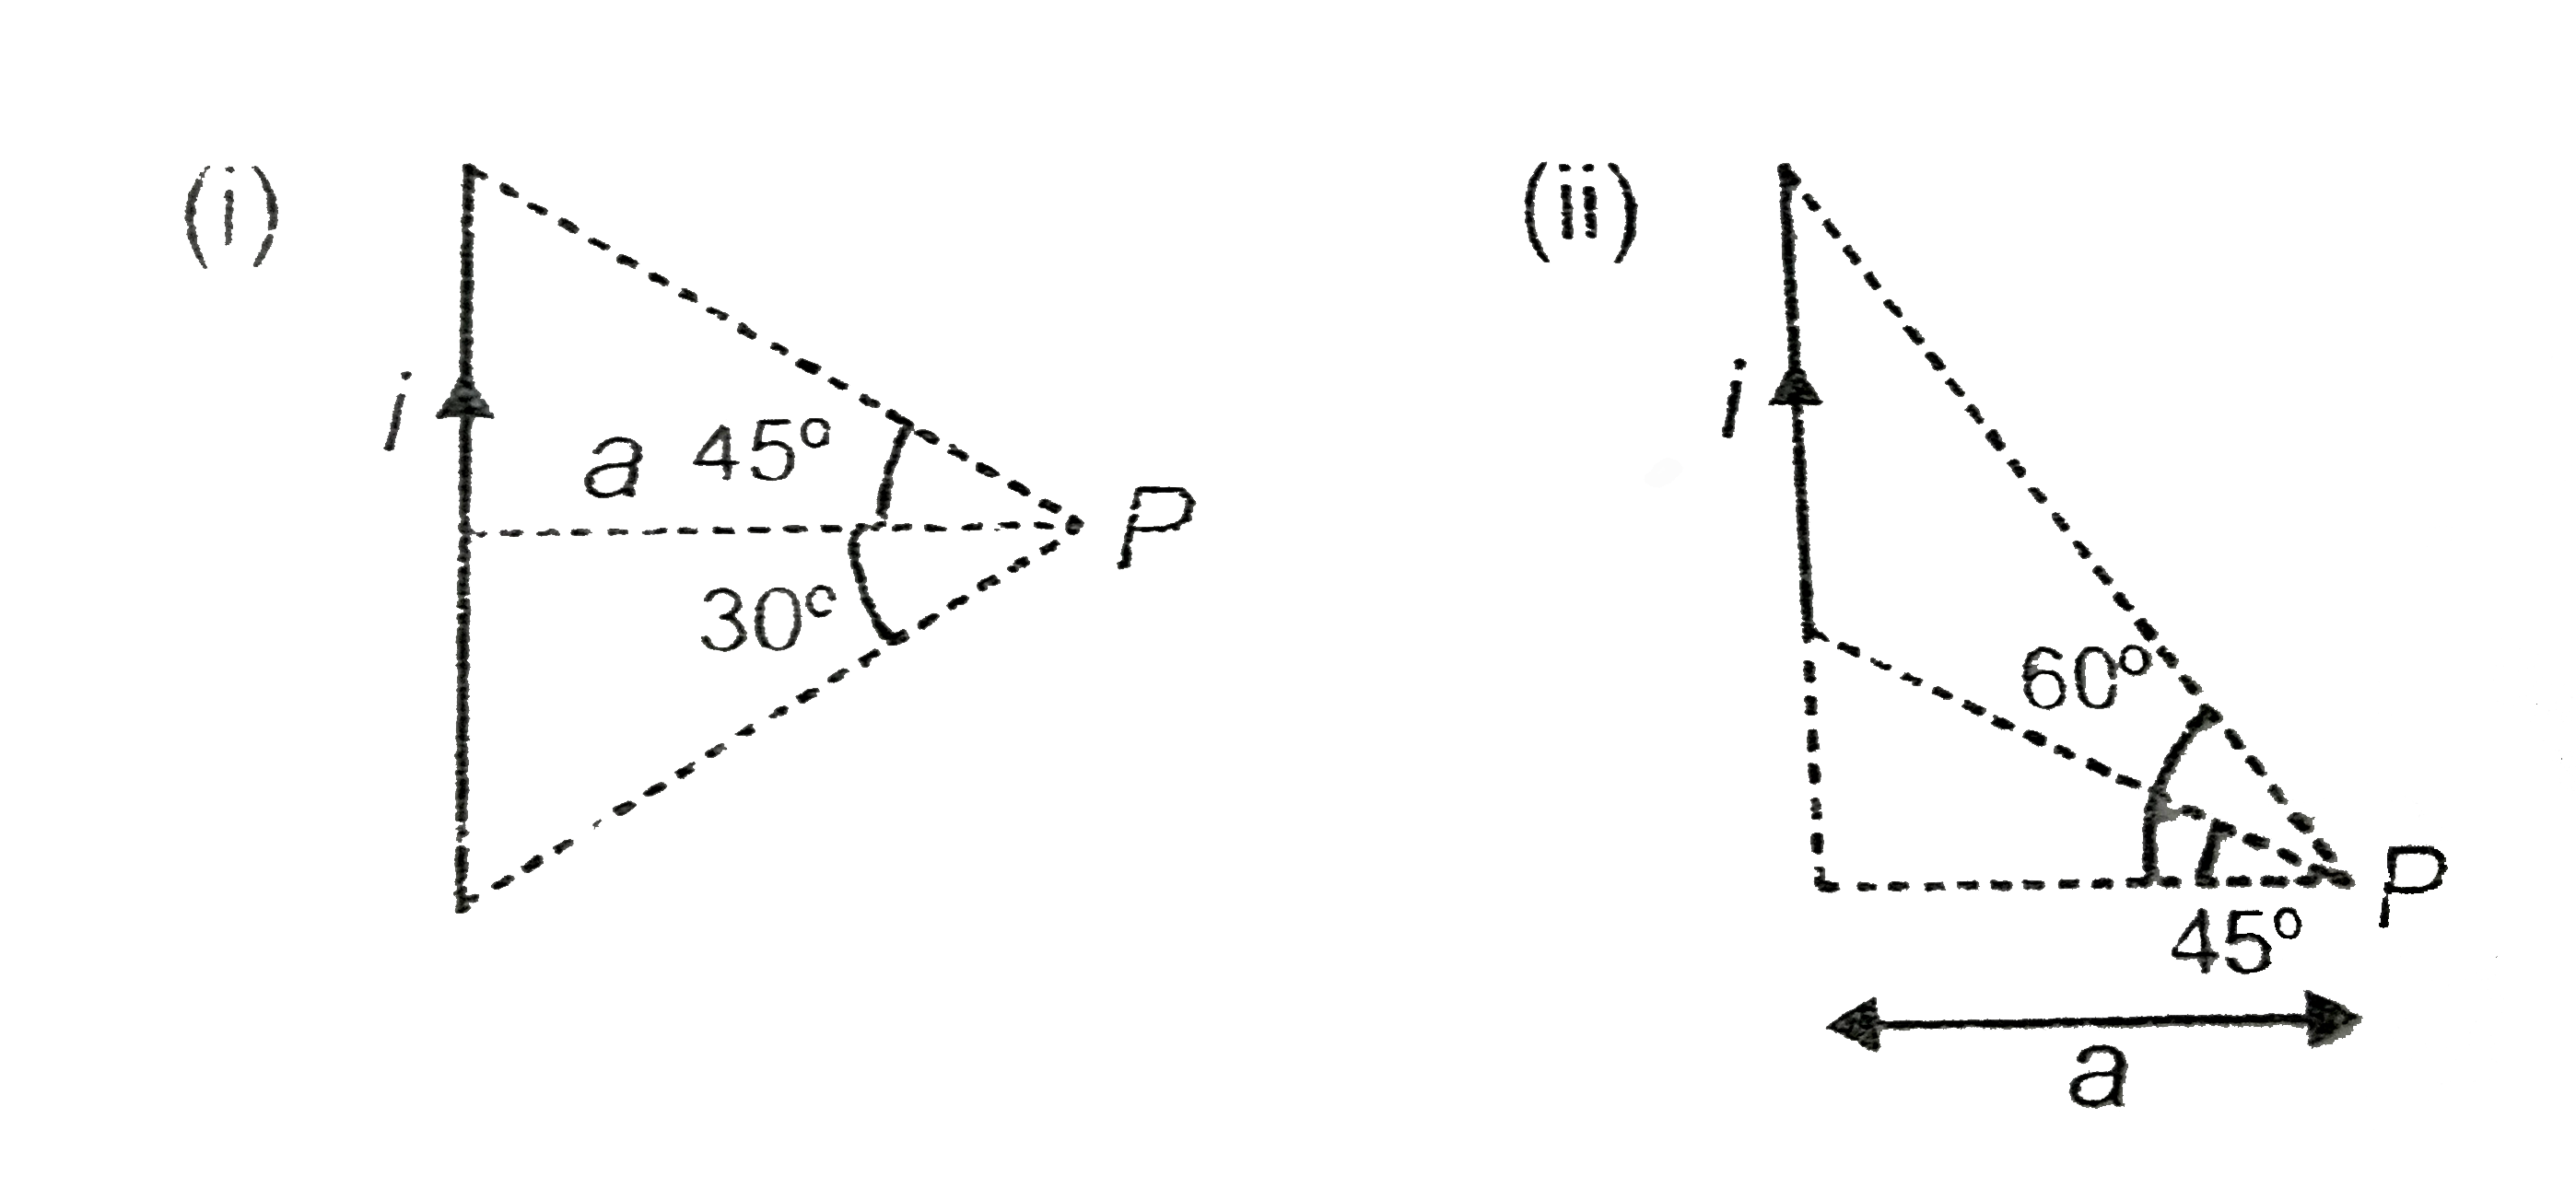
What are value of ϕ1,ϕ2 and r to find out magnetic field at P in the following cases ?
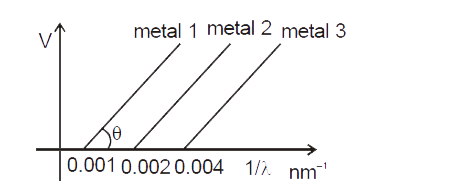
View SolutionThe graph between 1/λ and stopping potential ( V ) of three metals having work functions ϕ1,ϕ2 and ϕ3 in an experiment of photoelectric effect is plotted as shwon in the figure. Which of the following statement (s) is / are correct ? [Here λ is the wavelength of incident ray ].
View Solution
Knowledge Check
The curve between the work function of a metal (ϕo) and its temperature (T) will be
A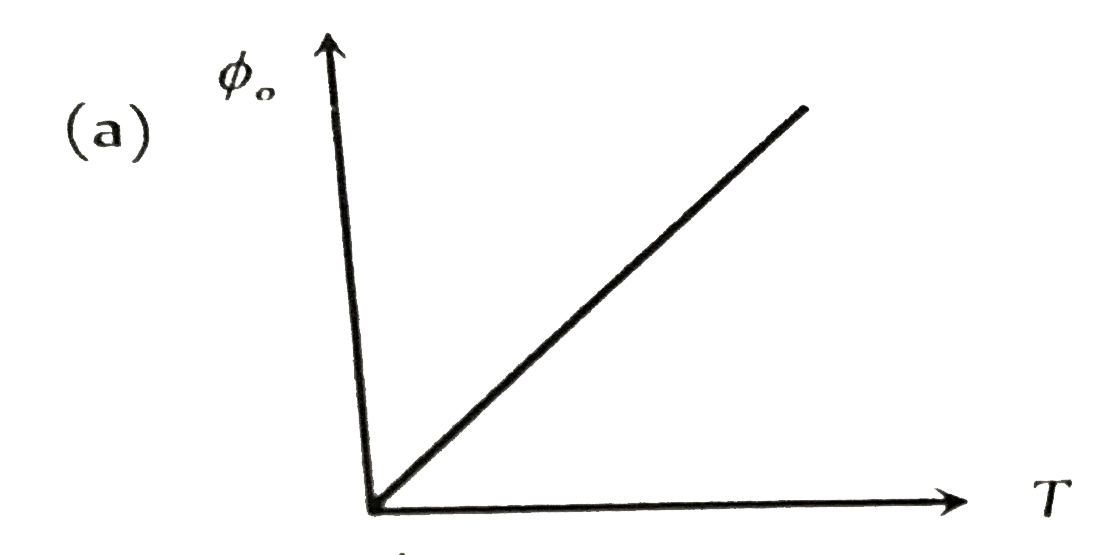 B
B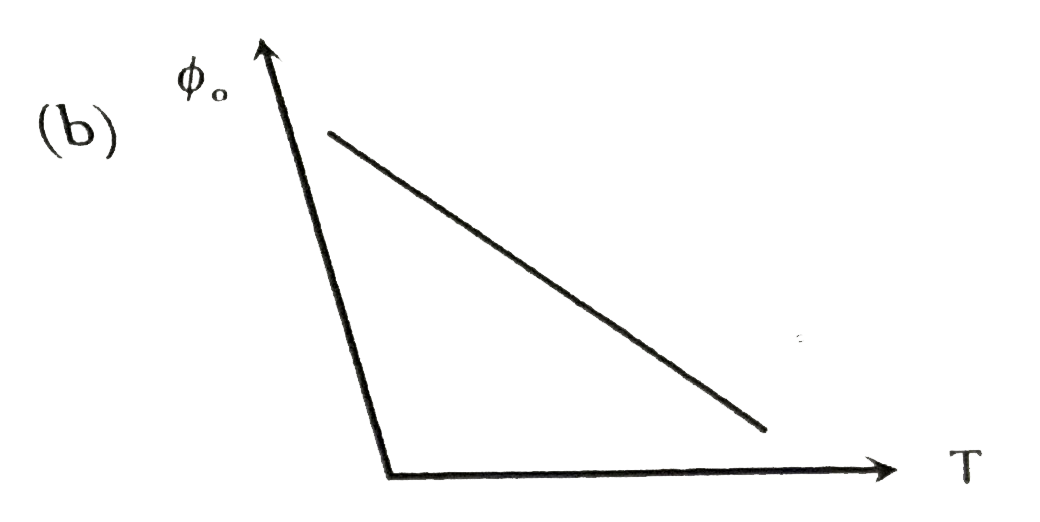 C
C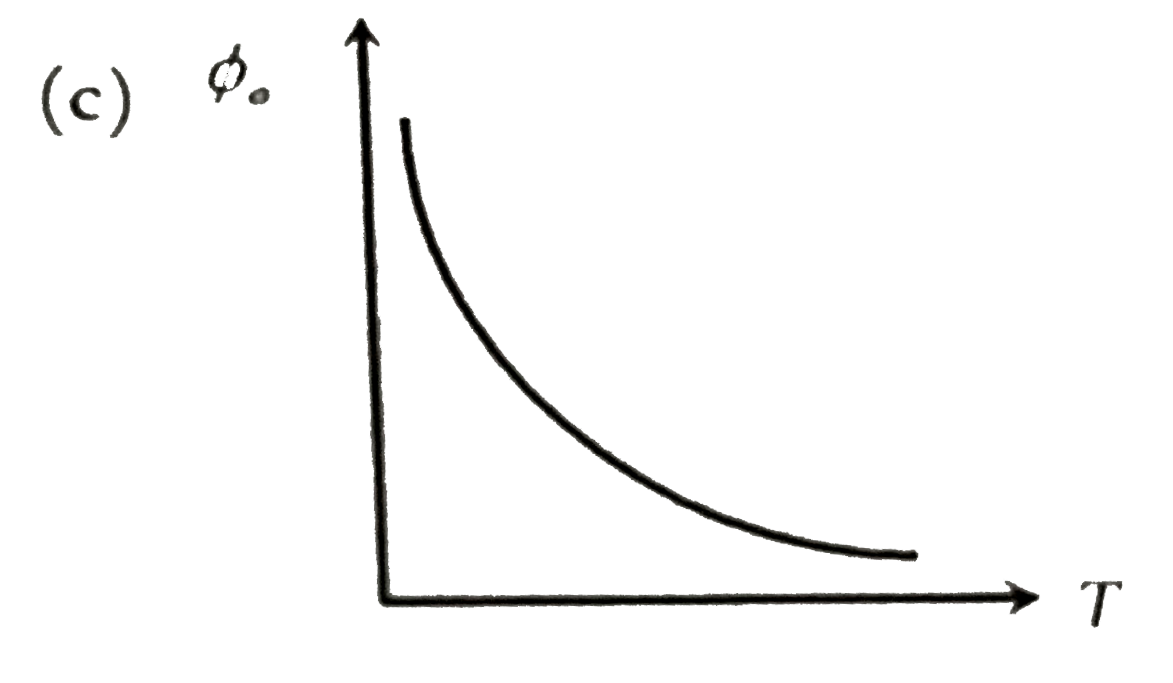 D
D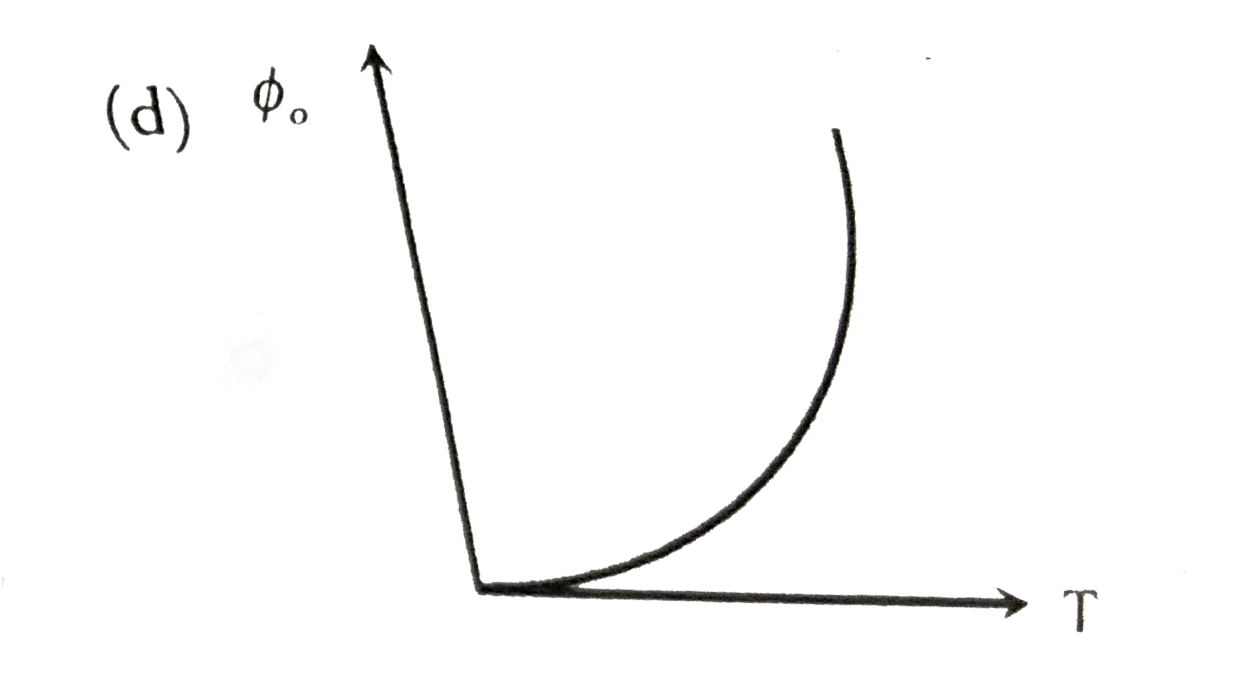
Consider the following statements
I. ϕ∈{ϕ} II. {ϕ}⊆ϕ Which of the statements given above is/are Correct?AA. I onlyBB. II onlyCC. Both I and IIDD. Neither I nor II
Let A={ϕ{ϕ},1,{1,ϕ},2}. Determine which of the following is true or fase.
View SolutionThe graph between 1λ and stopping potential V0 of two metals having work funcation ϕ1 and ϕ2 in an experiment of photoelectric effect is obtained as shown in the figure. Find out -
_E01_164_Q01.png)
(i) Threshold wavelength ofboth metals
(ii) ϕ1:ϕ2
(iii) Whihc metal cen emit photoelectrons with visible light ?
View SolutionThe graph between 1/λ and stopping potential (V) of three metals having work- functions Φ1, Φ2 and Φ3 in an experiment of photoelectric effect is plotted as shown in the figure. Which of the following statement(s) is/are correct? (Here, λ is the wavelength of the incident ray). (a) Ratio of work functions ϕ1:ϕ2:ϕ3=1:2:4 (b) Ratio of work functions ϕ1:ϕ2:ϕ3=4:2:1 (c ) tan θ is directly proportional to hc / e, where h is Planck constant and c is the speed of light (d) The violet colour light can eject photoelectrons from metals 2 and 3 .
View SolutionIf A={ϕ,{ϕ},1.{1,ϕ},7}, then Which of the following are true ?
View SolutionIf ϕ(x)=ϕ'(x) and ϕ(1)=2, then ϕ(3) equals
View SolutionIf sinθ=12andsinϕ=13, find the value of sin(θ+ϕ)andsin(2θ+2ϕ)
View Solution

