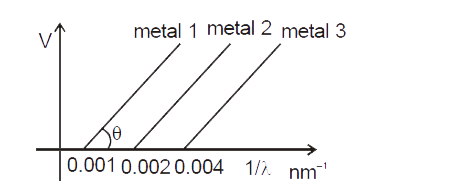
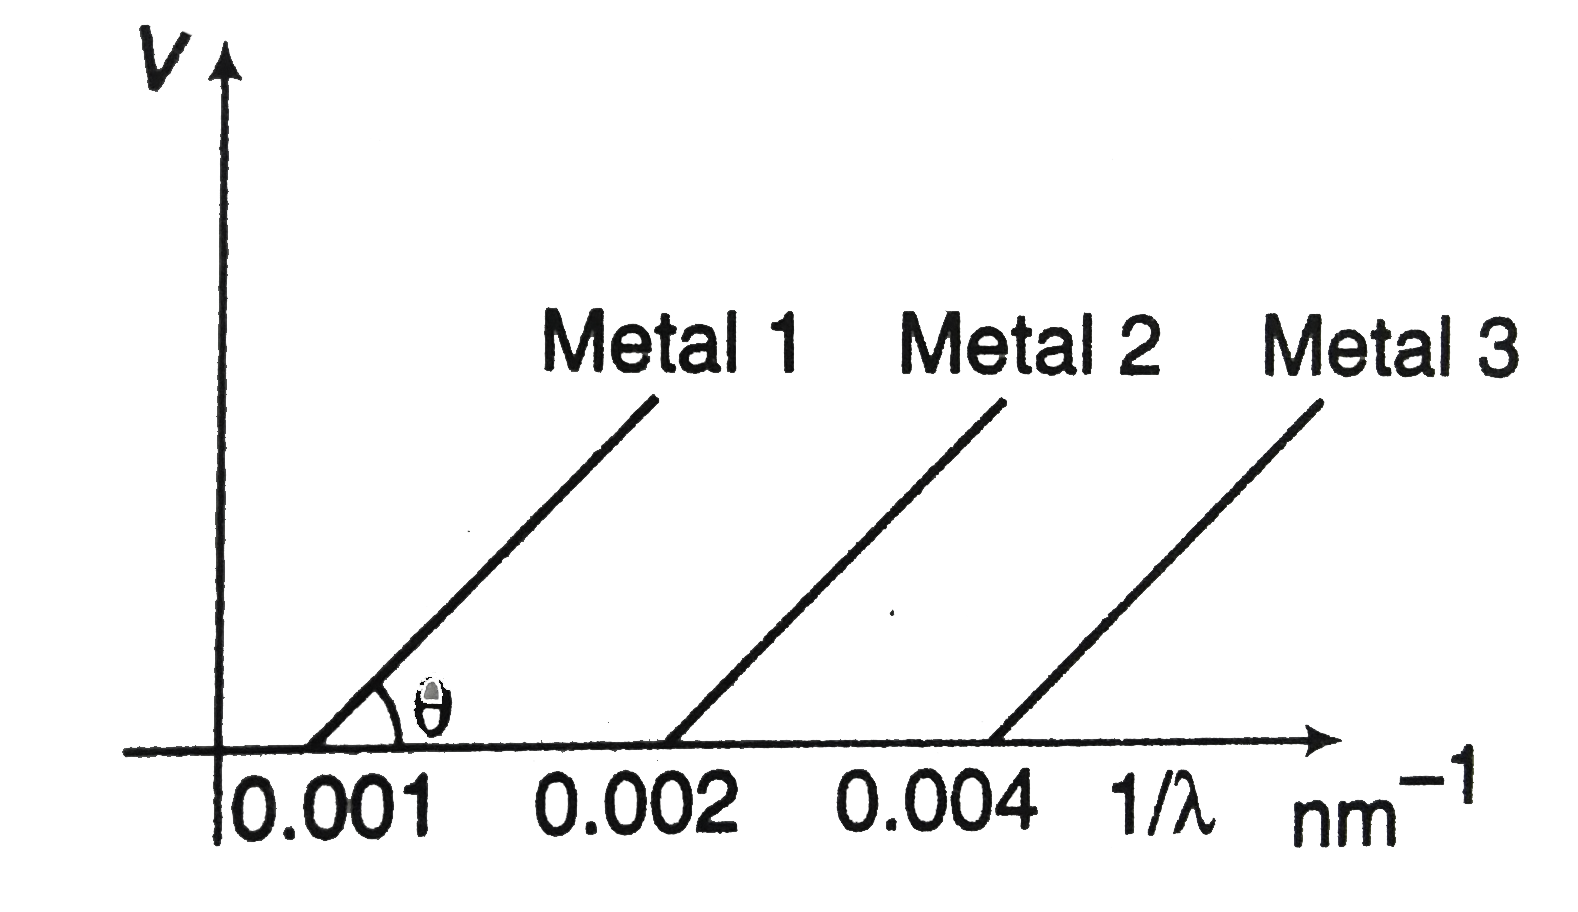
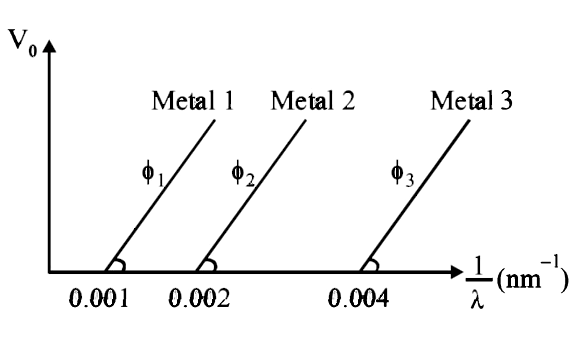
The graph between 1λ and stopping potential V0 of two metals having work funcation ϕ1 and ϕ2 in an experiment of photoelectric effect is obtained as shown in the figure. Find out -
_E01_164_Q01.png)
(i) Threshold wavelength ofboth metals
(ii) ϕ1:ϕ2
(iii) Whihc metal cen emit photoelectrons with visible light ?
The correct Answer is:(i) 5000Å,2000Å,
(ii) 2:5 (ii) Metal-1
(i) For metal 1 threshold wavelength is λ1
1λ1=0.002nm−1 or λ1=500nm=5000Å
For metal 2 threshold wavelength is λ2
1λ2=0.005nm−1 or λ2=200nm=2000Å
(ii) ϕ=hcλ0 or ϕ∝1λ0 ∴ϕ1:ϕ2=2:5
(iii) Metal 1 because λ1 lies in visible wavelength range.
Topper's Solved these Questions
- SIMPLE HARMONIC MOTIONBook:ALLENChapter:SIMPLE HARMONIC MOTIONExercise:Exercise-04 [B]
Explore 105 Videos
- SIMPLE HARMONIC MOTIONBook:ALLENChapter:SIMPLE HARMONIC MOTIONExercise:Exercise-05(B)
Explore 46 Videos
- SIMPLE HARMONIC MOTIONBook:ALLENChapter:SIMPLE HARMONIC MOTIONExercise:Exercise - 35
Explore 2 Videos
- RACEBook:ALLENChapter:RACEExercise:Basic Maths (Wave Motion & Dopplers Effect) (Stationary waves & doppler effect, beats)
Explore 25 Videos
- TEST PAPERBook:ALLENChapter:TEST PAPERExercise:PHYSICS
Explore 4 Videos
Similar Questions
The graph between 1/λ and stopping potential ( V ) of three metals having work functions ϕ1,ϕ2 and ϕ3 in an experiment of photoelectric effect is plotted as shwon in the figure. Which of the following statement (s) is / are correct ? [Here λ is the wavelength of incident ray ].

View SolutionThe graph between 1/λ and stopping potential (V) of three metals having work- functions Φ1, Φ2 and Φ3 in an experiment of photoelectric effect is plotted as shown in the figure. Which of the following statement(s) is/are correct? (Here, λ is the wavelength of the incident ray). (a) Ratio of work functions ϕ1:ϕ2:ϕ3=1:2:4 (b) Ratio of work functions ϕ1:ϕ2:ϕ3=4:2:1 (c ) tan θ is directly proportional to hc / e, where h is Planck constant and c is the speed of light (d) The violet colour light can eject photoelectrons from metals 2 and 3 .

View Solution
Knowledge Check
The graph between the stopping potential (V0)and(1λ) is shown in the figure ϕ1,ϕ2andϕ3 are work function , which of the following is //are correct
 Aϕ1:ϕ2:ϕ3=1:2:4Bϕ1:ϕ2:ϕ3=4:2:1Ctanθ∝hc€Dultravioletight can be used emit photoelectrons from metal 2 and 3only
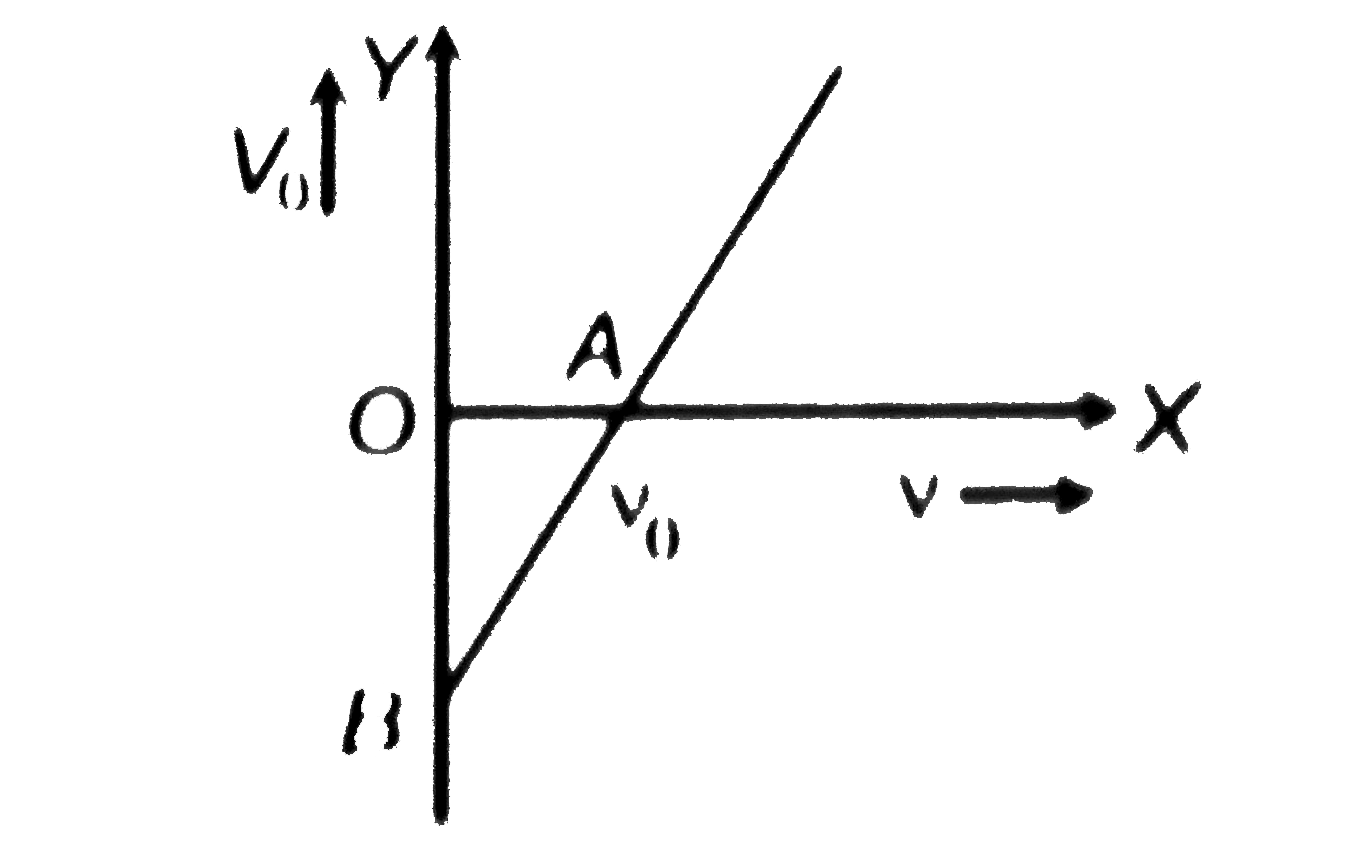
In an experiment on photoelectric effect the frequency f of the incident light is plotted against the stopping potential V0. The work function of the metal is given by ( e is the electronic charge)
 AOB×e in eVBOB in VoltCOA in VoltDThe slope of the line AB
The work function (ϕ) of some metals is listed below. The number of metals which will show photoelectric effect when light of 300 nm wavelength falls on the metals is :
 A2B4C6D8
Draw a graph between stopping potential and the frequency of two metals A and B having threshold frequencies v0and2v0 .
View SolutionA metal has a work function ϕ0 and its corresponding threshold wavelength is λ0. If the threshold wavelength for a metal whose work function is ϕ03 is nλ0, then what is the value of n ?
View SolutionA metal has a work function ϕ0 and its corresponding threshold wavelength is λ0. If the threshold wavelength for a metal whose work function is ϕ03 is nλ0, then what is the value of n ?
View SolutionThe work function (ϕ) of some metals is listed below . The number of metals which will show photoelectric effect when light of 300 nm wavelength falls on the metal is :

View SolutionThe photoelctric effect work function for a metal is 4.2 eV. If the stopping potential is 3V, find the threshold wavelength and the maximum kinetic energy of emitted electrons.
View Solution