Draw a graph showing the variation of stopping potential with frequency of the incident radiation. What does the slope of the line with frequency axis indicate? What information can be obtained from the values of intercept on the potential axis?
h.e
h/e
eh
(e−h)
The correct Answer is:B
Step by step video, text & image solution for Draw a graph showing the variation of stopping potential with frequency of the incident radiation. What does the slope of the line with frequency axis indicate? What information can be obtained from the values of intercept on the potential axis? by Physics experts to help you in doubts & scoring excellent marks in Class 12 exams.
Updated on:21/07/2023Topper's Solved these Questions
- DUAL NATUREBook:NARAYNAChapter:DUAL NATUREExercise:LEVEL-I (C.W)
Explore 16 Videos
- DUAL NATUREBook:NARAYNAChapter:DUAL NATUREExercise:LEVEL-II (C.W)
Explore 20 Videos
- DUAL NATUREBook:NARAYNAChapter:DUAL NATUREExercise:LEVEL-II (H.W)
Explore 17 Videos
- DUAL NATURE OF RADIATION AND MATTERBook:NARAYNAChapter:DUAL NATURE OF RADIATION AND MATTERExercise:ASSERTION AND REASON
Explore 15 Videos
- ELECTRIC CHARGES AND FIELDSBook:NARAYNAChapter:ELECTRIC CHARGES AND FIELDSExercise:EXERCISE -4
Explore 43 Videos
Similar Questions
Draw and explain the graph showing the variation of stopping potential with frequency of incident radiation in relation to photoelectric effect.
View SolutionDraw a graph showing the variation of stopping potential with frequency of the incident on a metal plate. How can the value of Planck's constant be determined from this graph?
View Solution
Knowledge Check
Which of the following is the graph between the frequency (v) of the incident radiations and the stopping potential ?
A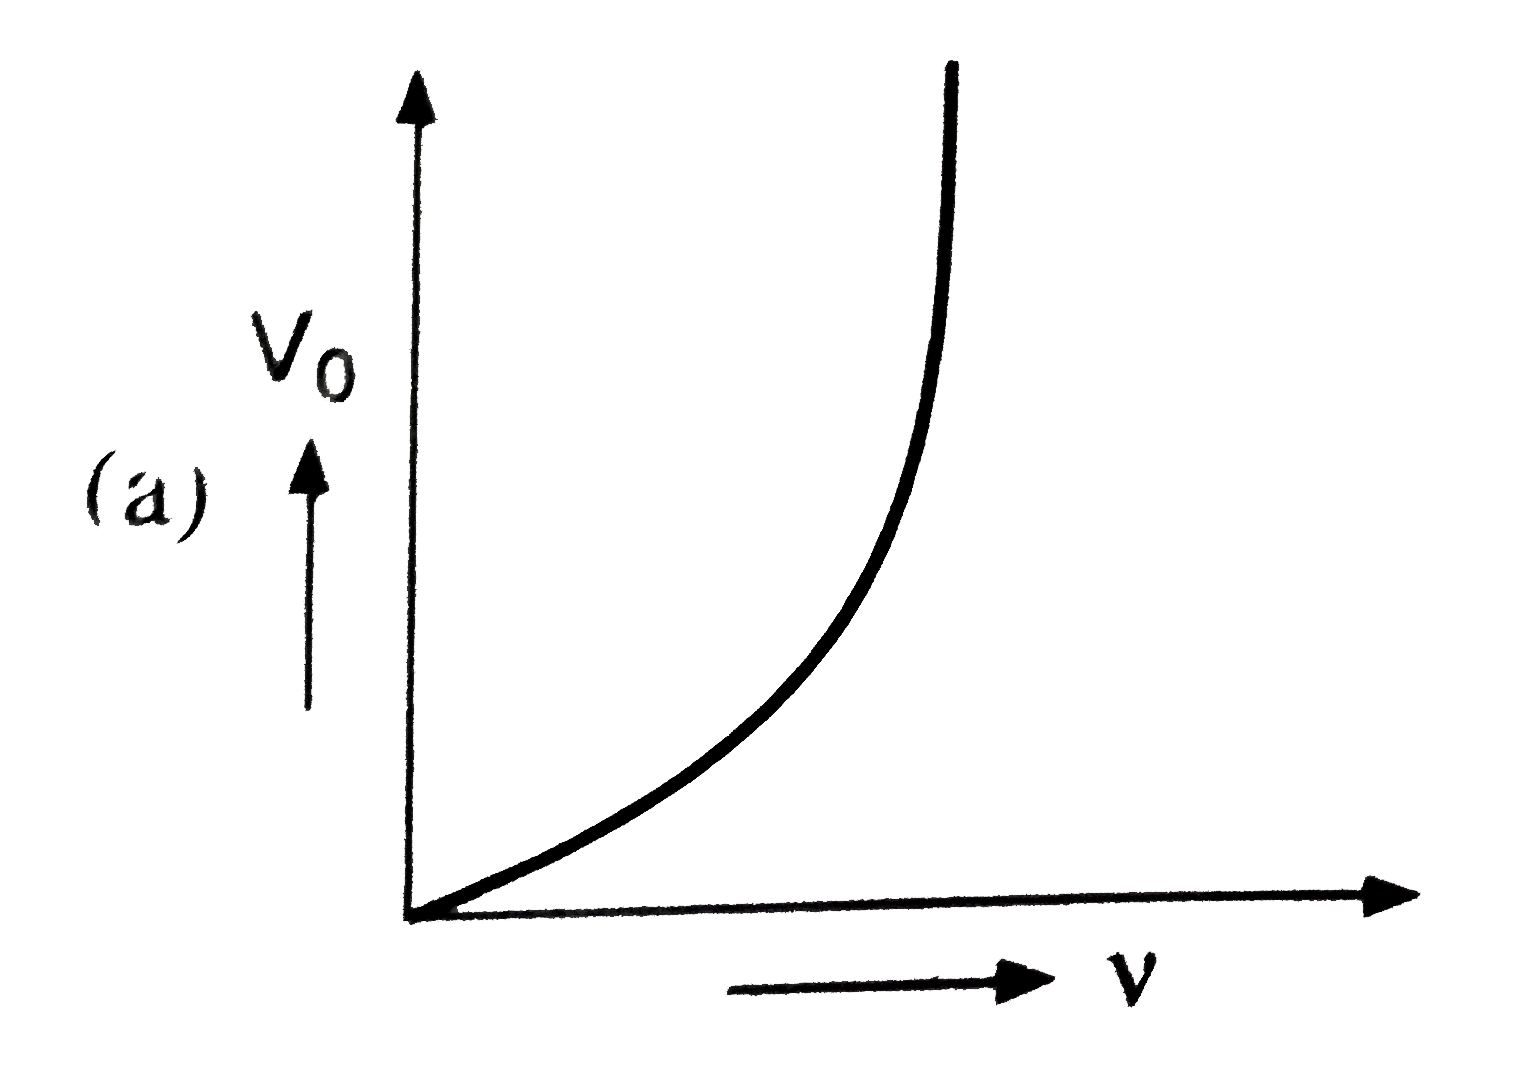 B
B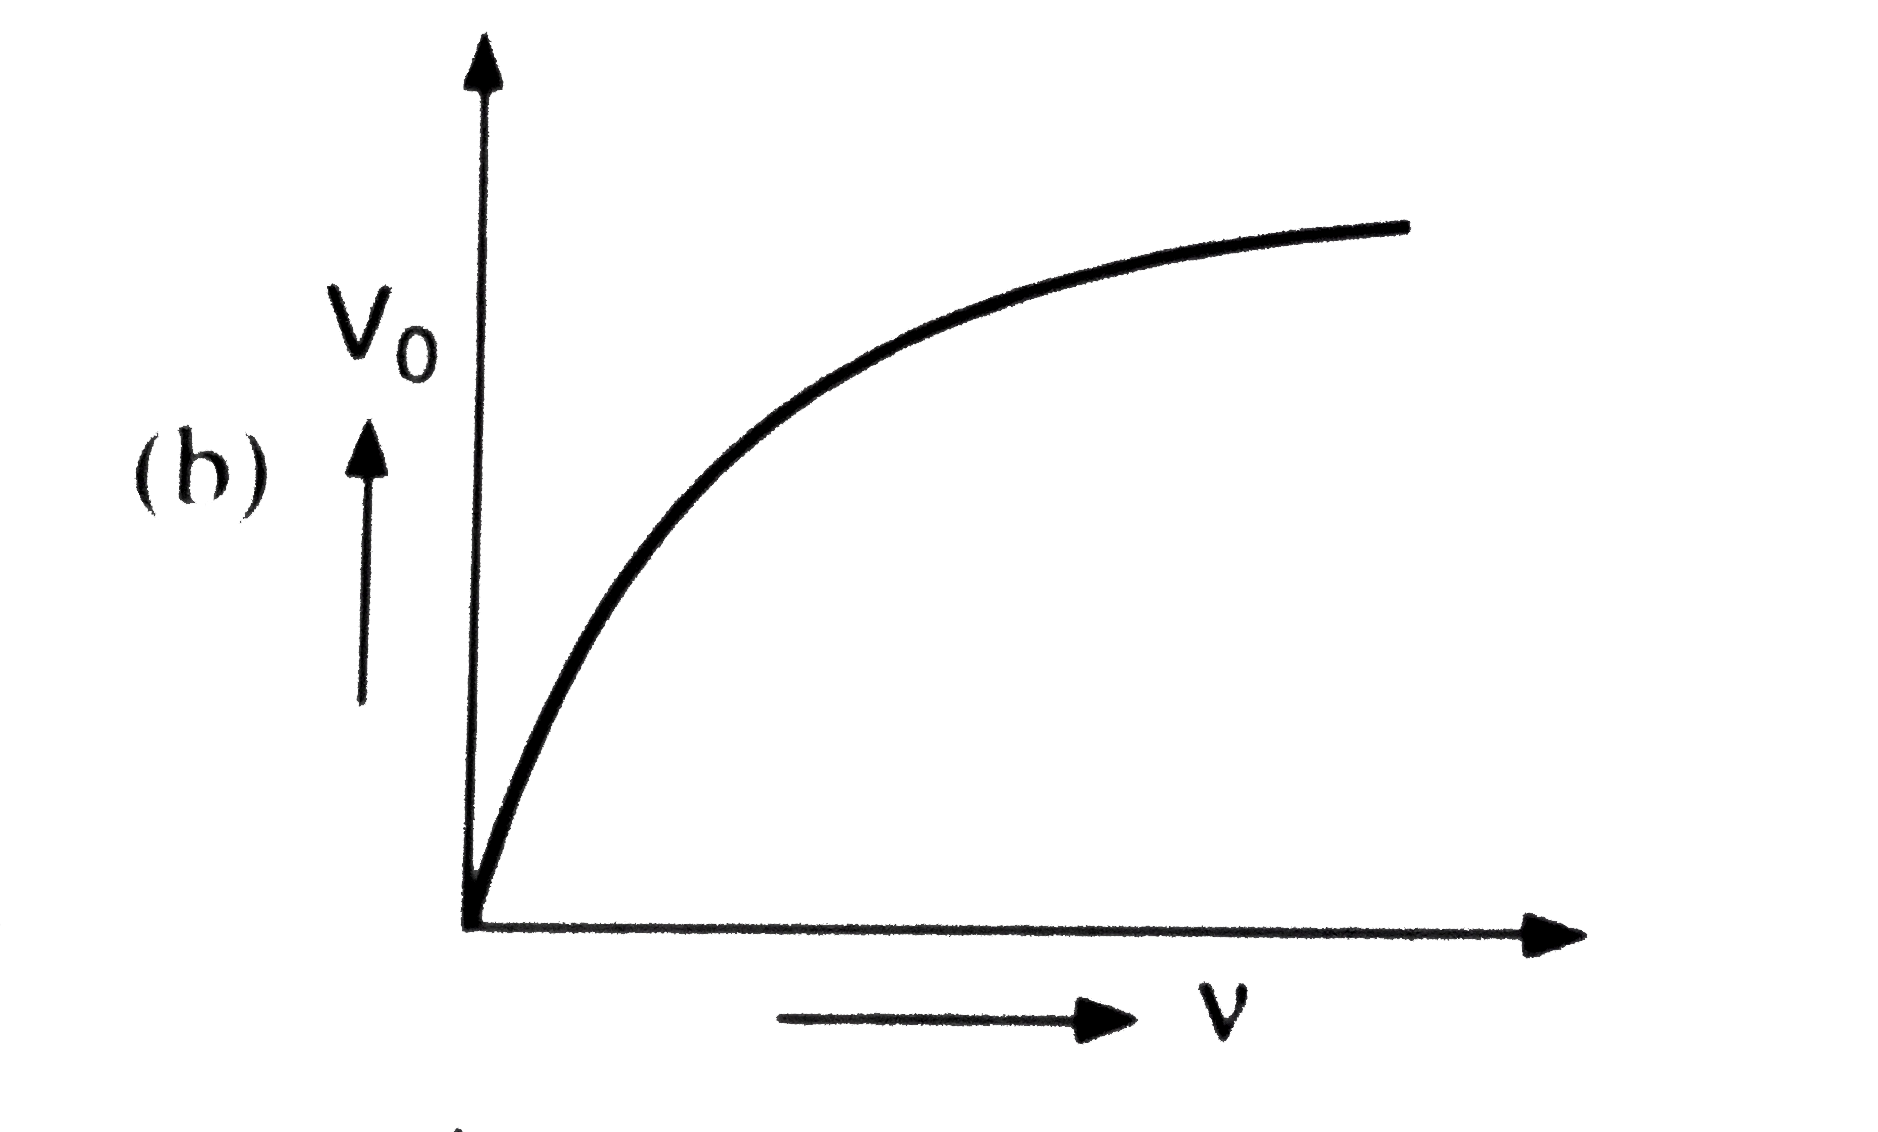 C
C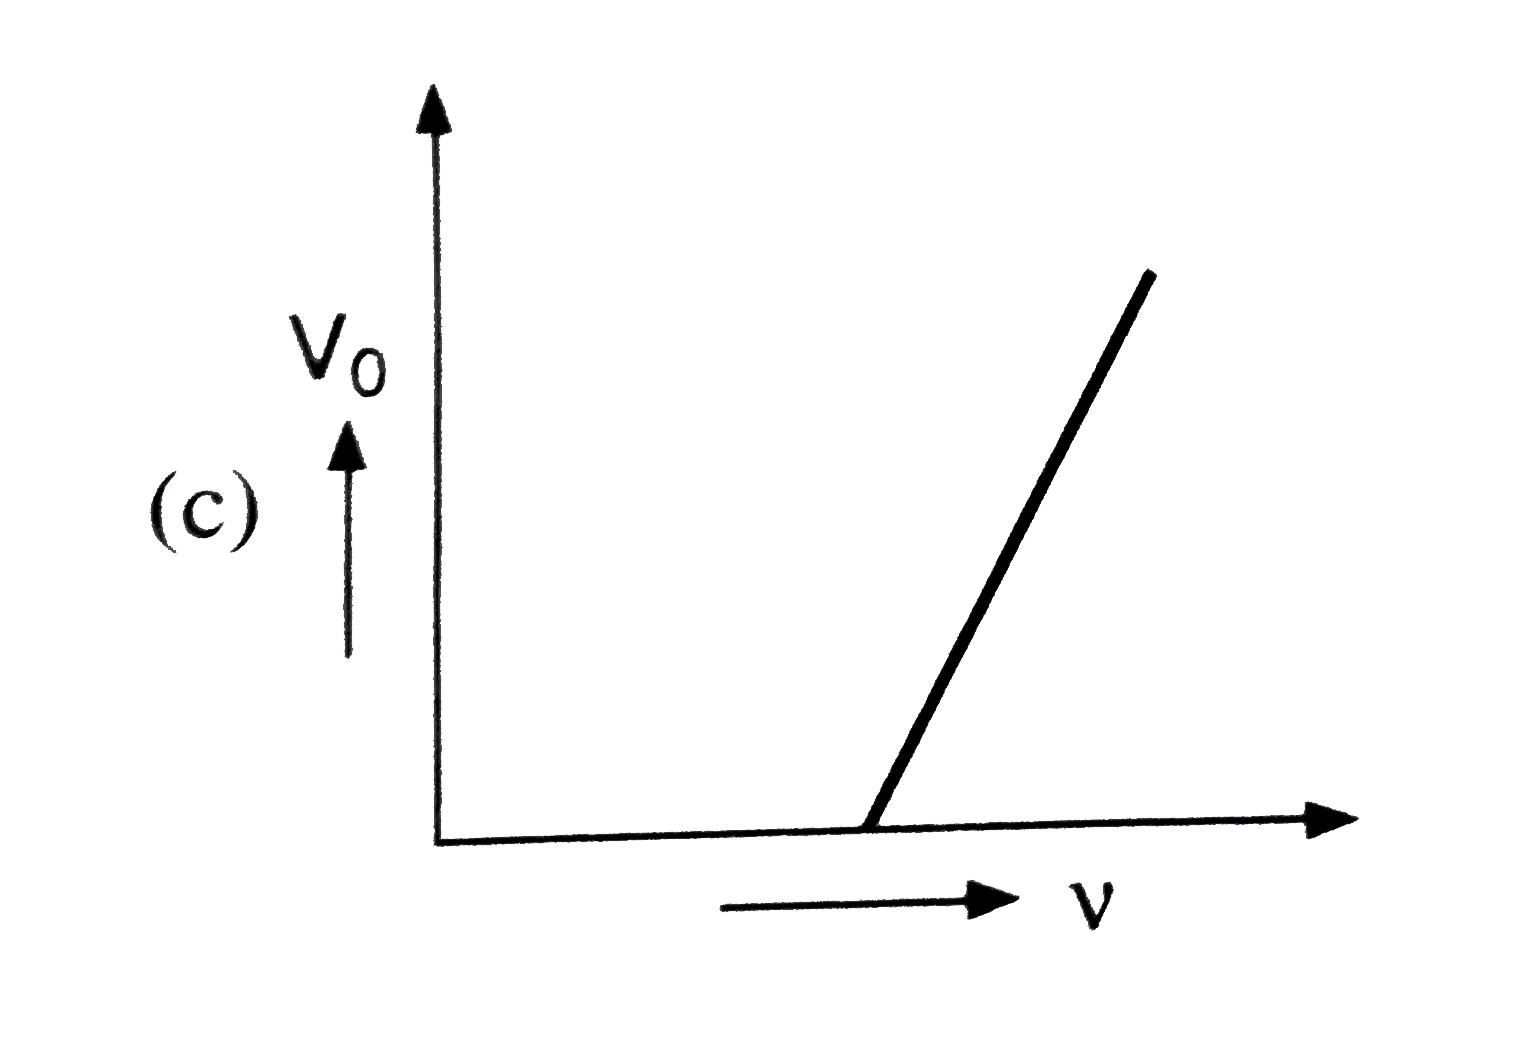 D
D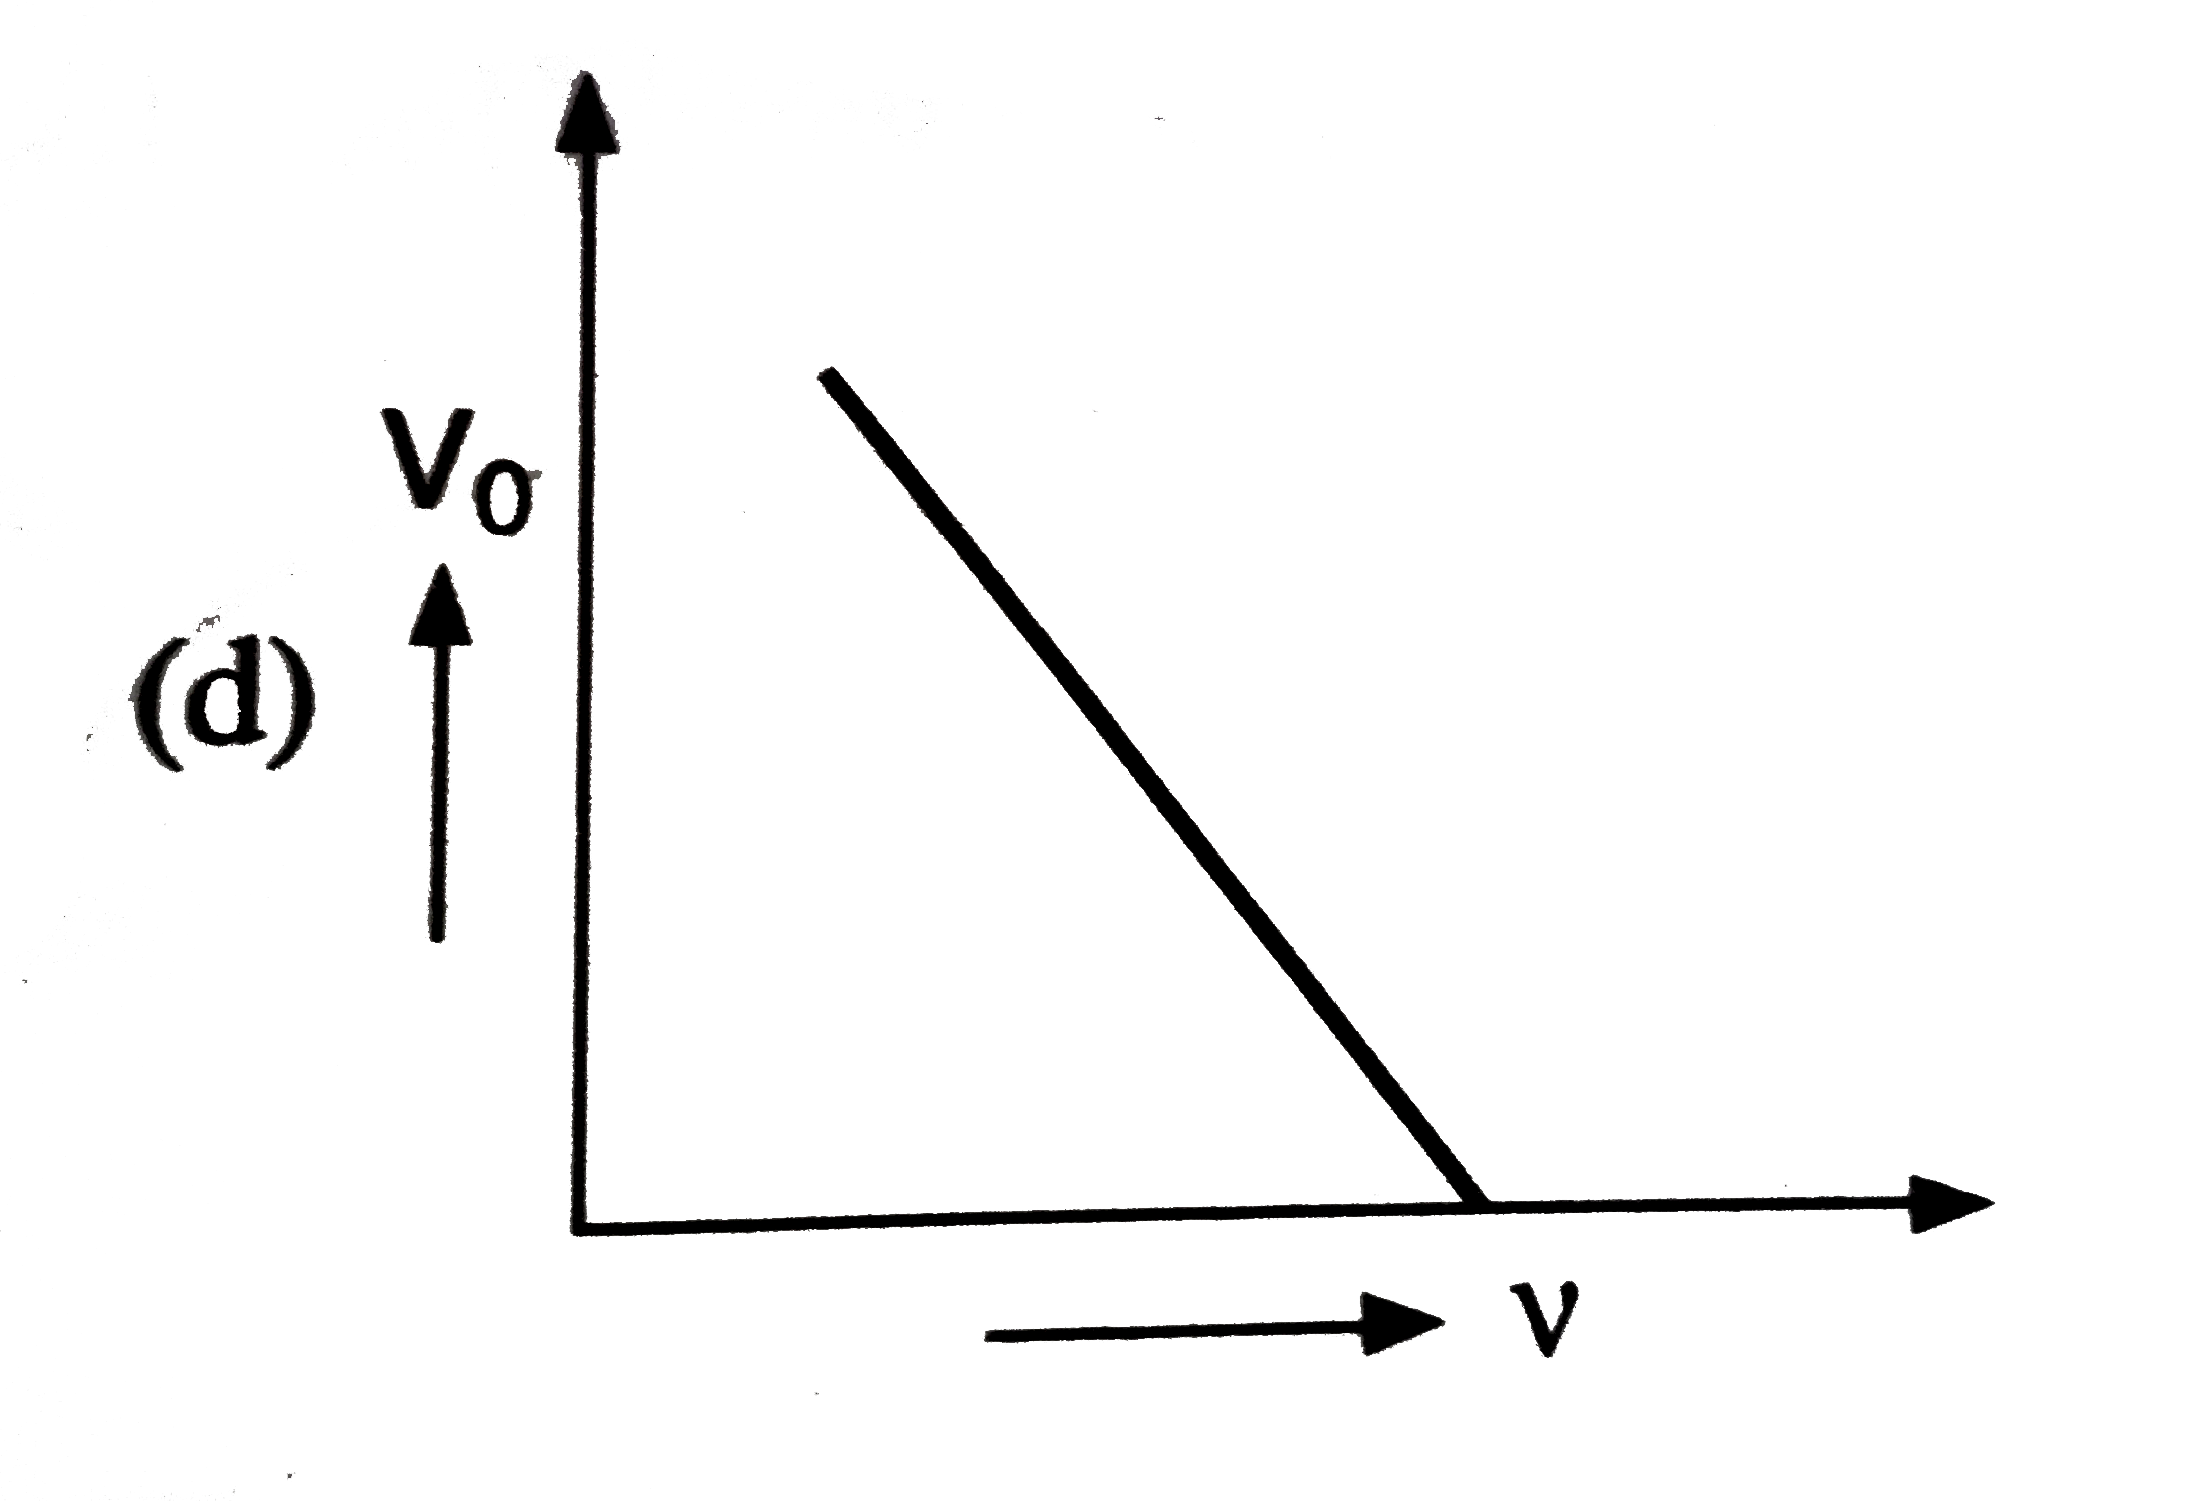
From the graph shown, the value of work function if the stopping potential (V), and frequency of the incident light vare on y and x-axes respectively is
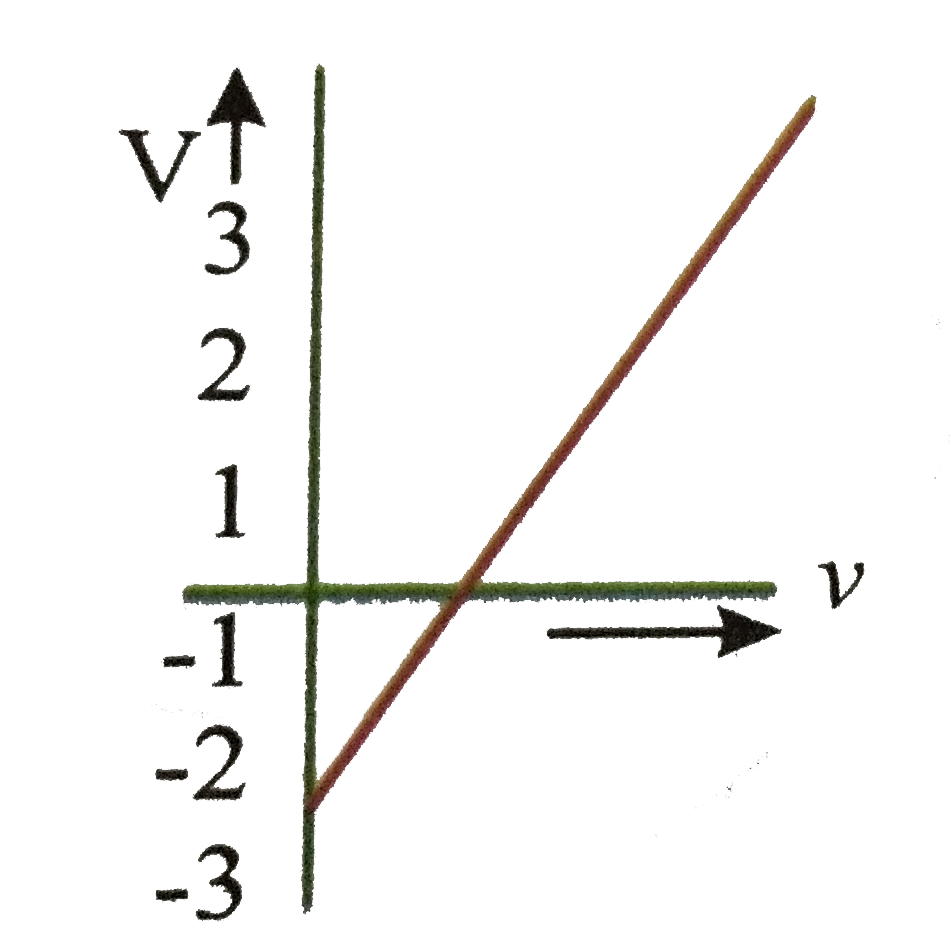 A1eVB2eVC3eVD4eV
The graph between frequency of incident radiations and stopping potential for a given photosensitive material as follows.
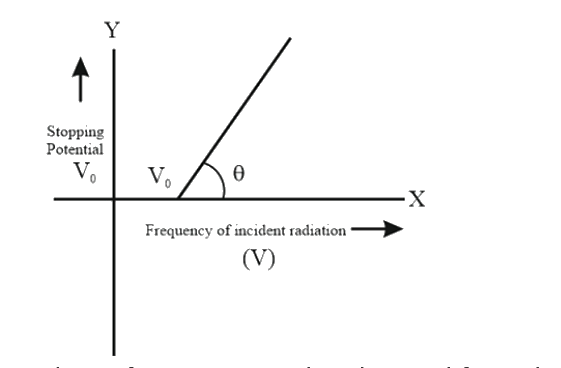
What information can be obtained from the value of the intercept on the potential axis ?
View SolutionDefine photoelectric effect. Draw a graph to show the variation of stopping potential with frequency of incident radiation on a metal plate.
View SolutionSketch a graph between frequency of incident radiations and stopping potential for a given photosenstive material. What information can be obtained from the value of the intercept on the potential axis? A source of light of frequency greater than the threshold frequency is placed at a distance of 1m from the cathode of a photocell. The stopping potential is found to be V. If the distance of the light source from the cathode is reduced, explain giving reasons, what change will you observe in the (i) photoelectric current (i) stopping potential?
View SolutionPlot a graph showing variation of stopping potential (V0) with the frequency (v) of the incident radiation for a given photosensitive material. Hence, state the significance of the threshold frequency in photoelectric emission.
Using the principle of energy conservation, write the equation relating the energy of incident photon, threshold frequency and the maximum kinetic energy of the emitted photoelectrons.
View SolutionSketch the graphs, showing the variation of stopping potential Vs with frequency v of the incident radiations for two photosensitive materials A and B having threshold frequencies v0>v'0 respectively.
(i) which of the two metals A or B has higher work function?
(ii) What information do you get from the slope of the graphs?
(iii) What does the value of the intercept of graph A on the potential axis represent?
View SolutionThe figure shows the variation of stopping potential VQ with the frequency v of the incident radiations for two photosensitive metals P and
Which metal has smaller threshold wavelength ? Justify your answer.
View Solution

