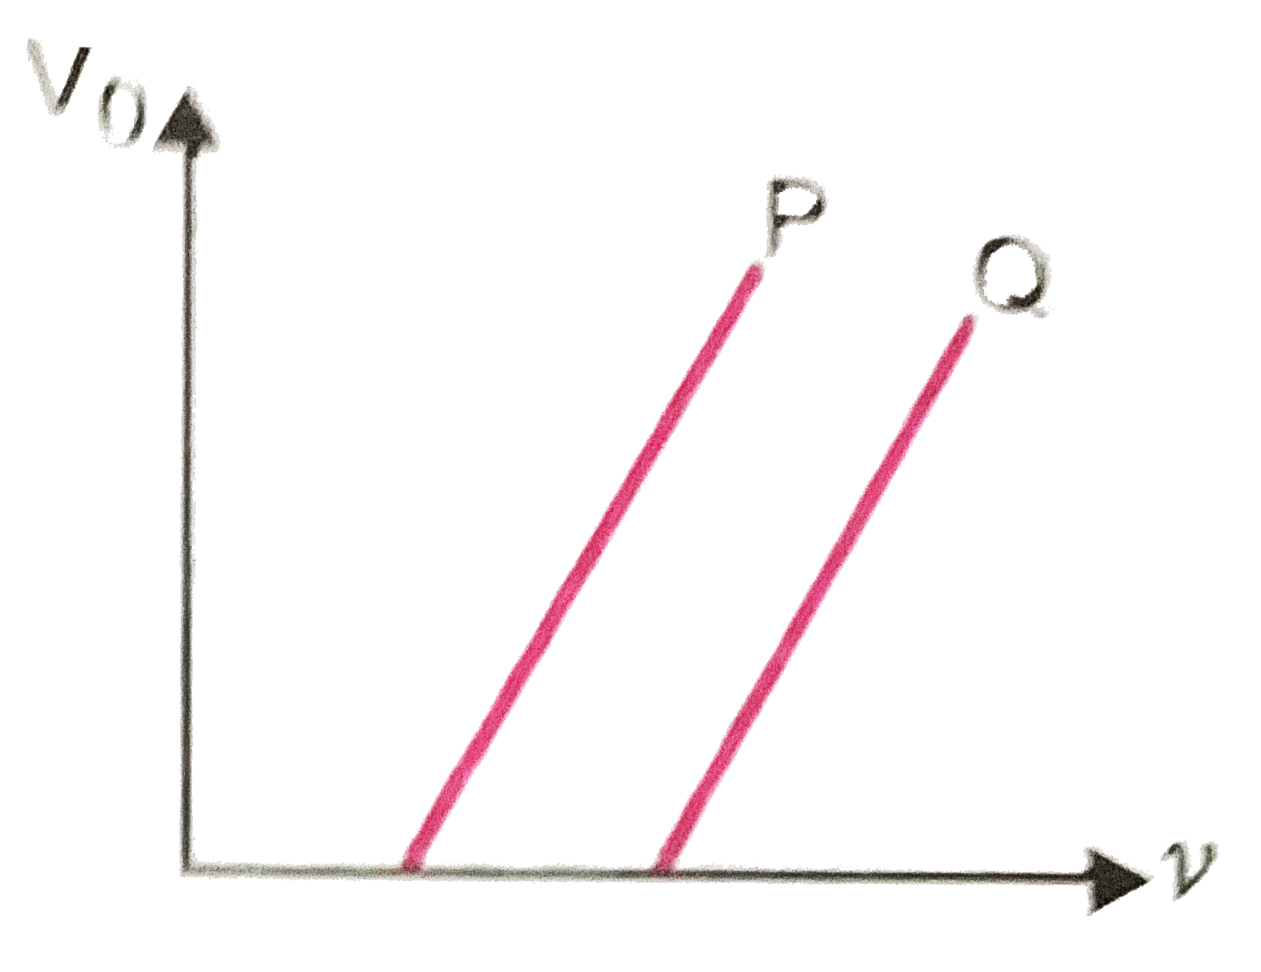
The figure shows the variation of stopping potential VQ with the frequency v of the incident radiations for two photosensitive metals P and
Which metal has smaller threshold wavelength ? Justify your answer.
To determine which metal has a smaller threshold wavelength based on the given information, we can follow these steps:
Step 1: Understand the relationship between frequency and wavelength
The threshold wavelength (λ0) is related to the threshold frequency (ν0) by the equation:
λ0=cν0
where c is the speed of light. This shows that the wavelength is inversely proportional to the frequency.
Step 2: Analyze the stopping potential vs. frequency graph
From the problem, we know that there are two metals, P and Q, and we have a graph showing the variation of stopping potential (VQ) with frequency (ν). The threshold frequency is the frequency at which the stopping potential starts to increase, indicating that photoemission begins.
Step 3: Identify the threshold frequencies for both metals
By examining the graph:
- Identify the frequency at which the stopping potential for metal P starts to increase. This is the threshold frequency (ν0P).
- Identify the frequency at which the stopping potential for metal Q starts to increase. This is the threshold frequency (ν0Q).
Step 4: Compare the threshold frequencies
From the graph, if it is observed that:
ν0Q>ν0P
this means that the threshold frequency for metal Q is higher than that for metal P.
Step 5: Determine the threshold wavelengths
Using the relationship from Step 1:
- For metal P:
λ0P=cν0P
- For metal Q:
λ0Q=cν0Q
Since ν0Q>ν0P, it follows that:
λ0Q<λ0P
Conclusion
Thus, metal Q has a smaller threshold wavelength compared to metal P.
Justification
The justification for this conclusion is based on the inverse relationship between wavelength and frequency. A higher threshold frequency corresponds to a lower threshold wavelength.
---
The threshold wavelength (λ0) is related to the threshold frequency (ν0) by the equation:
λ0=cν0
where c is the speed of light. This shows that the wavelength is inversely proportional to the frequency.
From the problem, we know that there are two metals, P and Q, and we have a graph showing the variation of stopping potential (VQ) with frequency (ν). The threshold frequency is the frequency at which the stopping potential starts to increase, indicating that photoemission begins.
By examining the graph:
- Identify the frequency at which the stopping potential for metal P starts to increase. This is the threshold frequency (ν0P).
- Identify the frequency at which the stopping potential for metal Q starts to increase. This is the threshold frequency (ν0Q).
From the graph, if it is observed that:
ν0Q>ν0P
this means that the threshold frequency for metal Q is higher than that for metal P.
Using the relationship from Step 1:
- For metal P:
λ0P=cν0P
- For metal Q:
λ0Q=cν0Q
λ0Q<λ0P
Thus, metal Q has a smaller threshold wavelength compared to metal P.
The justification for this conclusion is based on the inverse relationship between wavelength and frequency. A higher threshold frequency corresponds to a lower threshold wavelength.
Topper's Solved these Questions
Similar Questions
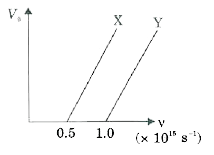
The following graph shows the variation of stopping potential V0 with the frequency v of the incident radiation for two photosensitive metals X and Y.
(i) Which metal has larger threshold wavelength ? Give reason.
(ii) Explain giving reason , which metal gives out electrons , having larger kinetic energy , for same wavelength of the incident radiation.
(iii) If the distance between the light source and metal X is halved , how will the kinetic energy of electrons emitted from it change ? Given reason.

View SolutionFig. shows the variation of stopping potential V0 with the frequency v of the incident radiation for two photosensitive metal P and Q:
(i) Explain which metal has smaller threshold wavelength

(ii) Explain, giving reason, which metal emits photoelectrons having smaller kinetic energy, for the same wavelength of incident radiation.
(iii) If the distance between the light source and metal P is doubled, how will the stopping potential change.
View Solution
Knowledge Check
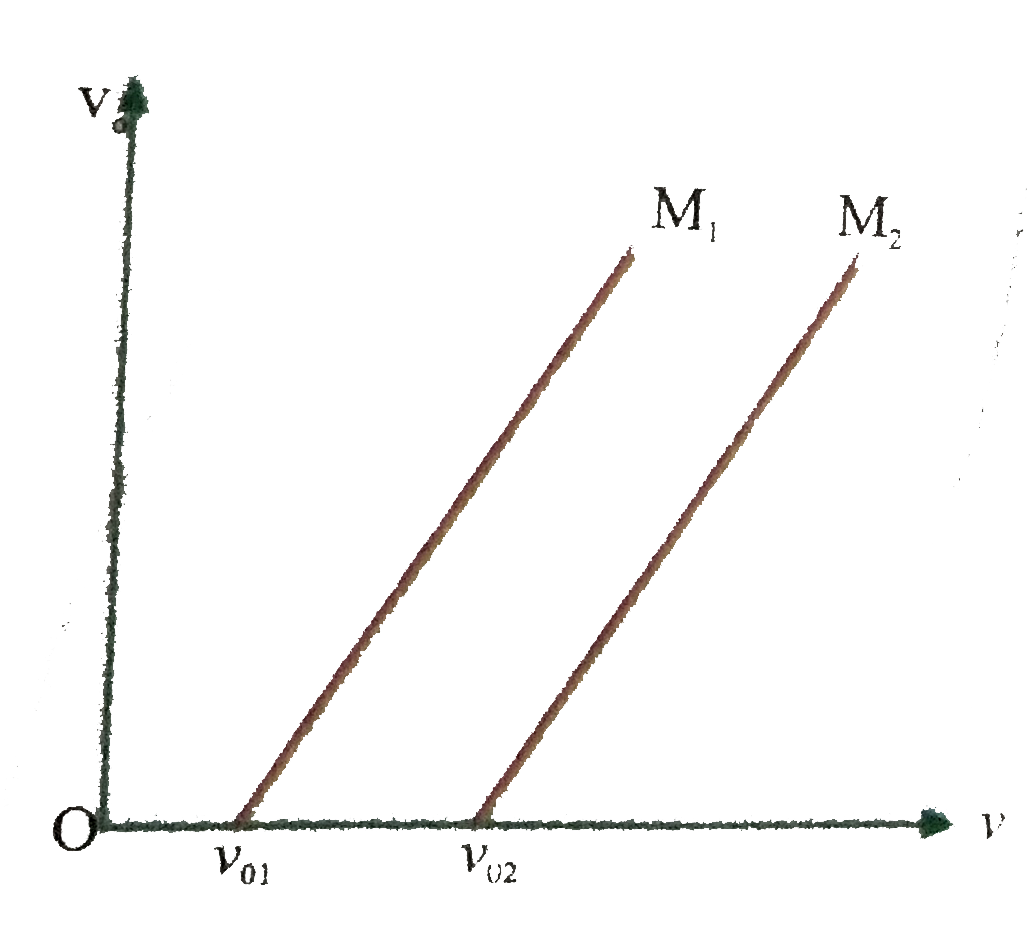
Figure show the variation of the stopping potential (V0) with the frequency (v) of the incident radiations for two different photosensitive matererial M1 and M2 What are the values of work functions for M1 and M2 respectively
 Ahv01,hv02Bhv02,hv01Chv01,hv01Dhv02,hv02
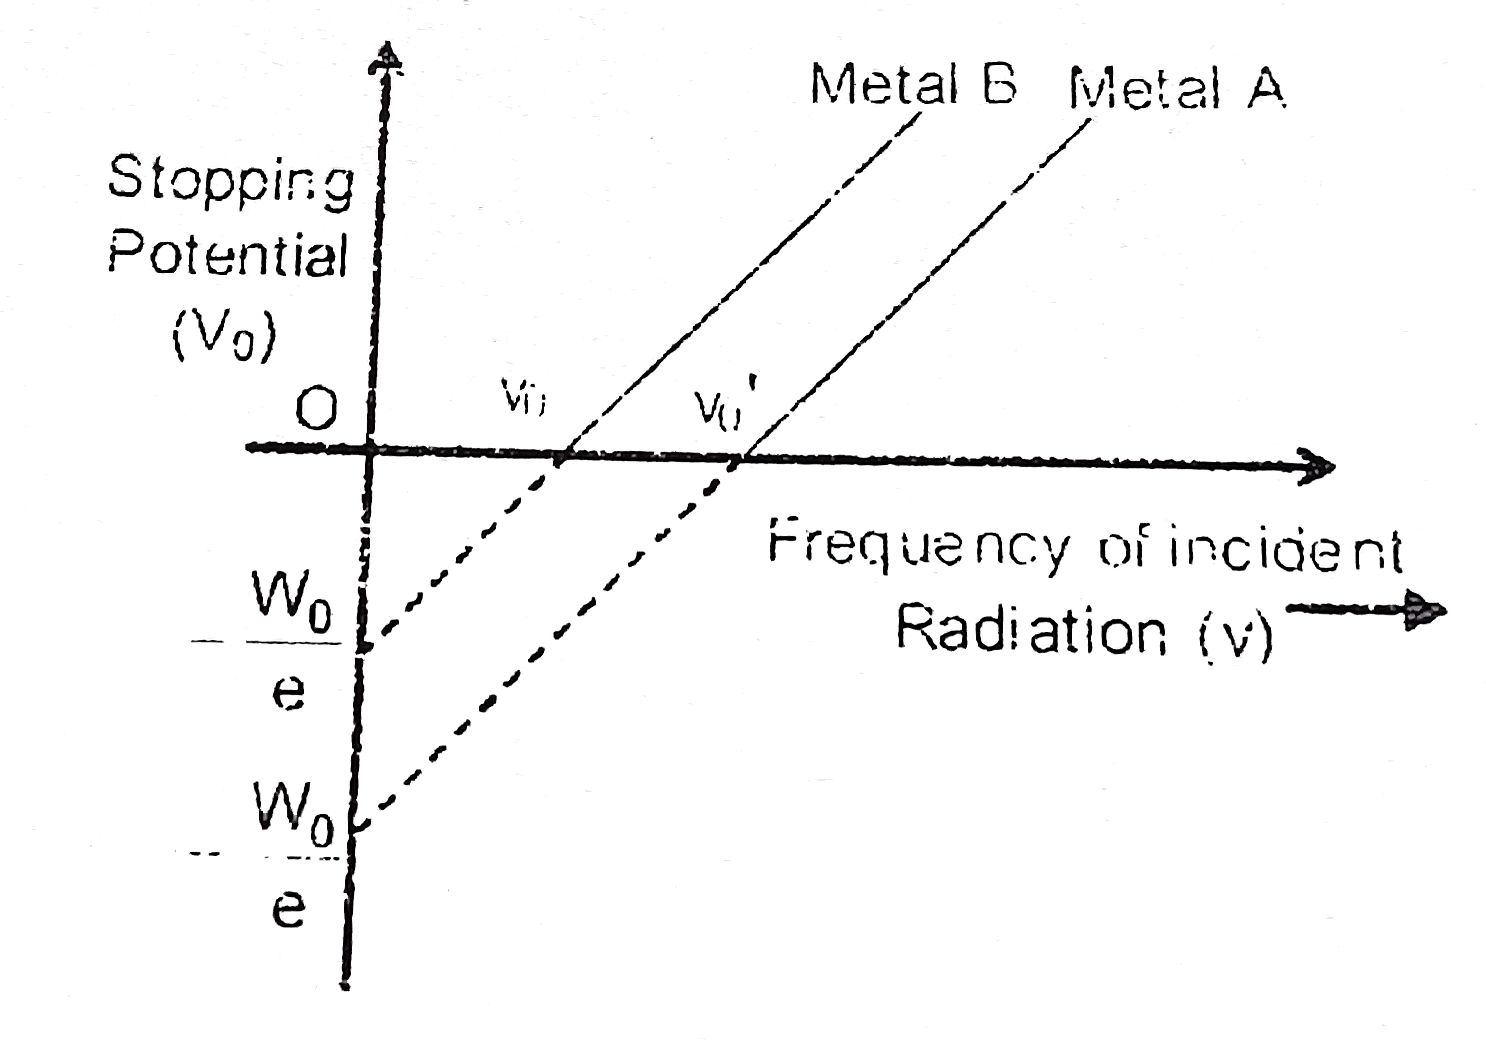
The graph shows variation of stopping potential V0 versus frequency of incident radiation v for two photosensitive metals A and B. Which of two metals has higher threshold frequency and why?

View SolutionSketch the graphs, showing the variation of stopping potential Vs with frequency v of the incident radiations for two photosensitive materials A and B having threshold frequencies v0>v'0 respectively.
(i) which of the two metals A or B has higher work function?
(ii) What information do you get from the slope of the graphs?
(iii) What does the value of the intercept of graph A on the potential axis represent?
View SolutionPlot a graph showing variation of stopping potential (V0) with the frequency (v) of the incident radiation for a given photosensitive material. Hence, state the significance of the threshold frequency in photoelectric emission.
Using the principle of energy conservation, write the equation relating the energy of incident photon, threshold frequency and the maximum kinetic energy of the emitted photoelectrons.
View SolutionDraw and explain the graph showing the variation of stopping potential with frequency of incident radiation in relation to photoelectric effect.
View SolutionSketch the graphs showing variation of stopping potential with frequency of incident radiations for two photosensitive materials A and B having threshold frequencies vA>vB.
(i) In which case is the stopping materials A and B having threshold frequencies vA>VB.
(i) In which case is the stopping potential more and why?
(ii) Does the slope of the graph depend on the nature of the materials used ? Explain.
View SolutionDefine photoelectric effect. Draw a graph to show the variation of stopping potential with frequency of incident radiation on a metal plate.
View SolutionExplain giving reasons for the following:
(a) Photoelectric current in a photocell increases with the increase in the intensity of the incident radiation.
(b) The stopping potential (V0) varies linearly with the frequency (v) of the incident radiation for a given photosensitive surface with the slope remaining the same for different surfaces.
(c) Maximum kinetic energy of the photoelectrons is independent of the intensity of incident radiation.
View Solution

