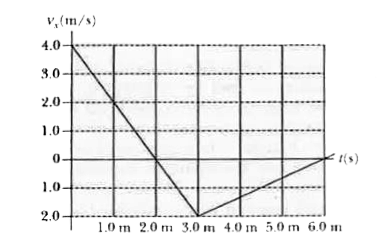
A point travels along the x axis with a velocity whose projection vx is presented as a function of time by the plot in figure.

Assuming the coordinate of the point x=0 at the moment t=0, draw the approximate time dependence plots for the acceleration wx, the x coordinate, and the distance covered s.
The correct Answer is:(##IRODV01C01E01018_S01##)
To plot x(t),s(t) and wx(t) let us partion the given plot vx(t) into five segments (for detailed analysis) as shown in the figure.
For the part oa:wx=1 and vx=t=v
Thus, Δx1(t)=∫vxdt−t∫0dt−t22−s1(t)
Putting t=1, we get, Δx1=s=12unit
For the part ab:
wx=O and νx=ν=constant=1
Thus Δx2(t)=∫vxdt=t∫1dt=(t−1)=s2(t)
Putting t=3, Δx2=s2=2units
For the part b4:wx=1 and vx=1−(t−3)=4−t)=v
Thus Δx3(t)=t∫3(4−t)dt=4t−t22−152=s3(t)
Putting t=4,Δx3=x3=12unit
For the part 4d:vx=−1 and vx=−(1−4)=4−1
So, v=|vx|=t−4 for t>4
Thus Δx4(t)=t∫4(1−t)dt=4t−t22−8
Putting t=6,Δx4=−1
Similarly s4(t)=∫|vx|dt=t∫4(t−4)dt=t22−4t+8
Putting t=6,s4=2unit
For the part d7:wx=2 and vx=−2+2(t−6)=2(t−7)
v=|vx|=2(7−t) for t←7
Now, Δx(t)=6∫t2(t−7)dt=t2−14t+48
Putting t=4, Δx5=−1
Similarly s5(t)=6∫t2(7−t)dt=14t−t2−48
Putting t=7,s5=1
On the basis of these obtained expressions wx(t),x(t) and s(t) plots can be easily plotted as shown in the figure of answersheet.

Topper's Solved these Questions
- PHYSICAL FUNDAMENTALS OF MECHANICSBOOK - IE IRODOV, LA SENA & SS KROTOVCHAPTER - PHYSICAL FUNDAMENTALS OF MECHANICSEXERCISE - The Fundamental Equation Of Dynamics
59 Videos
- PHYSICAL FUNDAMENTALS OF MECHANICSBOOK - IE IRODOV, LA SENA & SS KROTOVCHAPTER - PHYSICAL FUNDAMENTALS OF MECHANICSEXERCISE - Laws Of Conservation Of Energy, Momentum And Angular Momentum
82 Videos
- OSCILLATIONS AND WAVESBOOK - IE IRODOV, LA SENA & SS KROTOVCHAPTER - OSCILLATIONS AND WAVESEXERCISE - Electromagnetic Waves, Radiation
36 Videos
- THERMODYNAMICS AND MOLECULAR PHYSICSBOOK - IE IRODOV, LA SENA & SS KROTOVCHAPTER - THERMODYNAMICS AND MOLECULAR PHYSICSEXERCISE - Transport Phenomena
38 Videos
Similar Questions
x-coordinate of a point is its distance from the x-axis.
View SolutionA rod AB oriented along the x axis of the reference frame K moves in the positive direction of the x axis with a constant velocity v. The point A is the forward end of the rod, and the point B its near end. Find:
(a) the proper length of the rod, if at the moment tA the coorniate of the point A is equal to xA, and at the moment tB the coordinate of the point B is equal to xB,
(b) what time interval should separate the markings of coordinates of the rod's ends in the frame K for the difference of coordinates to become equal to the proper length of the rod.
View Solution
Knowledge Check
vx is the velocity of a particle moving along the x-axis as shown in the figure. If x=2.0m at t=1.0s, what is the position of the particle at t=6.0s ?
 A−2.0 mB+2.0 mC+1.0 mD−1.0 m
The distance of any point from the x-axis is called the x-coordinate.
View SolutionDraw the graph of the polynomial f(x)=2x-<5 Also, find the coordinates of the point where it crosses x-axis
View SolutionFind the coordinates of a point on x+y+3=0, whose distance from x+2y+2=0 is √5.
View SolutionThe velocity of a particle moving in the positive direction of the x axis varies as v=α√x, where α is a positive constant. Assuming that at the moment t=0 the particle was located at the point x=0, find:
(a) the time dependence of the velocity and the acceleration of the particle,
(b) the mean velocity of the particle averaged over the time that the particle takes to cover the first s metres of the path.
View SolutionAt the moment t=0 a particle leaves the origin and moves in the positive direction of the x-axis. Its velocity varies with time as v=v0(1−t/τ), where v0 is the initial velocity vector whose modulus equals v0=10.0cm/s, τ=5.0s. Find:
(a) the x coordinate of the particle at the moments of time 6.0, 10, and 20s,
(b) the moments of time when the particles is at the distance 10.0cm from the origion,
(c) the distance s covered by the particle during the first 4.0 and 8.0s, draw the approximate plot s(t).
View SolutionA radius vector of a point A relative to the origin varies with time t as r=ati−bt2j, where a and b are positive constants, and I and j are the unit vectors of the x and y axes. Find:
(a) the equation of the point's trajectory y(x), plot this function,
(b) the time dependence of the velocity v and acceleration w vectors, as well as of the moduli of these quantities,
(c) the time dependence of the angle α between the vectors w and v,
(d) the mean velocity vector averaged over the first t seconds of motion, and the modulus of this vector.
View SolutionA point moves with decleration along the circle of radius R so that at any moment of time its tangential and normal accelerations
are equal in moduli. At the initial moment t=0 the velocity of the point equals v0. Find:
(a) the velocity of the point as a function of time and as a function of the distance covered s1,
(b) the total acceleration of the point as a function of velocity and the distance covered.
View Solution
