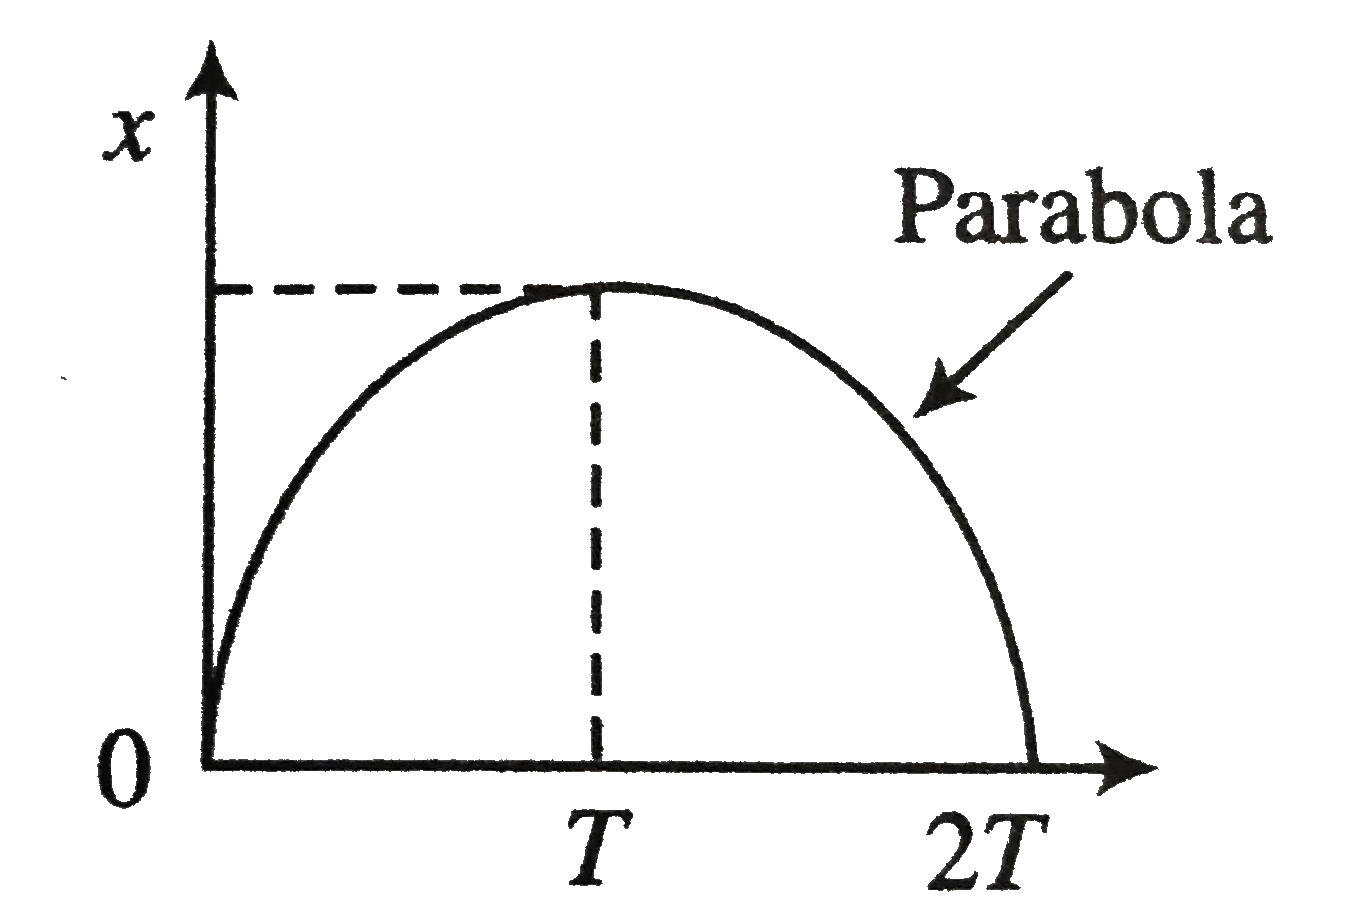
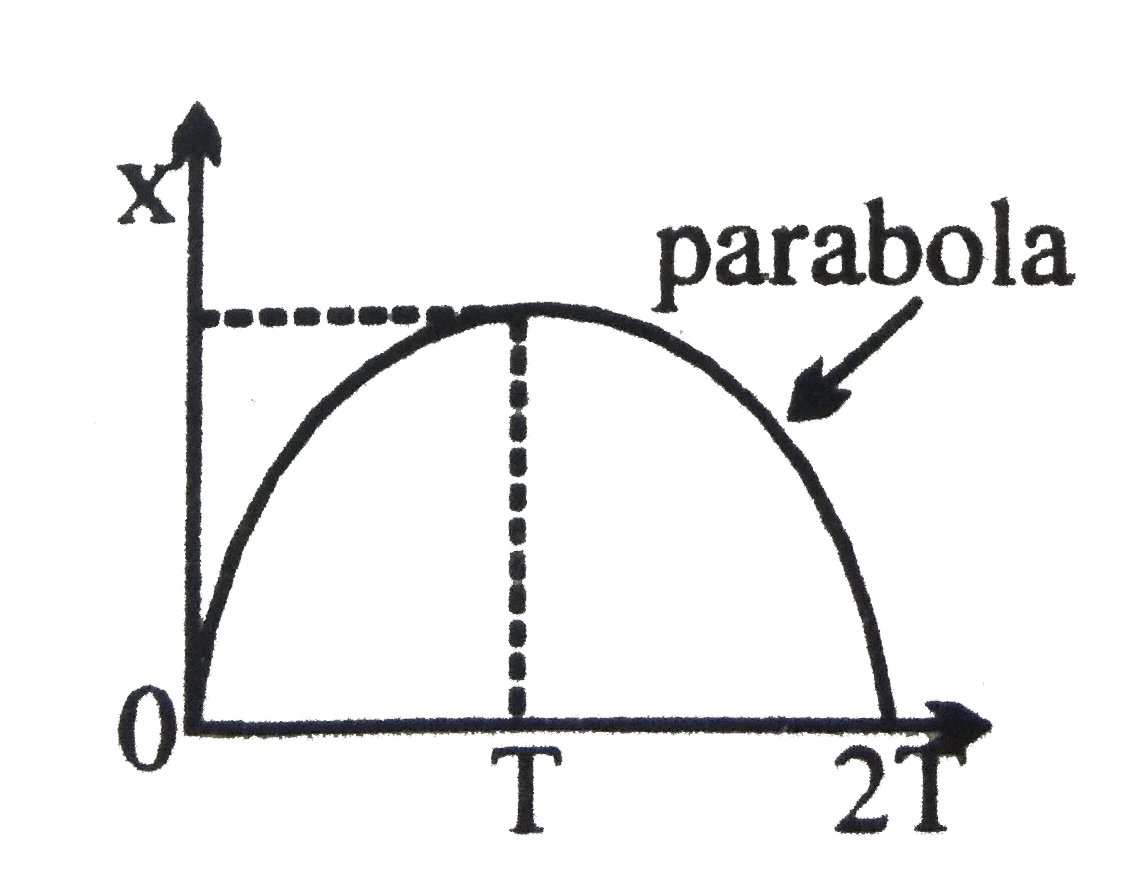
The x−t graph of particle moving along a straight line is shown in figure
Suppose a player hits serval baseballs. Which baseball will in the air for the longest time?
A
The one with farthest range
B
The one which reaches maximum hieght
C
The one with the greatest initial velocity
D
The one leaving the bat at 45∘ with respect to the ground
Video Solution
Text Solution
The correct Answer is:B
H=uy22g,T=2uyg
So greater maxium hieght, greater time of flight
|
Similar Questions
Knowledge Check
Suppose a player hits several baseballs. Which baseball will be in the air for the longest time ?
AThe one with the farthest rangeBThe one which reaches maximum heightCThe one with the greatest initial velocityDThe one leaving the bat at 45∘ with respect to the groundDisplacement time graph of a particle moving in a straight line is a shown in figure.
 Ain region A acceleration is positiveBin region B acceleration is negativeCin region C acceleration is positiveDin region D acceleration is negative
The velocity-time plot for a particle moving on a straight line is shown in figure.
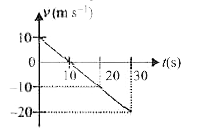 AThe particle has a constant acceleration.BThe particle has never tumed around.CThe particle has zero displacement.DThe average speed in the interval 0 to 10 s is the same as the average speed in the interval 10s to 20 s.
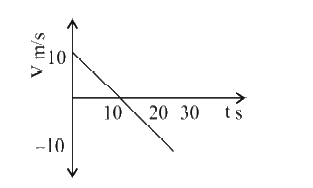
The velocity- time plot for a particle moving on a straight line is shown in the figure
View SolutionThe x−t graph of particle moving along a straight line is shown in figure
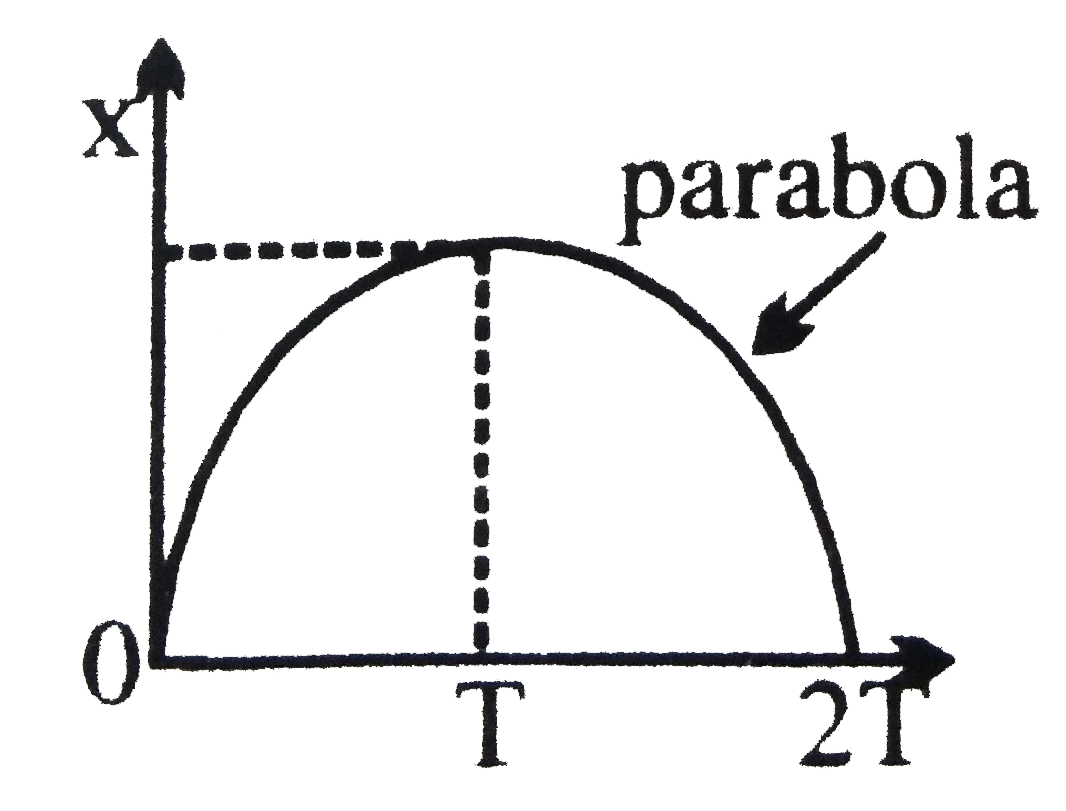
The a−t graph of the particle is correctly shown by
View SolutionThe x−t graph of particle moving along a straight line is shown in figure
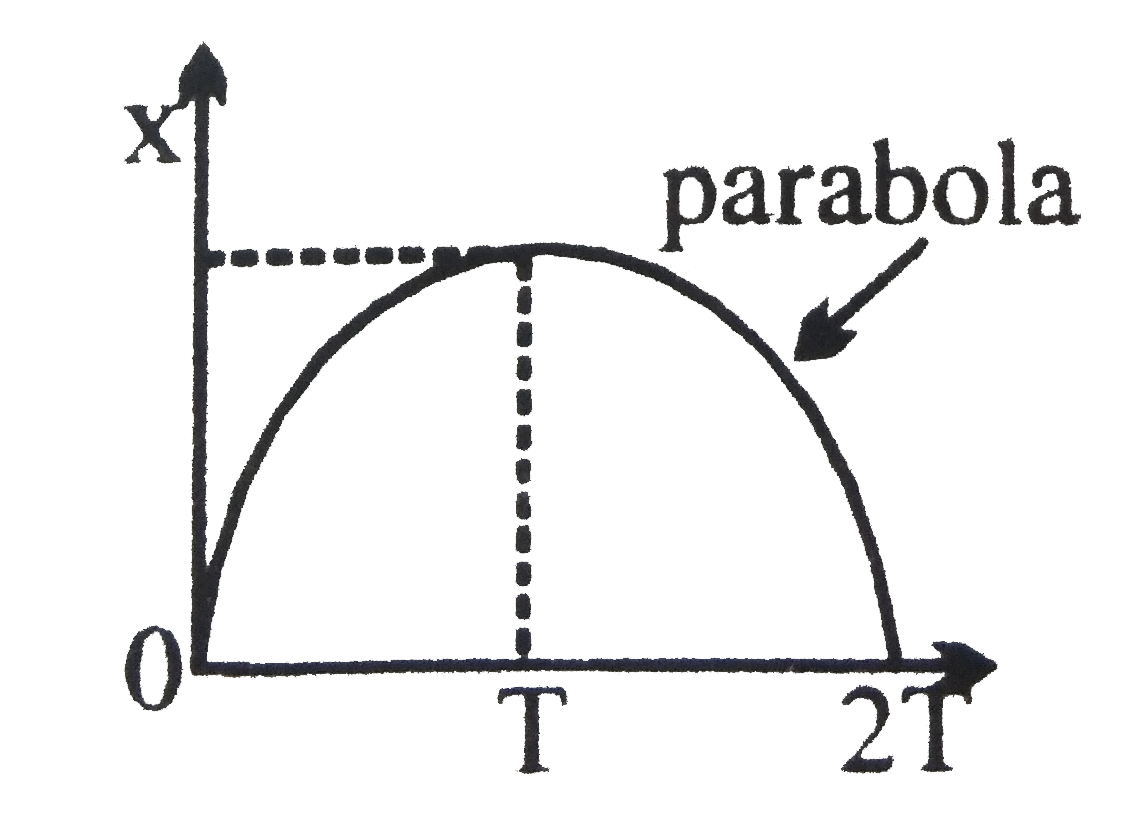
The v−t graph of the particles is correctly shown by
View SolutionVelocity displacement graph of a particle moving in a straight line is as shown in figure.

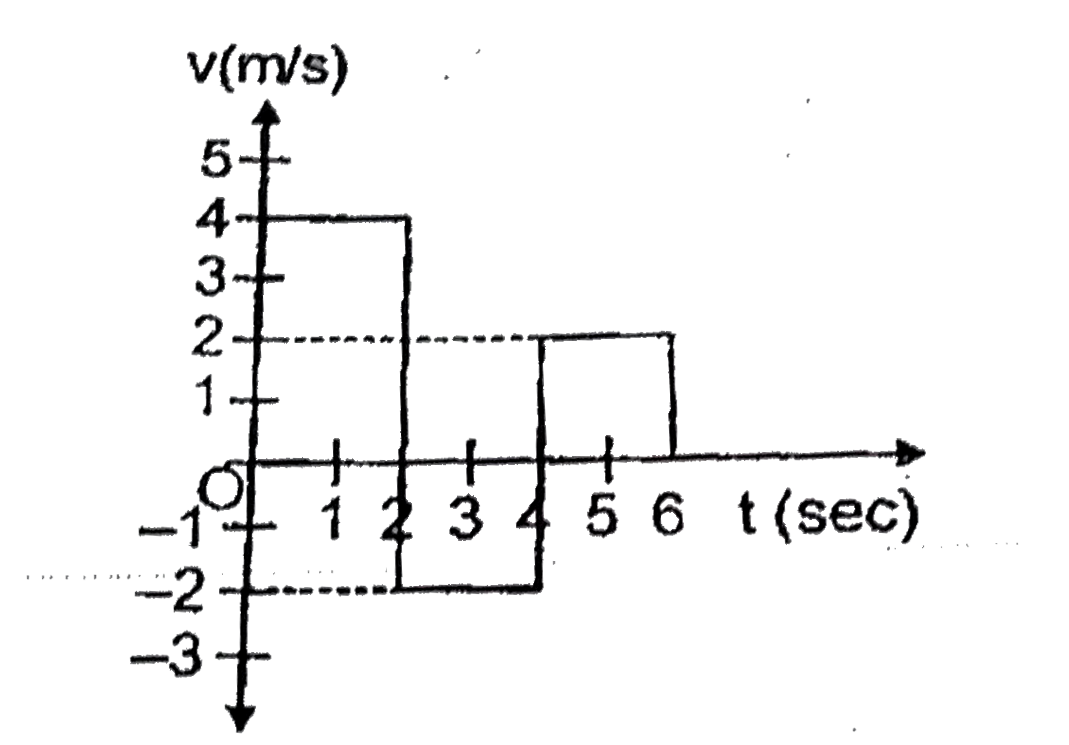
View SolutionThe velocity-time graph of a body moving in a straight line is shown in the figure.
View Solution
