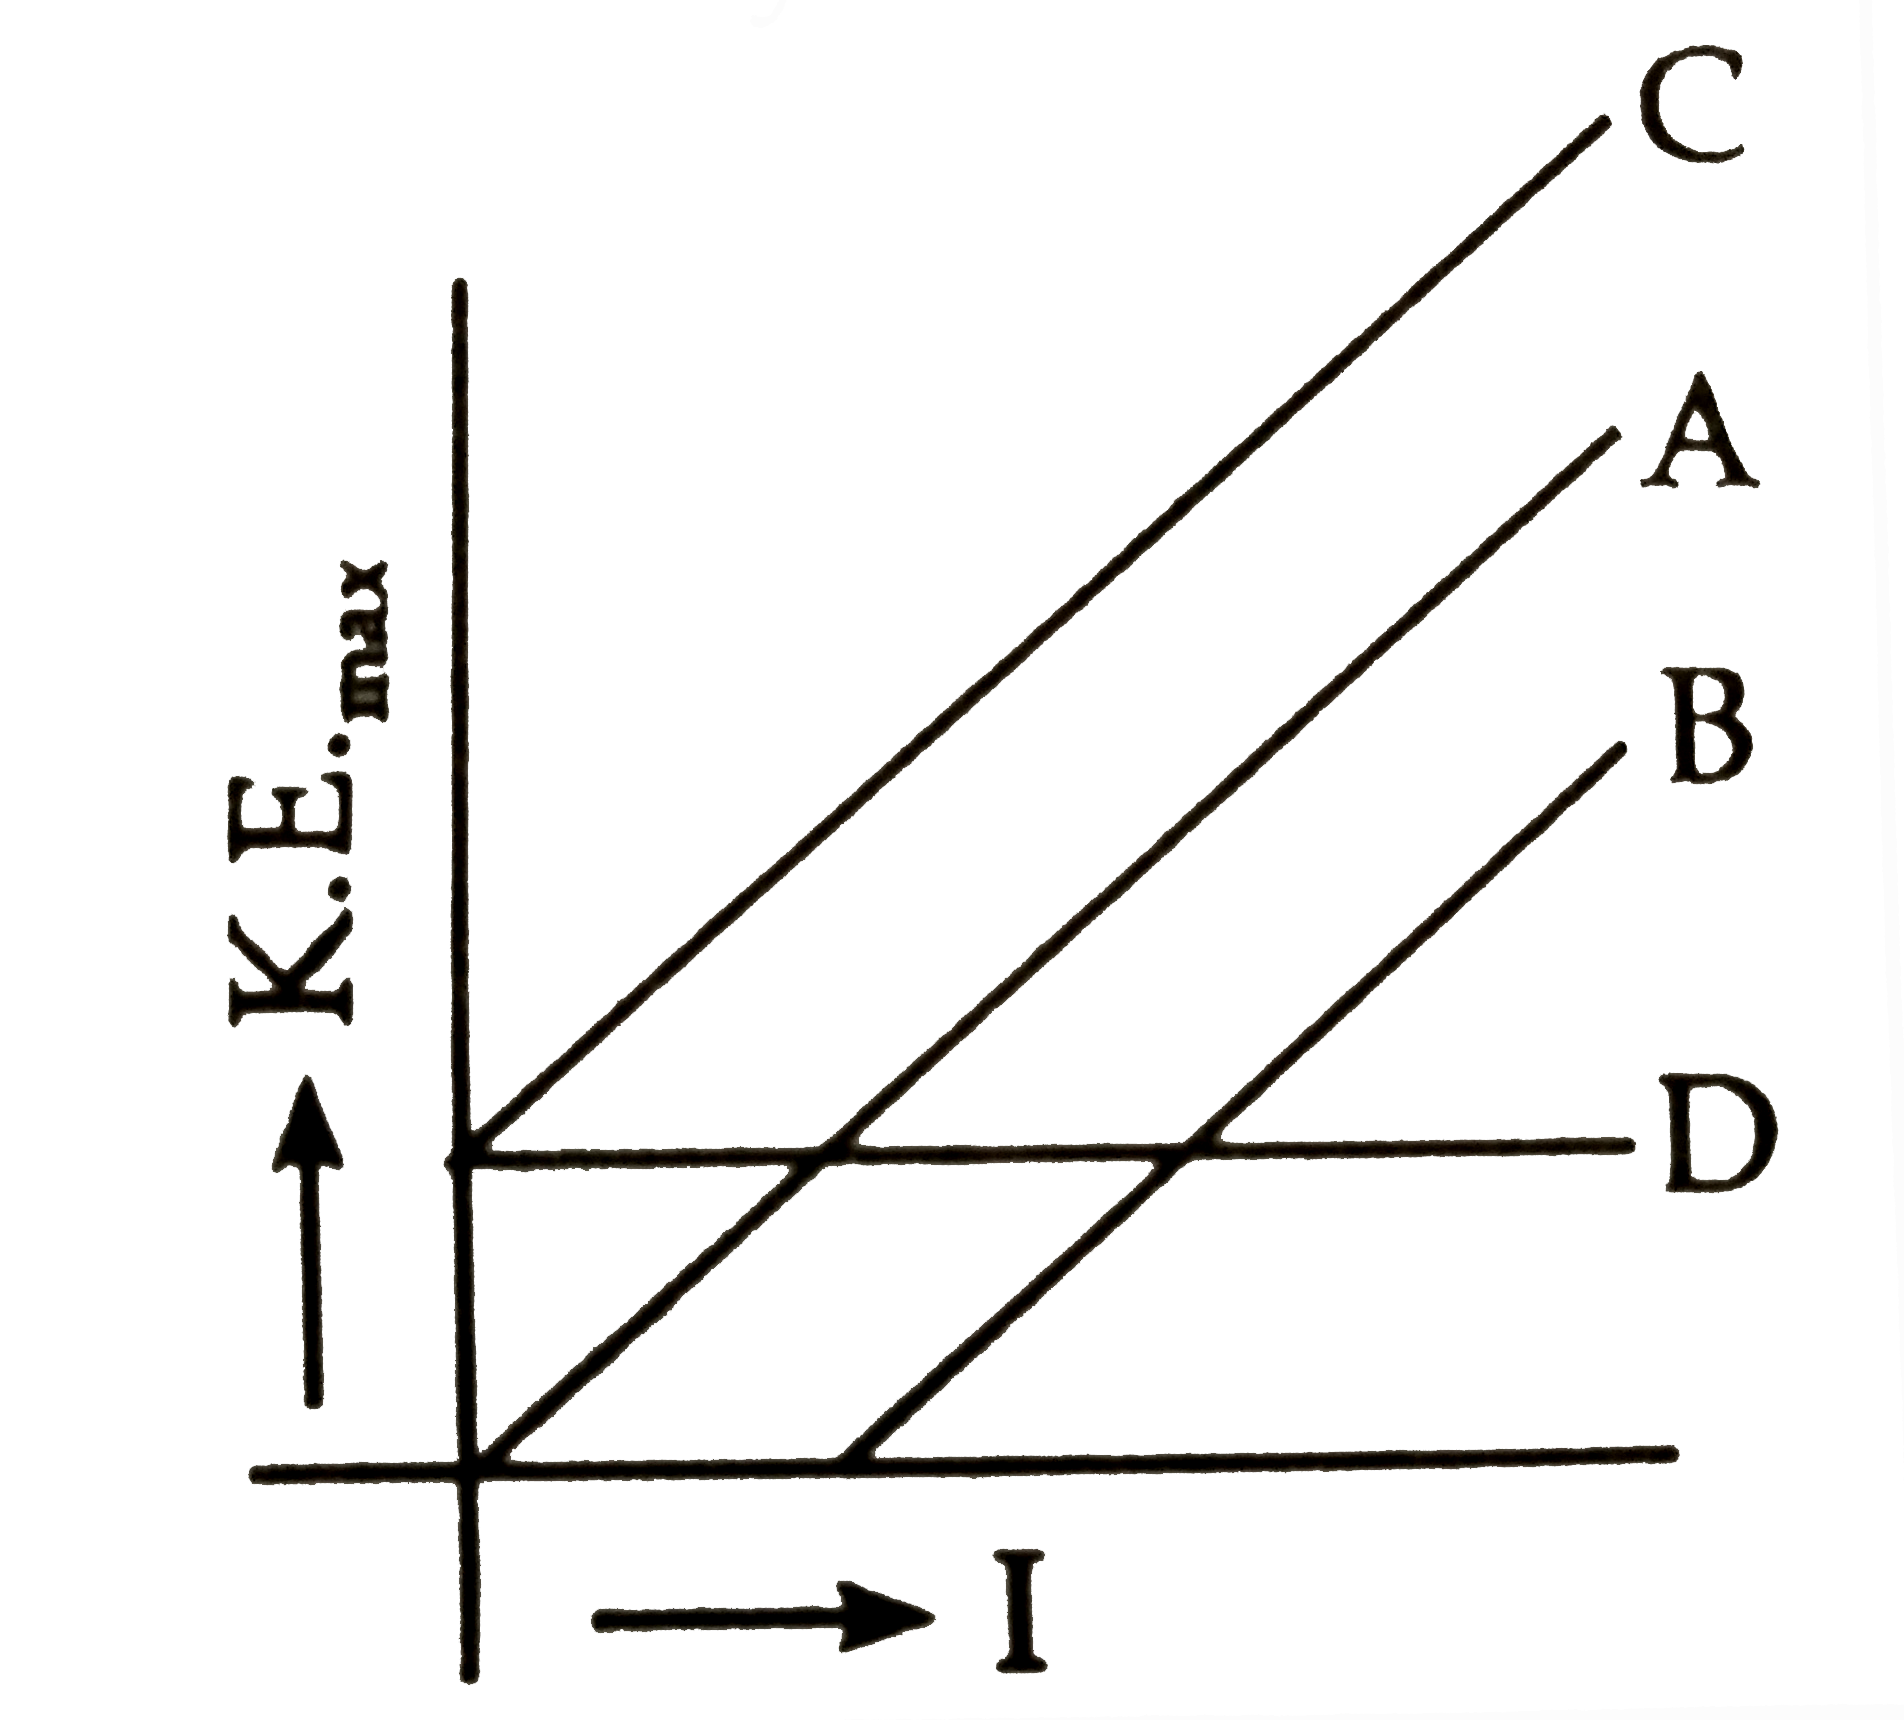
Which of the following graphs shows relation between maximum K.E. and intensity I of incident light of photocell ?

B
D
A
C
The correct Answer is:B
Step by step video & image solution for Which of the following graphs shows relation between maximum K.E. and intensity I of incident light of photocell ? by Physics experts to help you in doubts & scoring excellent marks in Class 12 exams.
Updated on:21/07/2023Topper's Solved these Questions
Similar Questions
Knowledge Check
Lother Meyer drew a graph showing the relation between
Aatomic number and atomic weightBatomic number and atomic sizeCatomic weight and atomic volumeDatomic weight and atomic sizeLother Meyer drew a graph showing the relation between
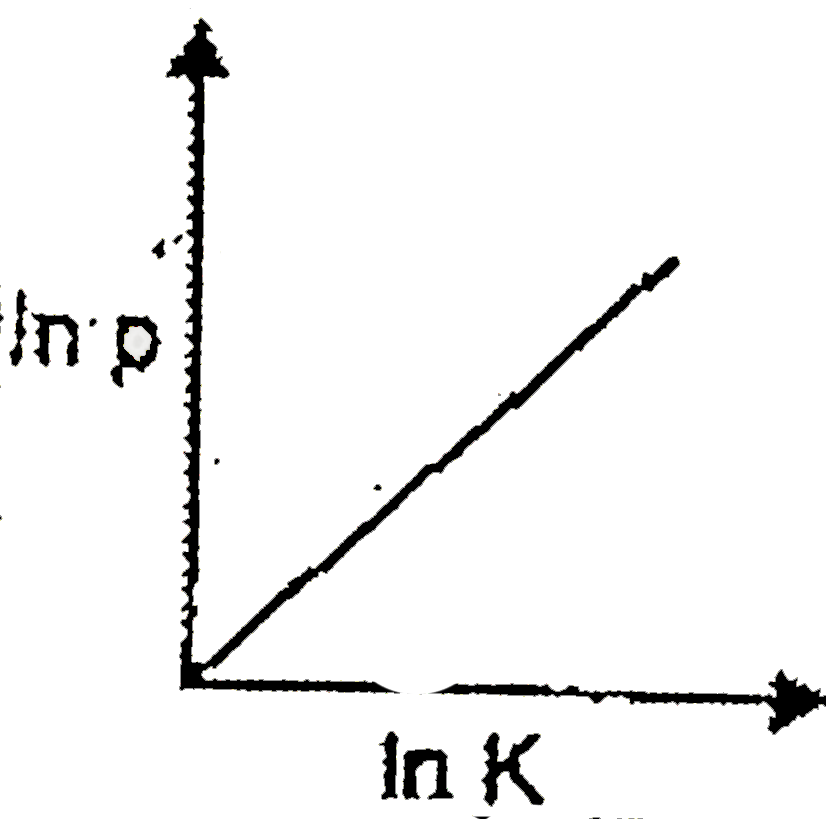
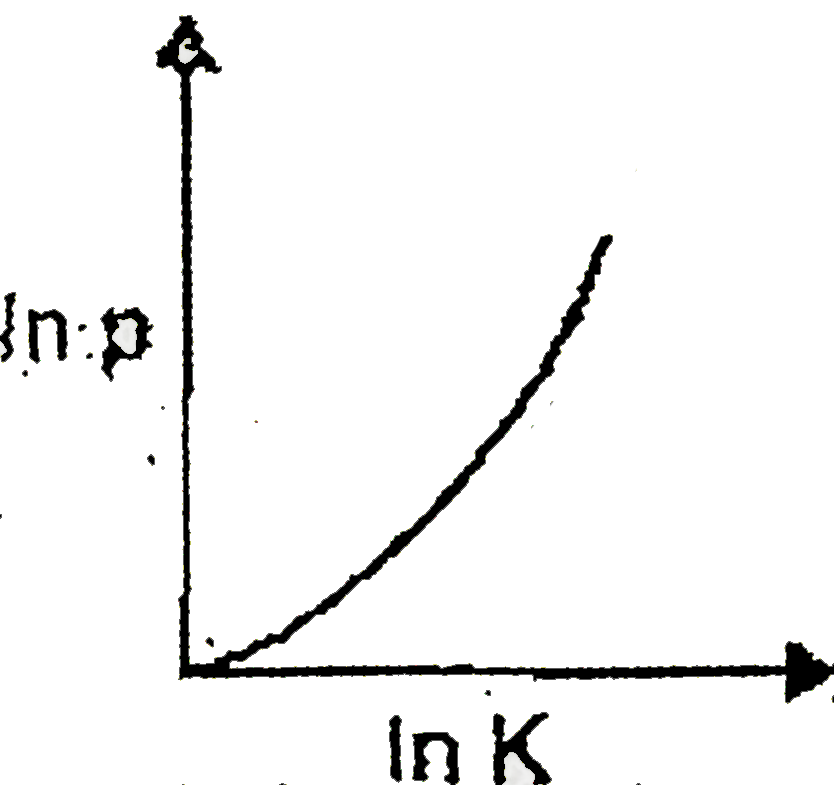
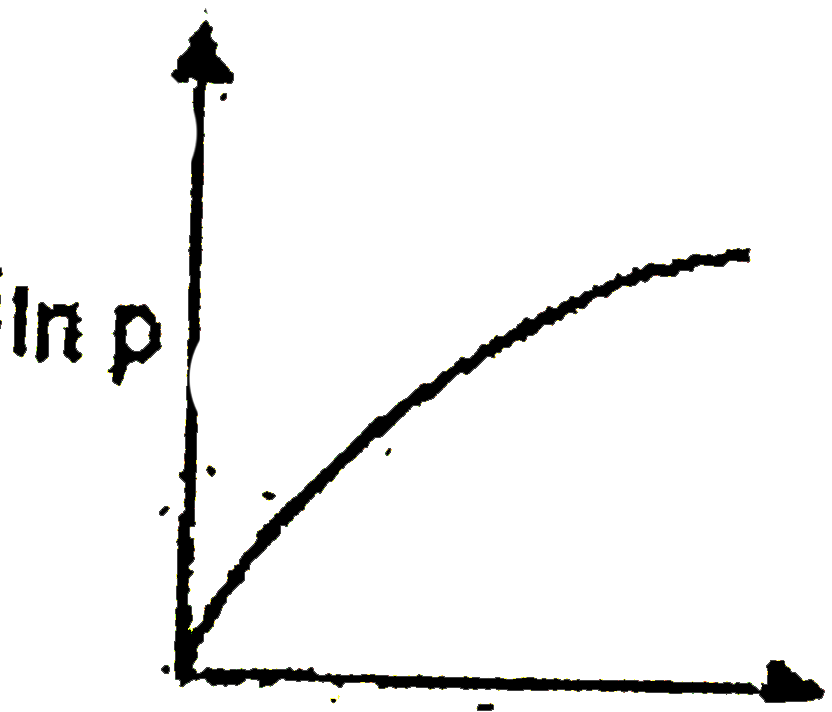
Aatomic number and atomic weightBatomic number and atomic sizeCatomic weight and atomic volumeDatomic weight and atomic sizeWhich of the following graphs represents the graphical relation between momentum (p) and kinetic energy (K) for a body in motion?
A B
B C
C DNone
DNone
Which of the following graphs correctly gives the relationship between the rate of photosynthesis and light intensity
View SolutionWhich of the following quantities related to a lens does not depend on the wavelength of the incident light?
View SolutionWhich of the following is the graph between the frequency (v) of the incident radiations and the stopping potential ?
View SolutionThe graph between stopping potential and intensity of light in photoelectric effect is
View SolutionThe correct curve between the stopping potential (V) and intensity of incident light (I) is
View Solution
