If the rate of emission of radiation by a body at temperature TK is E then graph between log E and log T will be .
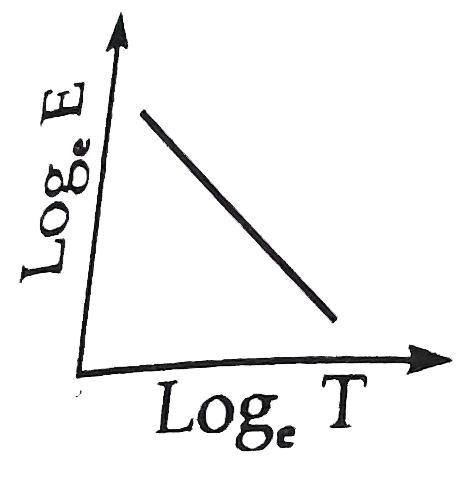
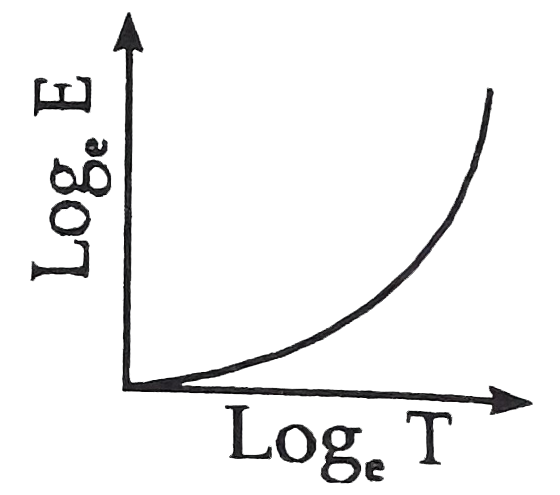
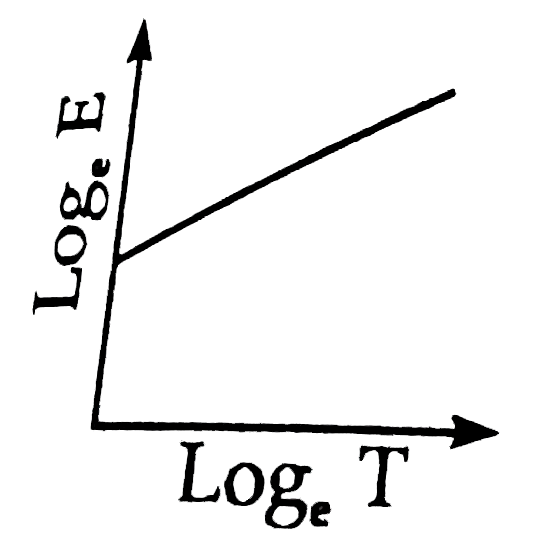
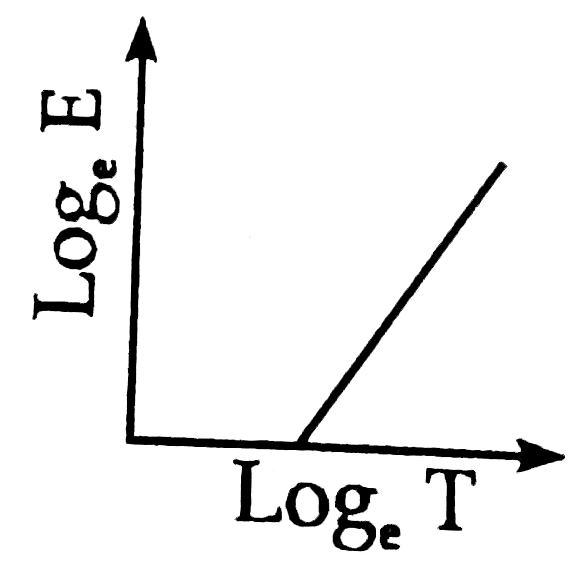
The correct Answer is:C
Step by step video, text & image solution for If the rate of emission of radiation by a body at temperature TK is E then graph between log E and log T will be . by Physics experts to help you in doubts & scoring excellent marks in Class 12 exams.
Updated on:21/07/2023Topper's Solved these Questions
- KINETIC THEORY OF GASES & RADIATION Book:NIKITA PUBLICATIONChapter:KINETIC THEORY OF GASES & RADIATION Exercise:MCQs (Newtons Law of Cooling)
Explore 40 Videos
- KINETIC THEORY OF GASES & RADIATION Book:NIKITA PUBLICATIONChapter:KINETIC THEORY OF GASES & RADIATION Exercise:MCQs (Question Given in MHT-CET)
Explore 79 Videos
- KINETIC THEORY OF GASES & RADIATION Book:NIKITA PUBLICATIONChapter:KINETIC THEORY OF GASES & RADIATION Exercise:MCQs (Kirchhoffs law of heat radiation)
Explore 19 Videos
- INTERFERENCE AND DIFFRACTIONBook:NIKITA PUBLICATIONChapter:INTERFERENCE AND DIFFRACTIONExercise:MULTPLE CHOICE QUESTIONS
Explore 333 Videos
- MAGNETIC EFFECT OF ELECTRIC CURRENTBook:NIKITA PUBLICATIONChapter:MAGNETIC EFFECT OF ELECTRIC CURRENTExercise:MCQs (Sensitivity and accuracy of M.C.G.)
Explore 1 Video
Similar Questions
What is the type of graph between log P and log V at constant temperature?
View SolutionThe rate constant for the decomposition of N2O5 at various temperatures
is given below:

Draw a graph between ln k and 1/T and calculate the values of A and
Ea. Predict the rate constant at 30∘ and 50∘C.
View Solution
Knowledge Check
The rate of emission of radiation of a black body at 273∘C is E, then the rate of emission of raidiation of this body at 0∘C will be
AE16BE4CE8D0If the variation of rotational kinetic energy E with the angular momentum L of a body. The graph of log L and log E eill be in the form of
A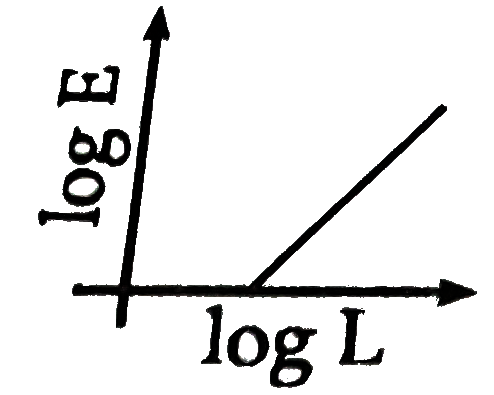 B
B C
C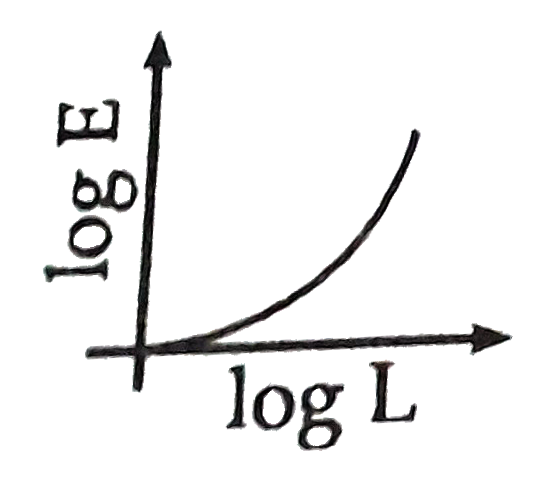 D
D
For an ideal gas, under isobaric condition, a graph between log V vs log T :
Ais linear with unit slopeBrepresents Boyle’s LawCrepresents Charle’s LawDrepresents Gay-Lussac’s Law
The graph between logk versus 1/T is a straight line.
View SolutionOn the same draw the graphs of exandlogex.
View SolutionIf E and λ represent the energy and wavelenght respectively of an electron, then the graph between log λ and log E will have
View SolutionGraph between log k and 1/T [where K is rate constant in s−1 and T is the temperature (in K) is a straight line with Hence, Ea will be

View SolutionK represents the rate constant of a reaction when log K is p lotted again st 1/T (T=temperature) the graph obtained is a
View Solution

