If E and λ represent the energy and wavelenght respectively of an electron, then the graph between log λ and log E will have
Positive slope
Negative slope
Zero slope
Infinite slope
The correct Answer is:2
To solve the problem of determining the nature of the graph between log λ (wavelength) and log E (energy) for an electron, we can follow these steps:
1. Understand the relationship between wavelength and momentum:
The de Broglie wavelength (λ) of an electron is given by the formula:
λ=hp
where h is Planck's constant and p is the momentum of the electron.
2. Express momentum in terms of kinetic energy:
The momentum p can be expressed in terms of kinetic energy (KE) as:
p=√2m⋅KE
where m is the mass of the electron.
3. Substitute the expression for momentum into the wavelength formula:
Substituting p into the wavelength equation gives:
λ=h√2m⋅KE
4. Relate kinetic energy to energy (E):
Since kinetic energy (KE) can be considered as the total energy (E) for a free electron, we can rewrite the wavelength as:
λ=h√2mE
5. Take the logarithm of both sides:
Taking the logarithm of the wavelength, we have:
logλ=logh−12log(2mE)
6. Expand the logarithm of the product:
Using the property of logarithms, we can expand this:
logλ=logh−12log(2m)−12logE
7. Rearranging the equation:
Rearranging gives:
logλ=(−12)logE+(logh−12log(2m))
This can be expressed in the form:
y=mx+c
where y=logλ, x=logE, and the slope m=−12.
8. Determine the slope:
Since the slope m is negative, the graph of log λ versus log E will have a negative slope.
Conclusion:
Thus, the graph between log λ and log E will have a negative slope.
The de Broglie wavelength (λ) of an electron is given by the formula:
λ=hp
where h is Planck's constant and p is the momentum of the electron.
The momentum p can be expressed in terms of kinetic energy (KE) as:
p=√2m⋅KE
where m is the mass of the electron.
Substituting p into the wavelength equation gives:
λ=h√2m⋅KE
Since kinetic energy (KE) can be considered as the total energy (E) for a free electron, we can rewrite the wavelength as:
λ=h√2mE
Taking the logarithm of the wavelength, we have:
logλ=logh−12log(2mE)
Using the property of logarithms, we can expand this:
logλ=logh−12log(2m)−12logE
Rearranging gives:
logλ=(−12)logE+(logh−12log(2m))
This can be expressed in the form:
y=mx+c
where y=logλ, x=logE, and the slope m=−12.
Since the slope m is negative, the graph of log λ versus log E will have a negative slope.
Thus, the graph between log λ and log E will have a negative slope.
Topper's Solved these Questions
- DUAL NATURE OF RADIATION AND MATTERBOOK - NARAYNACHAPTER - DUAL NATURE OF RADIATION AND MATTEREXERCISE - EXERCISE - 2 (H.W)
20 Videos
- DUAL NATURE OF RADIATION AND MATTERBOOK - NARAYNACHAPTER - DUAL NATURE OF RADIATION AND MATTEREXERCISE - EXERCISE - 3
35 Videos
- DUAL NATURE OF RADIATION AND MATTERBOOK - NARAYNACHAPTER - DUAL NATURE OF RADIATION AND MATTEREXERCISE - EXERCISE - 1 (H.W)
24 Videos
- CURRENT ELECTRICITYBOOK - NARAYNACHAPTER - CURRENT ELECTRICITYEXERCISE - Level 6
43 Videos
- DUAL NATUREBOOK - NARAYNACHAPTER - DUAL NATUREEXERCISE - LEVEL-II (H.W)
17 Videos
Similar Questions
Knowledge Check
If p and E represent linear momentum and kinetic energy respectively, then the graph between E and pis correctly shown by
A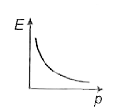 B
B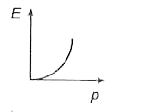 C
C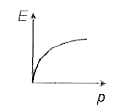 D
D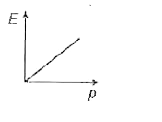
If the rate of emission of radiation by a body at temperature TK is E then graph between log E and log T will be .
A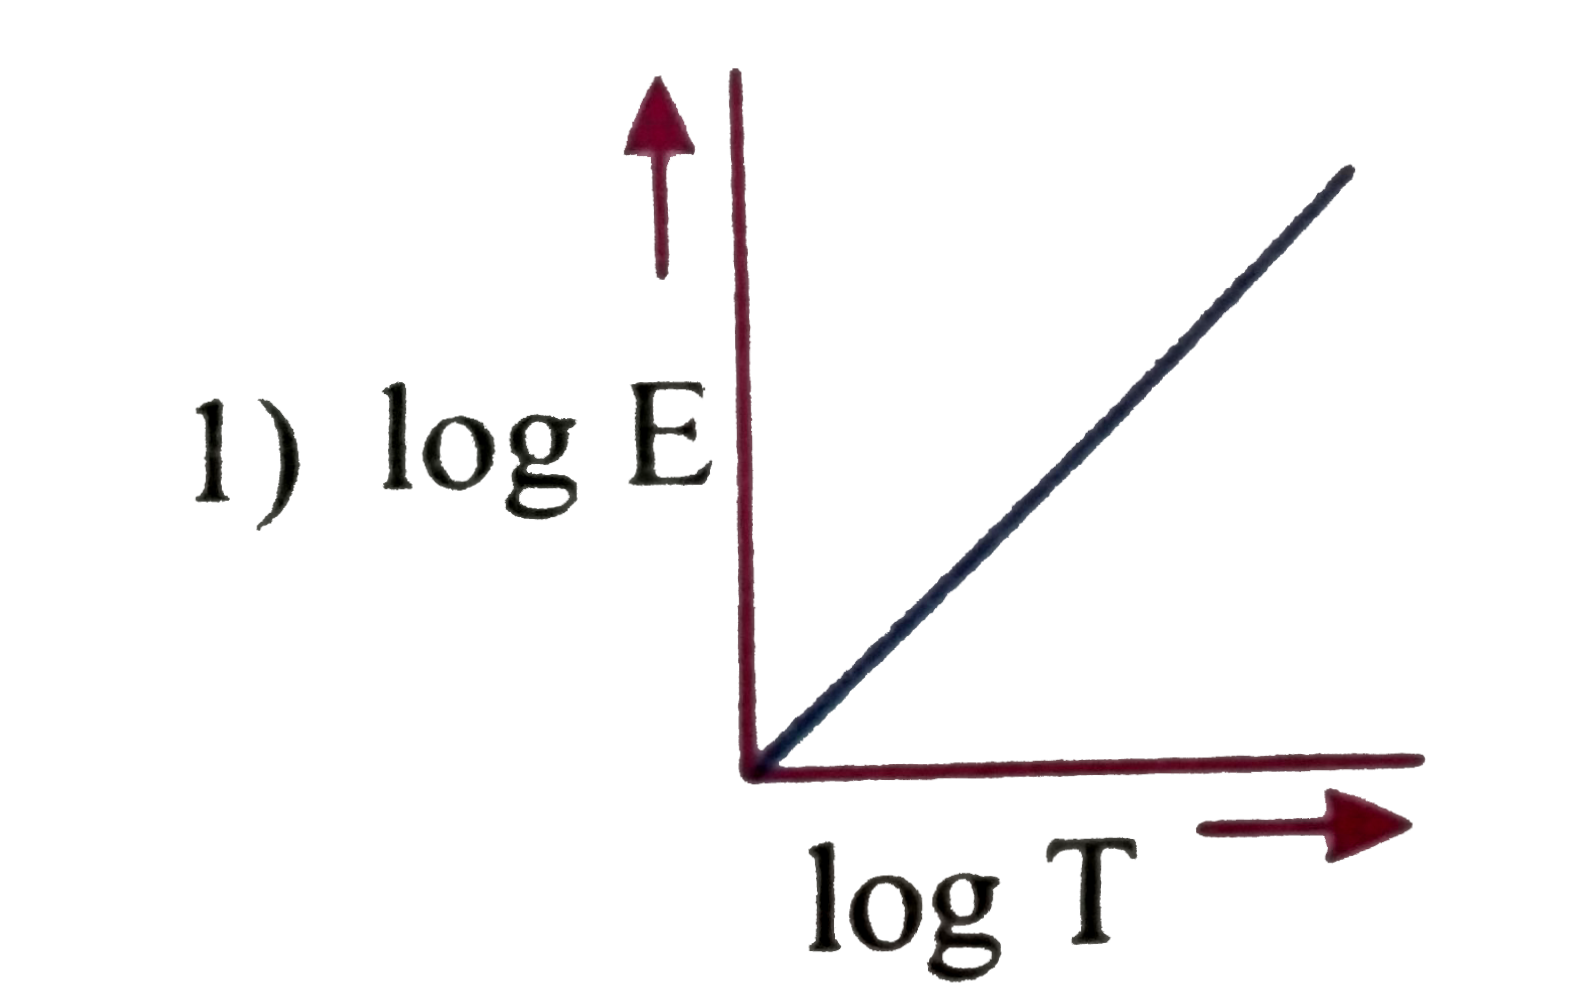 B
B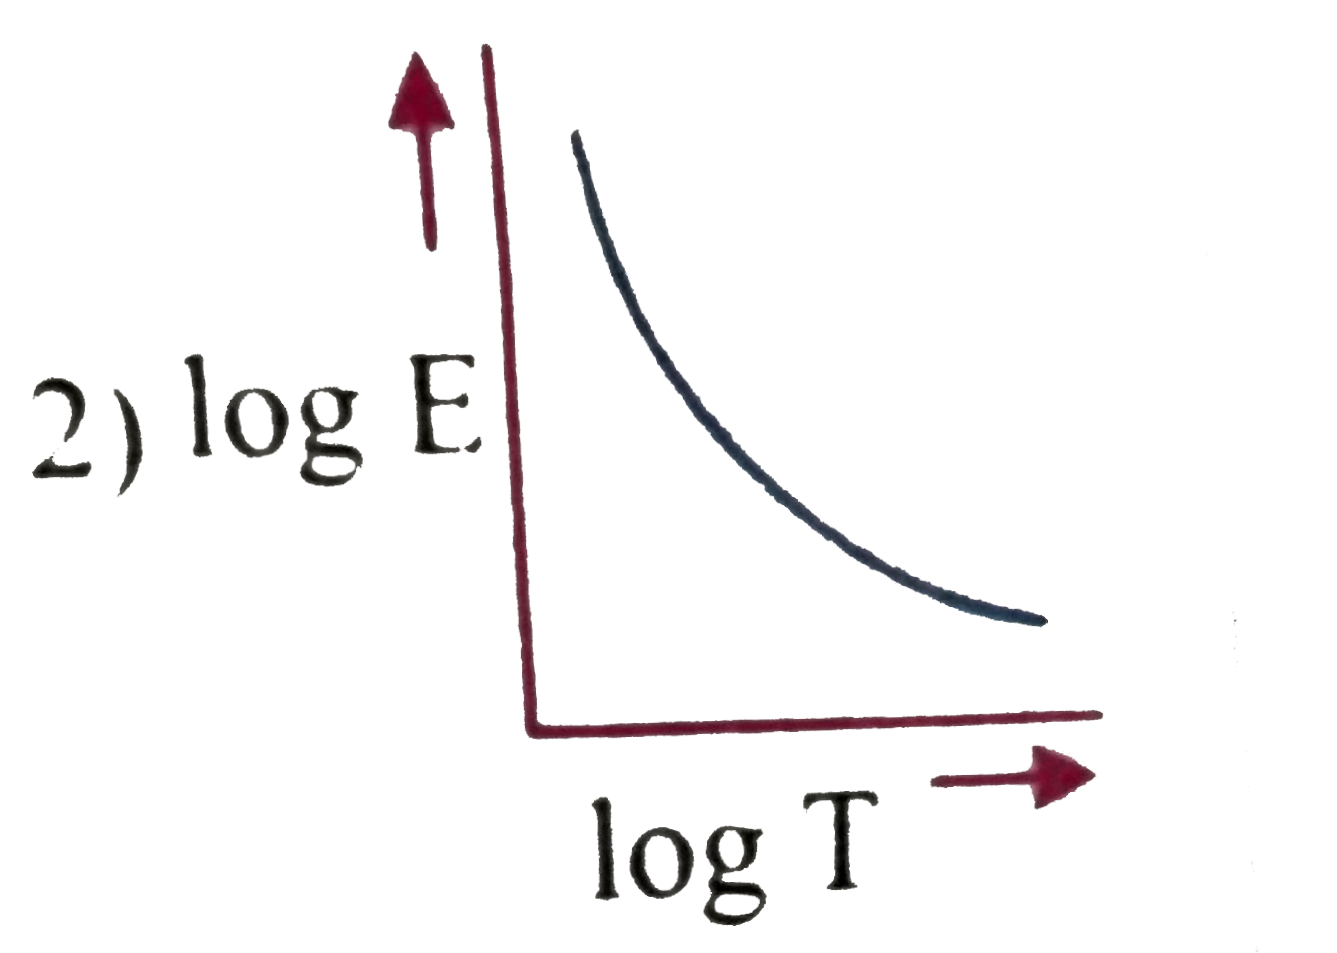 C
C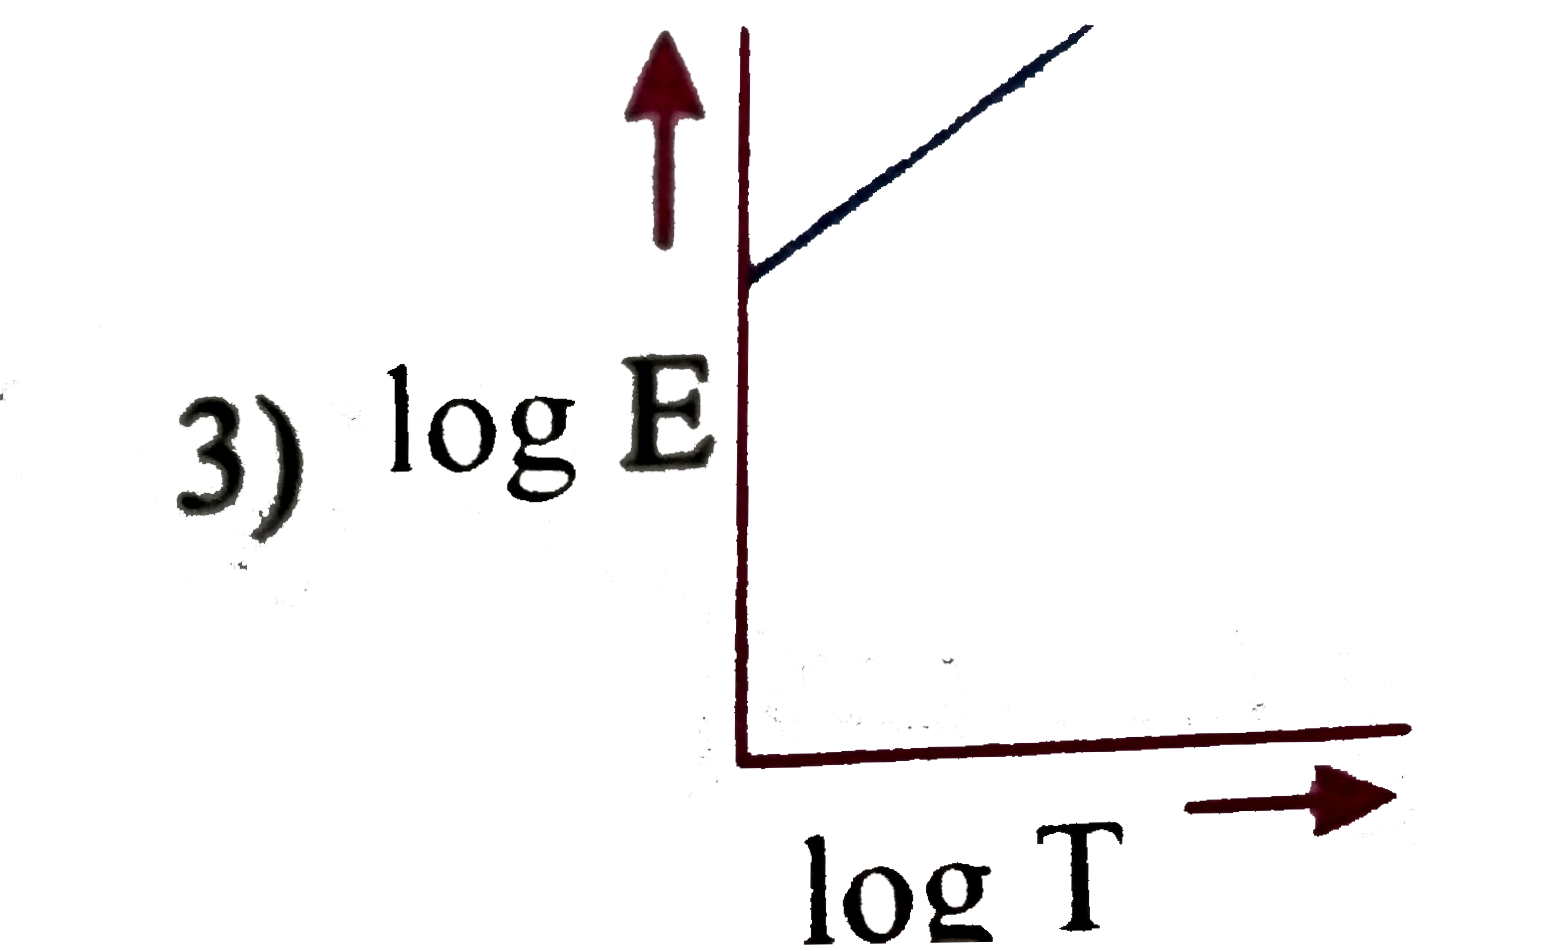 D
D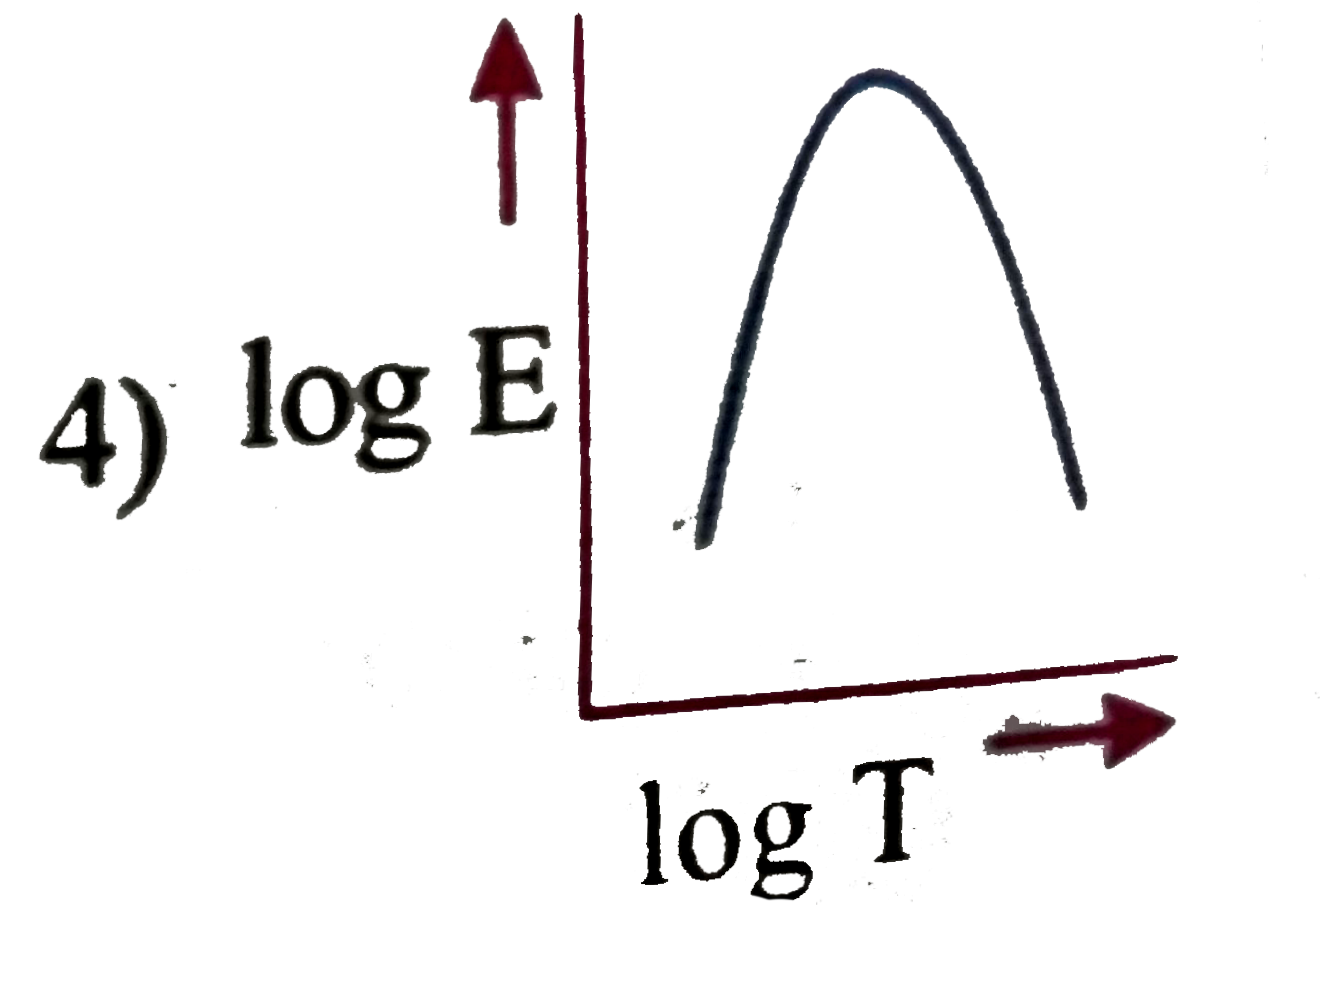
The log - log graph between the energy E of an electron and its de - Broglie wavelength λ will be
A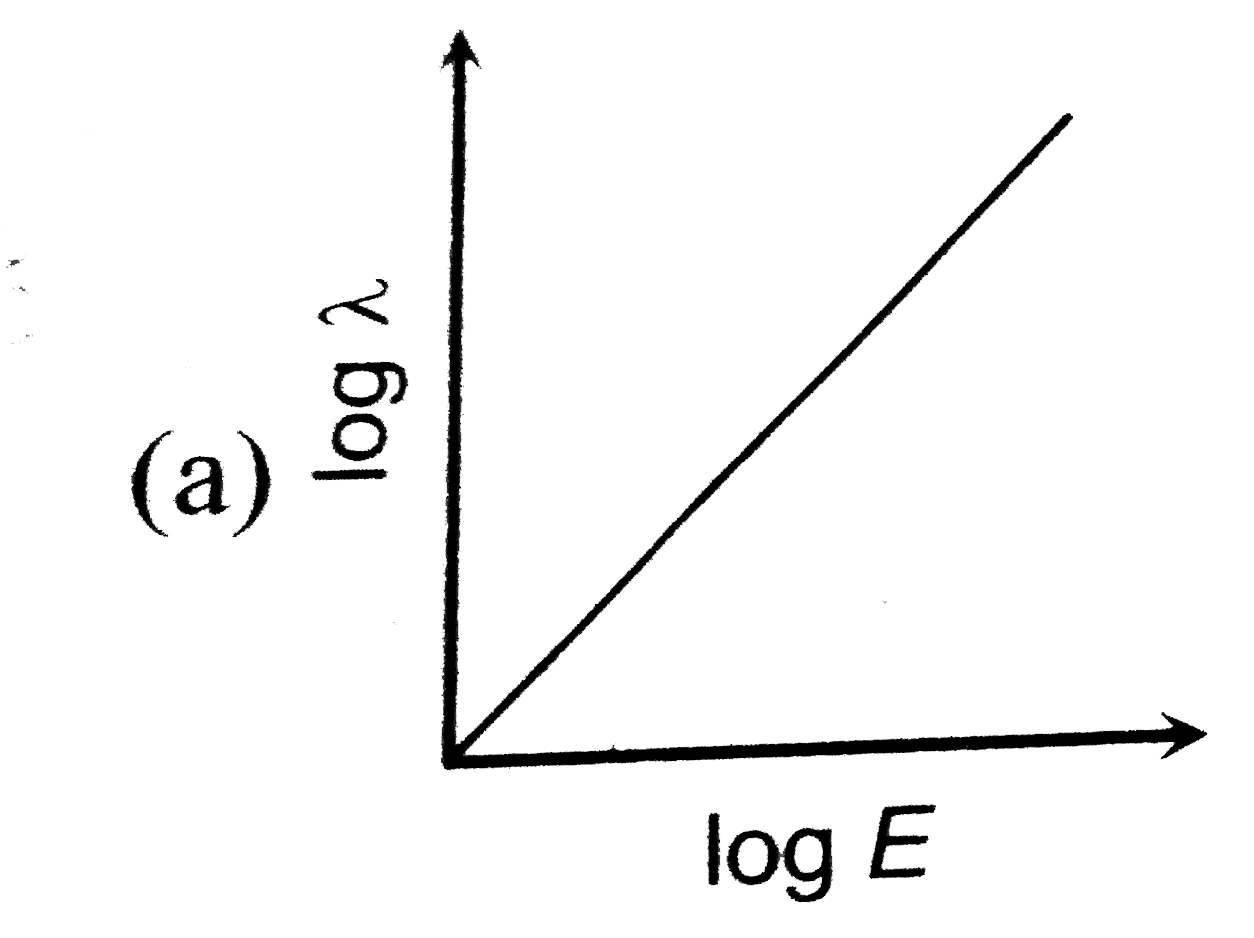 B
B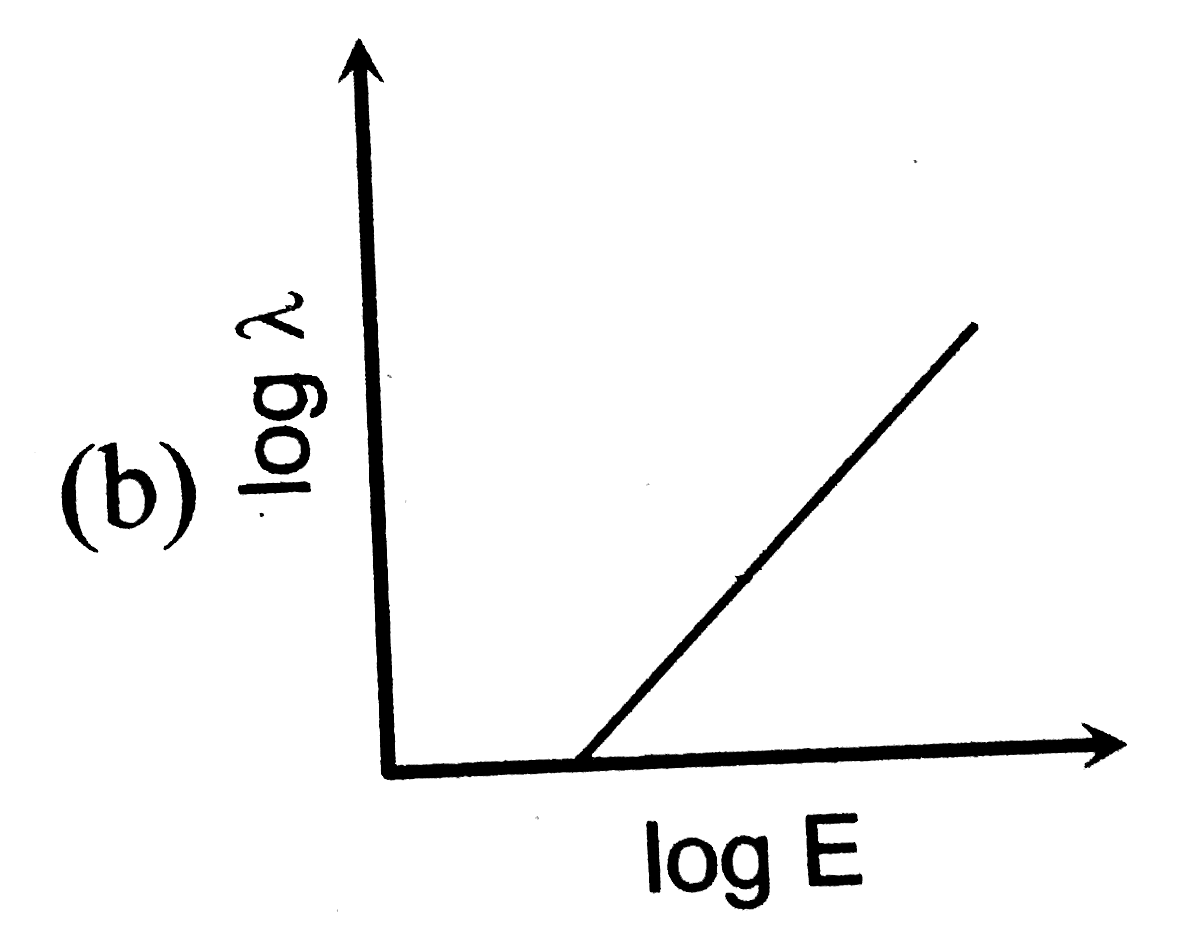 C
C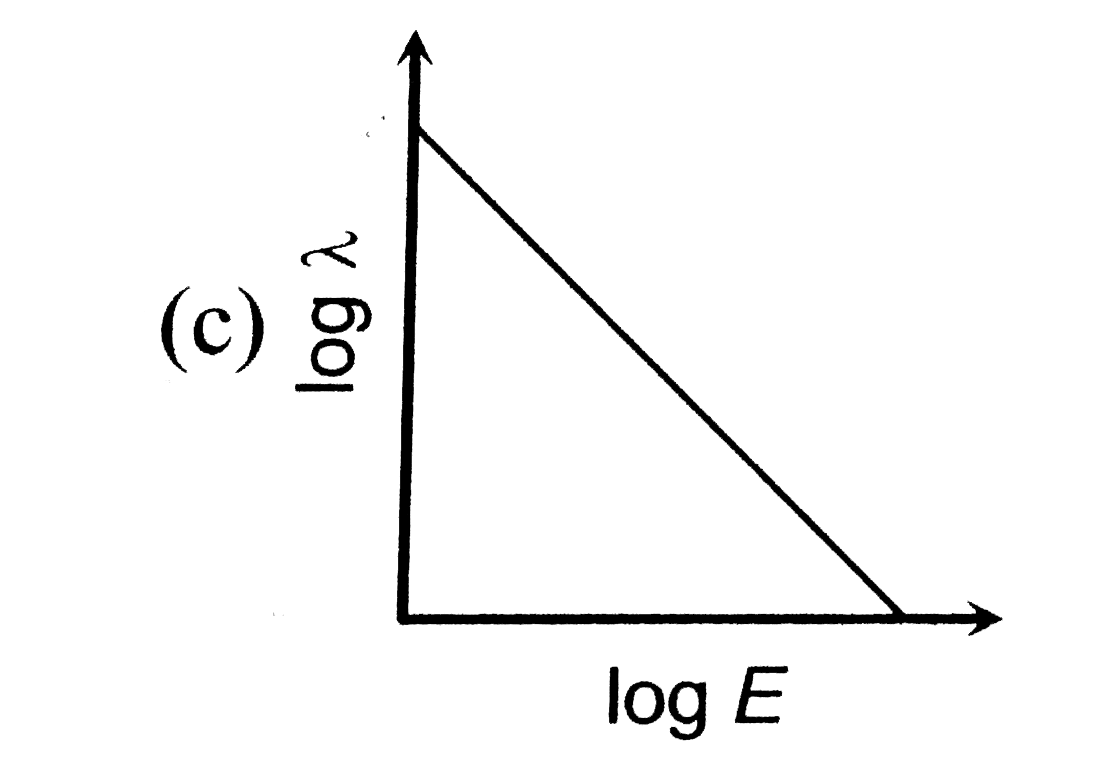 D
D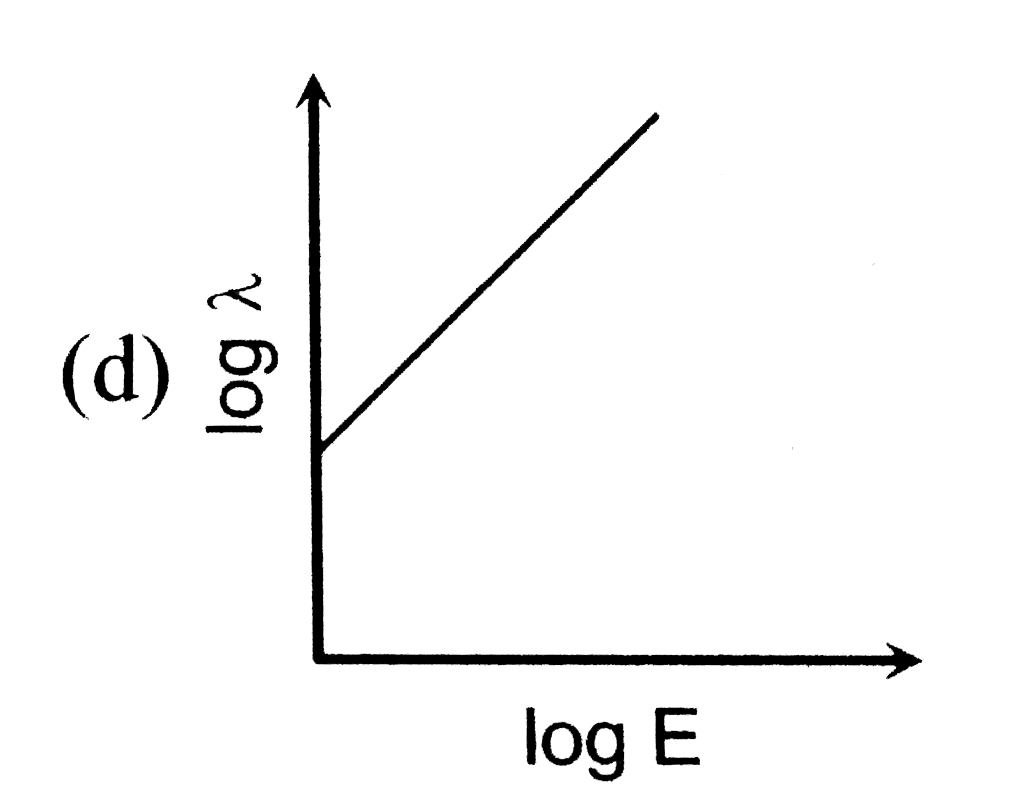
According to de-Broglie hypothesis, the wavelength associated with moving electron of mass 'm' is 'λe'. Using mass energy relation and Planck's quantum theory, the wavelength associated with photon is 'λp'. If the energy (E) of electron and photonm is same, then relation between λe and 'λp' is
View SolutionAn electron beam is acceleration by a potential difference V to hit a metallic target to produce X-rays. It produces continuous as well as characteristic X-rays. If λmin is the smallest possible wavelength of X-rays in the spectrum, the variation of logλmin with logv is correctly represented in
View SolutionA photomental is illuminated by lights of wavelenght λ1andλ2 respectively. The maximum kinetic enegies of electrons emitted in the two cases are E1andE2 respectively. The work function of metal is.
View SolutionIf the variation of rotational kinetic energy E with the angular momentum L of a body. The graph of log L and log E eill be in the form of
View SolutionAn atom emits a spectral line of wavelength λ when an electron makes a transition between levels of energy E1andE2. Which expression correctly relates λE1andE2 ?
View Solution
