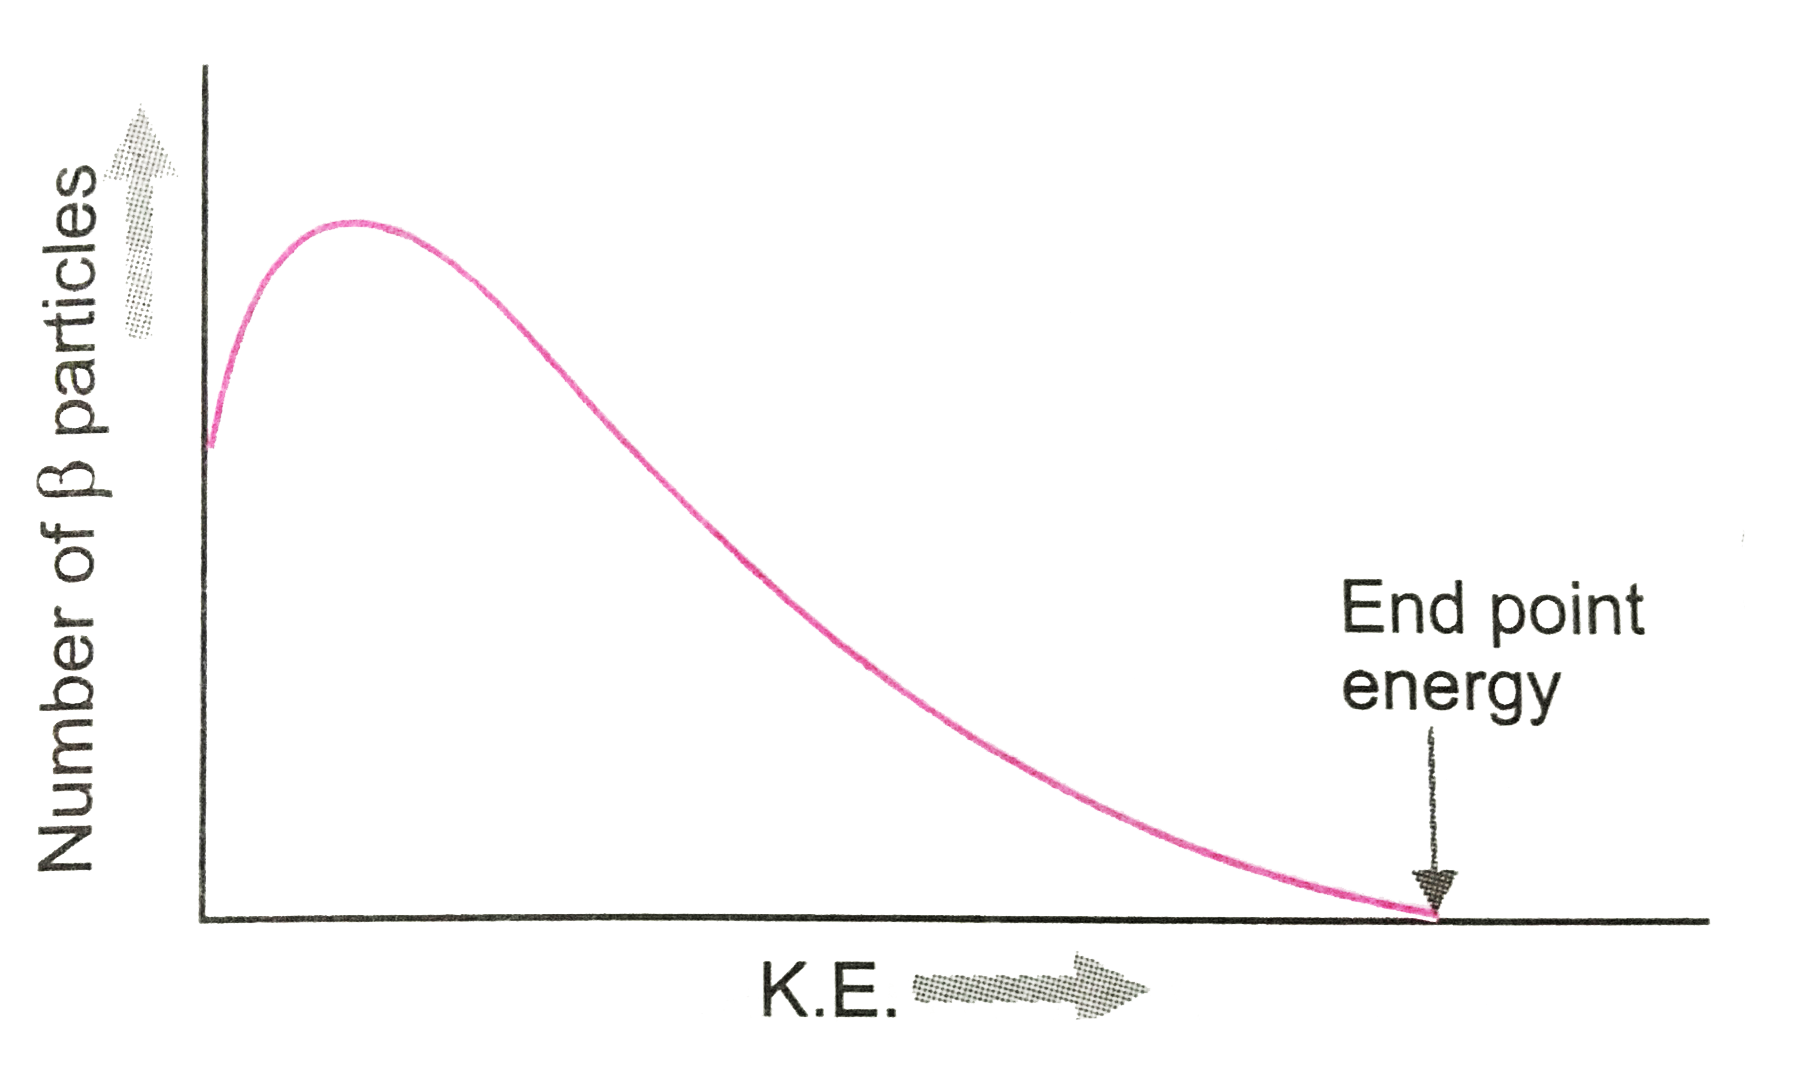
Draw the graph showing distribution of kinetic energy of electrons emitted during beta decay.
Video Solution
Text Solution
The distribution of K.E. of electrons emitted during beta decay is shown in fig.

|
Topper's Solved these Questions
- ATOMS AND NUCLEIBook:PRADEEPChapter:ATOMS AND NUCLEIExercise:(II) very short answer 16
Explore 1 Video
- ATOMS AND NUCLEIBook:PRADEEPChapter:ATOMS AND NUCLEIExercise:(I) Short Answer questions 1
Explore 1 Video
- COMMUNICATION SYSTEMSBook:PRADEEPChapter:COMMUNICATION SYSTEMSExercise:MODEL TEST PAPER-2
Explore 9 Videos
Similar Questions
Knowledge Check
During a beta decay
A(a) an atomic electron is ejectedB(b) an electron present inside the nucleus is ejectedC(c) a neutron in the nucleus decays emitting and electronD(d) a part of the binding energy is converted into electronKinetic energy of electrons emitted in photoelectric effect is
Adirectly proportional to the intensity of incident light.Binversely proportional to the intensity of incident lineCindependent of the intensity of incident light.Dindependent of the frequency of lightIn the graph showing Maxwell Boltzmann distribution of energy ................ .
Aarea under the curve must not change with increase in temperatureBarea under the curve increases with increases in temperatureCarea under the curve decreases with increase in temperatureDwith increase in temperature curve broadens and shifts to the right hand side.
Draw a graph showing the variation of decay rate with number of active nuclei.
View SolutionA nucleus 10Ne23 undergoes β- decay and becomes 11Na23 . Calculate the maximum kinetic energy of electrons emitted assuming that the daughter nucleus and antineutrino carry negligible kinetic energy. Given mass of 10Ne23 = 22.994466 u and mass of 11Na23 = 22.989770 m
View SolutionVARIATION OF BINDING ENERGY OF PER NUCLEON WITH MASS NUMBER
View SolutionThe nucleus 2310Ne decays by β− emission. Write down the β-decay equation and determine the maximum kinetic energy of the electrons emitted. Given that : m( 2310Ne)=22.994466u, and m( 2311Na)=22.089770u
View SolutionDraw a graph showing the intensity distribution of fringes due to diffraction at single slit
View Solution

