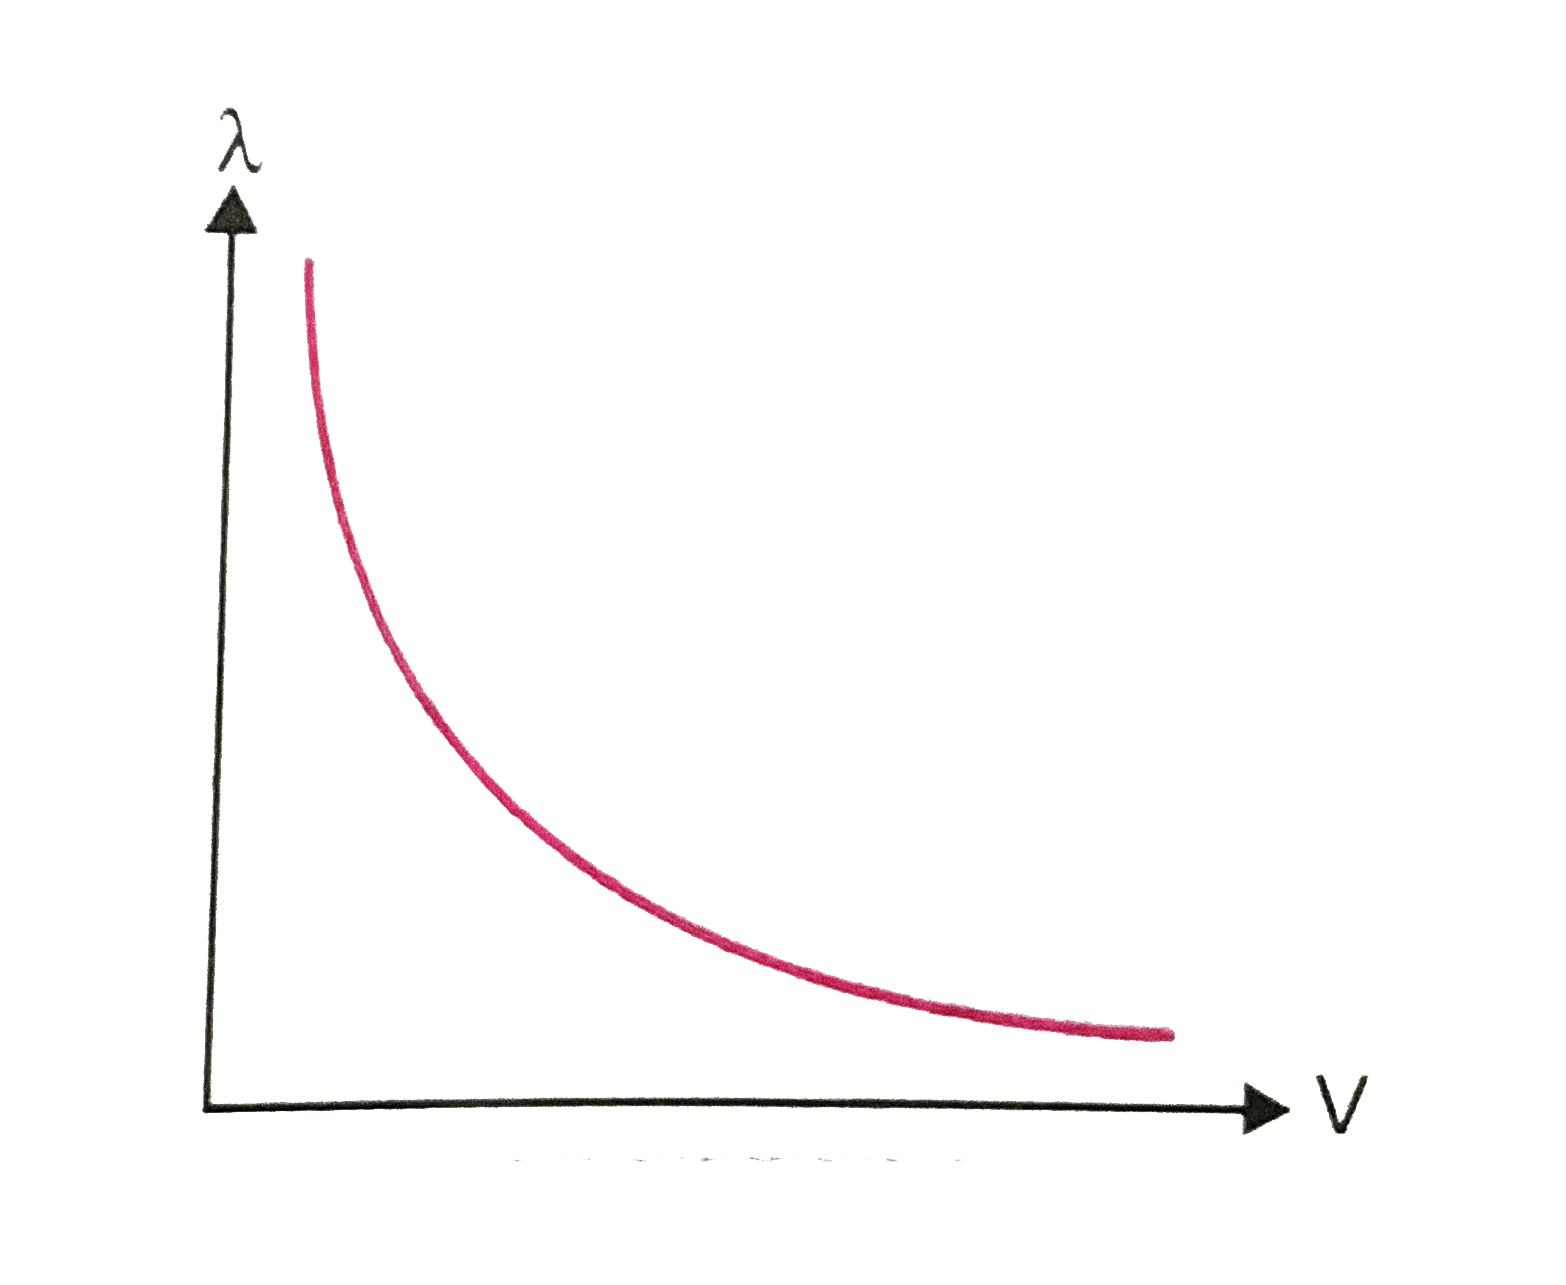
Show graphically, the variation of the de-Broglie wavelength (λ) with the potential (V) through which an electron is accelerated from rest.
We know that λ=h√2meV, so λ∝1√V The variation of V and λ will be curve as shown in Fig.
Topper's Solved these Questions
- DUAL NATURE OF RADIATION AND MATTERBook:PRADEEPChapter:DUAL NATURE OF RADIATION AND MATTERExercise:NCERT Exerciese question
Explore 1 Video
- DUAL NATURE OF RADIATION AND MATTERBook:PRADEEPChapter:DUAL NATURE OF RADIATION AND MATTERExercise:Short answer
Explore 1 Video
- CURRENT ELECTRICITYBook:PRADEEPChapter:CURRENT ELECTRICITYExercise:Problems for Practice (B)
Explore 2 Videos
- ELECTROMAGNETIC INDUCTION & ALTERNATING CURRENTBook:PRADEEPChapter:ELECTROMAGNETIC INDUCTION & ALTERNATING CURRENTExercise:Multiple Choice Questions
Explore 1 Video
Similar Questions
Knowledge Check
Which of the following graphs shows the variation of de-Broglie wavelength with potential through which a particle of charge q and mass m is accelerated ?
A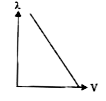 B
B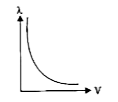 C
C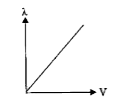 D
D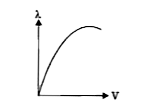
The ratio of de-Broglie wavelength associated with two electrons accelerated through 25V and 36V is
A25/36B36/25C5/6D6/5The de Broglie wavelength λ of an electron accelerated through a potential V in volts is
A1.227√VnmB0.1227√VnmC0.01227√VnmD12.27√Vnm
Find the ratio of de-Broglie wavelengths associated with two electrons accelerated through 25V and 36V.
View SolutionWhat is the de-Broglie wavelength associated with an electron moving with an electron, accelerated through a potential difference of 100 volt?
View SolutionOn the basis of the de Broglie hypothesis, obtain the expression for the de Broglie wavelength associated with an electron accelerated from rest through a p.d. V.
View SolutionWhat is the de-Broglie wavelength associated with an electron accelerated through a potential of 100V ?
View SolutionAn electrono of mass m, when accelerated through a potential difference V, has de-Broglie wavelength λ. The de-Broglie wavelength associated with a proton of mass M accelerated through the same potential difference, will be:
View Solution

