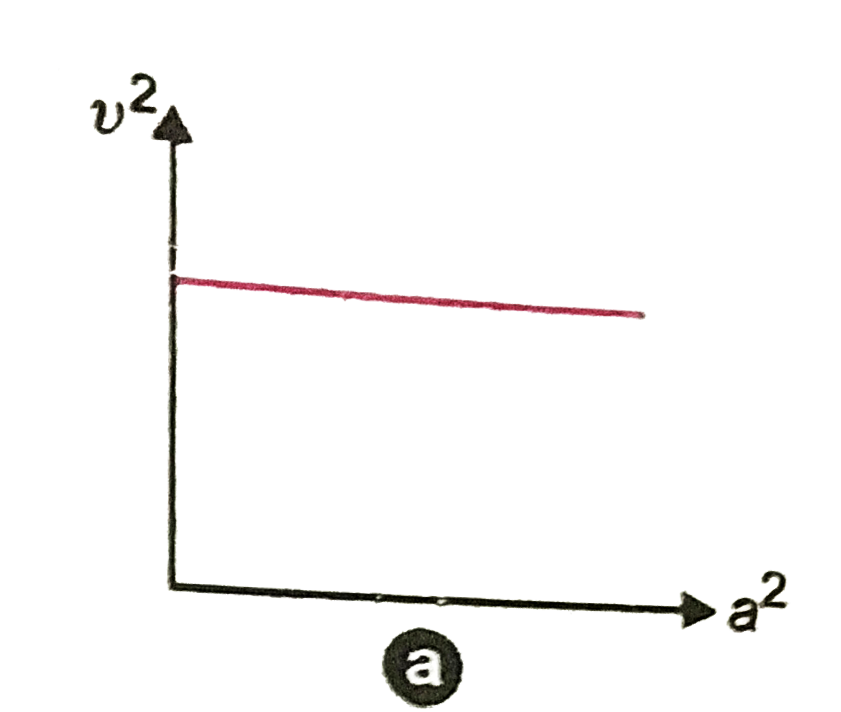
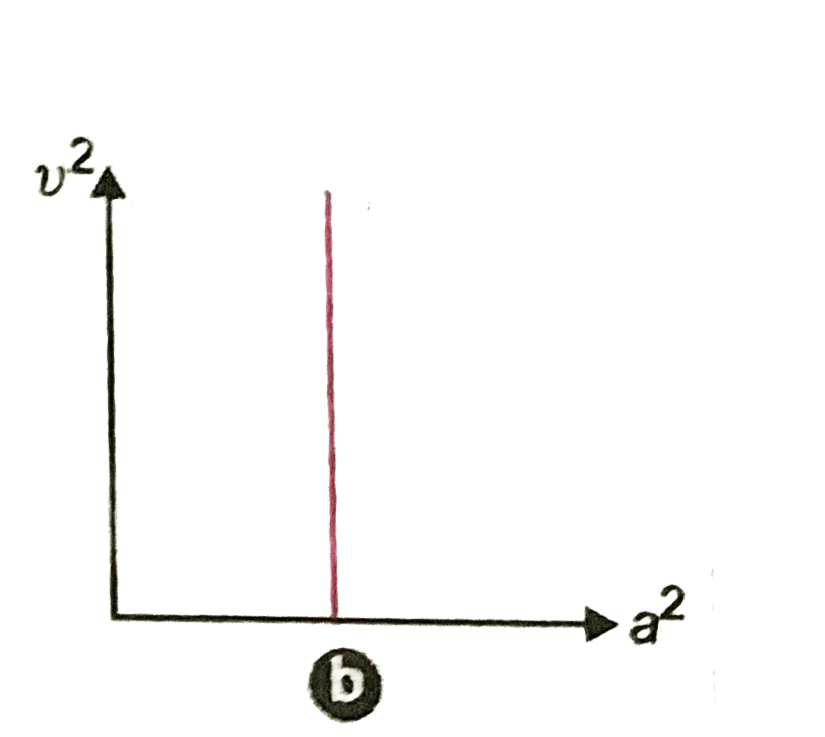
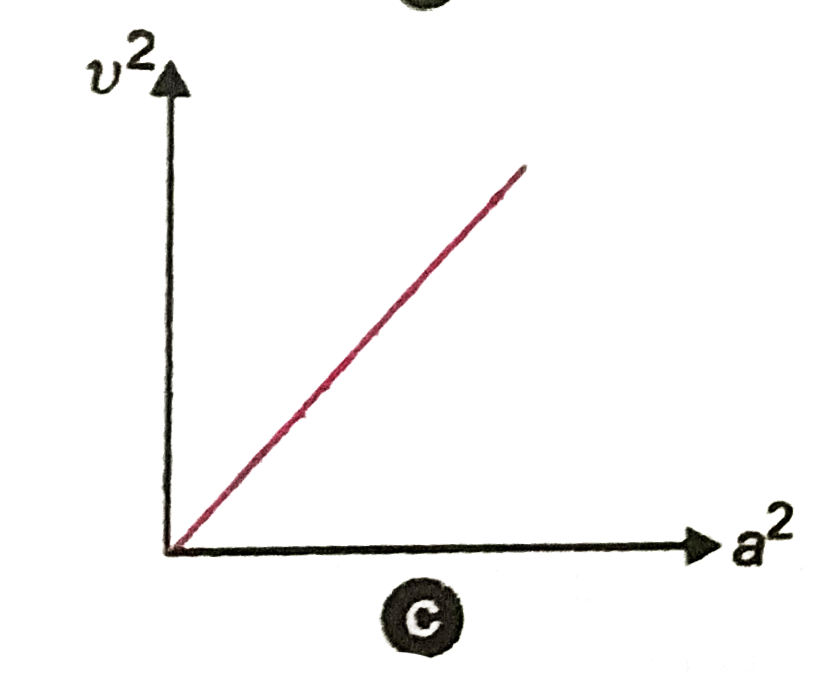
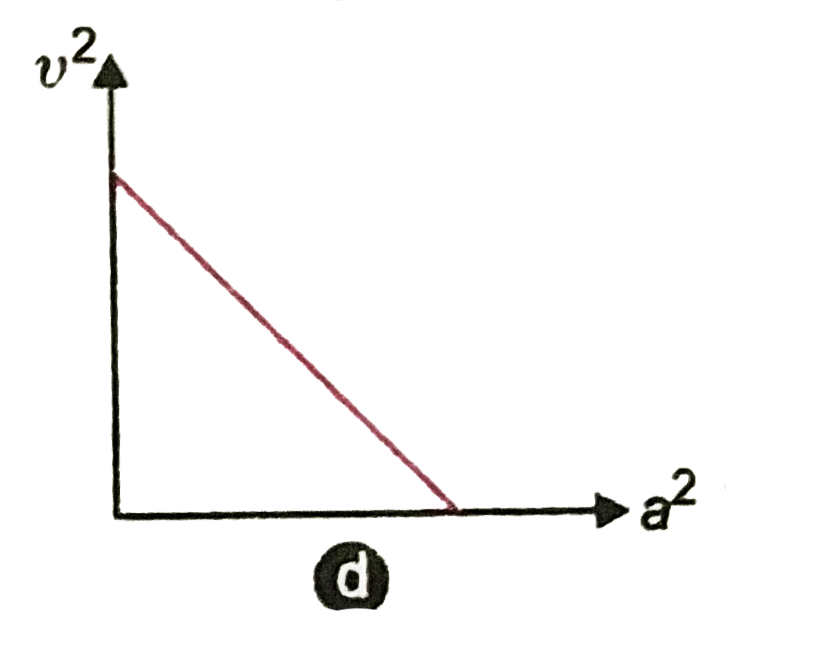
A mass m is performing linear simple harmonic motion, then which of the following graph represents correctly the variation of acceleration a corresponding to linear velocity υ ?
A
B
C
D
Video Solution
Text Solution
The correct Answer is:D
In SHM, y=rsinωt
υ=rωcosωtanda=dυdt=−ω2rsinωt
∴cosωt=υrωandsinωt=−aω2r
Hence, cos2ωt+sin2ωt=(υrω)2+[−aω2r]2
or 1=υ2r2ω2+a2ω4r2
or υ2=−a2ω2+r2ω2 ...(i0
Comparing (i), with general equation of st. line, y=mx+c , we note theat, the equation (i) is a st. line betweent υ2anda2 with negative slope (1/ω2). Hence, optiond (d) is correct.
|
Topper's Solved these Questions
- OSCILLATIONS AND WAVESBook:PRADEEPChapter:OSCILLATIONS AND WAVESExercise:integer type question
Explore 8 Videos
- OSCILLATIONS AND WAVESBook:PRADEEPChapter:OSCILLATIONS AND WAVESExercise:Assertion-Reason Type Questions
Explore 23 Videos
- OSCILLATIONS AND WAVESBook:PRADEEPChapter:OSCILLATIONS AND WAVESExercise:Multiple Choice Question-II
Explore 14 Videos
- MATHEMATICAL TOOLSBook:PRADEEPChapter:MATHEMATICAL TOOLSExercise:Fill in the blanks
Explore 5 Videos
- PHYSICAL WORLD AND MEASUREMENTBook:PRADEEPChapter:PHYSICAL WORLD AND MEASUREMENTExercise:Competiton Focus Jee Medical Entrance
Explore 18 Videos
Similar Questions
Knowledge Check
Which of the following graphs best represents the variation of acceleration 'a' with displacement x?
A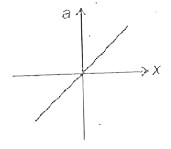 B
B C
C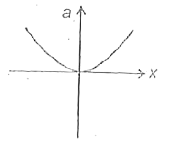 D
D
Which of following graphs represent accelerated motion ?
A B
B C
C D
D
Which of the following graphs represent a uniformaly accelerated motion ?
A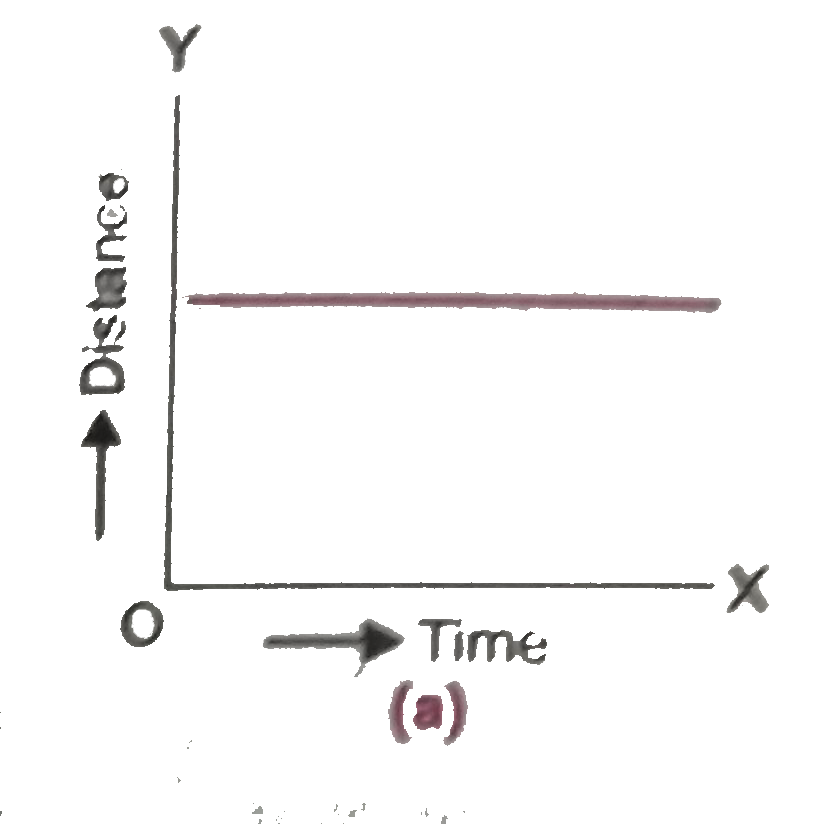 B
B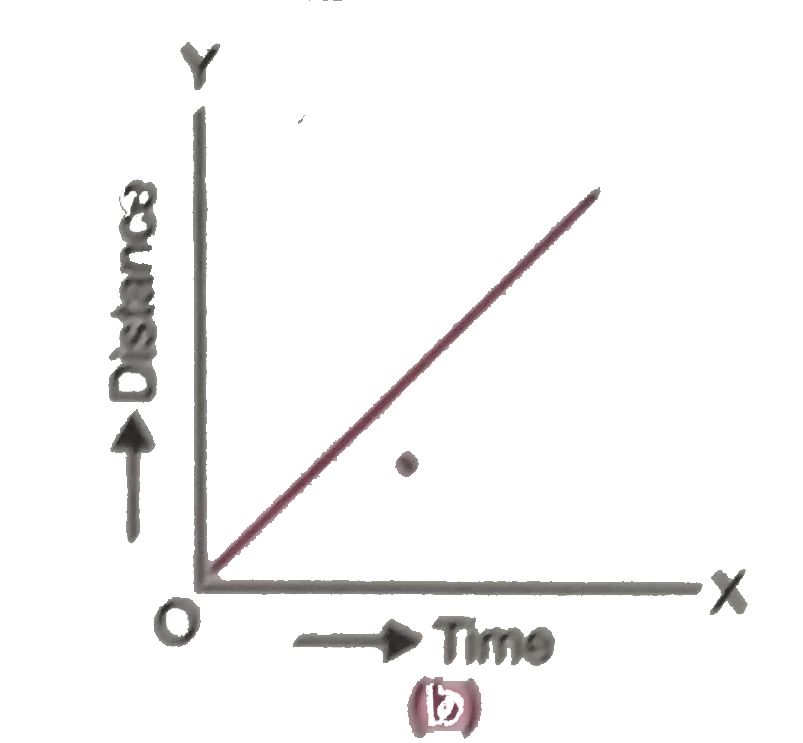 C
C D
D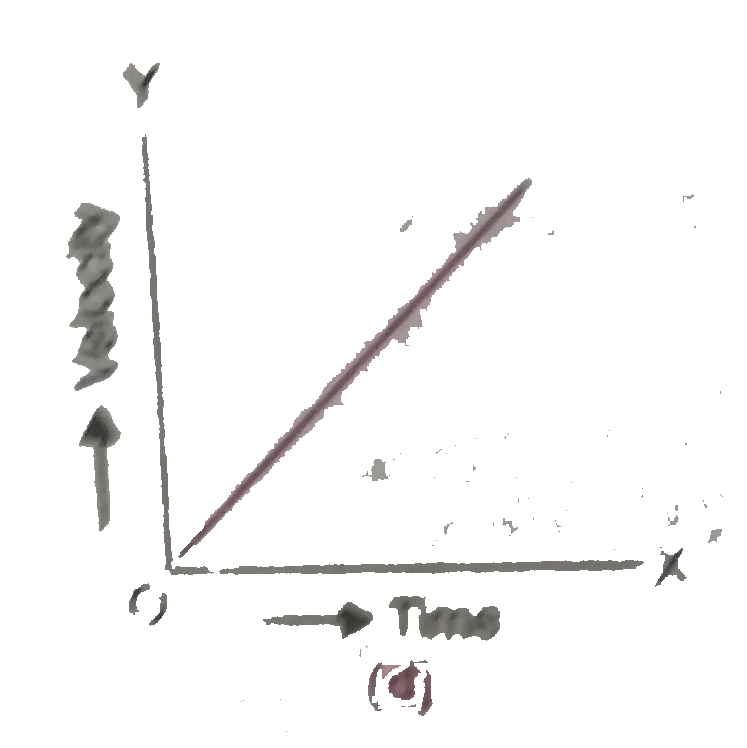
Which of the following graphs represent the correct variation of inductive reactance XL with frequency υ?
View SolutionWhile a particle executes linear simple harmonic motion
View SolutionGraph between velocity and displacement is shown in the following figure:
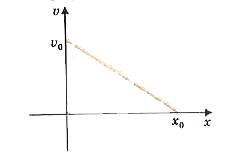
Which of the following graphes represents the correct variation of acceleration with displacement
View SolutionWhich of the following expressions does not represent simple harmonic motion ?
View SolutionWhich of the following graph correctly represents the variation of molar conductance (Δm) with dilution for a strong electrolyte ?
View Solution

