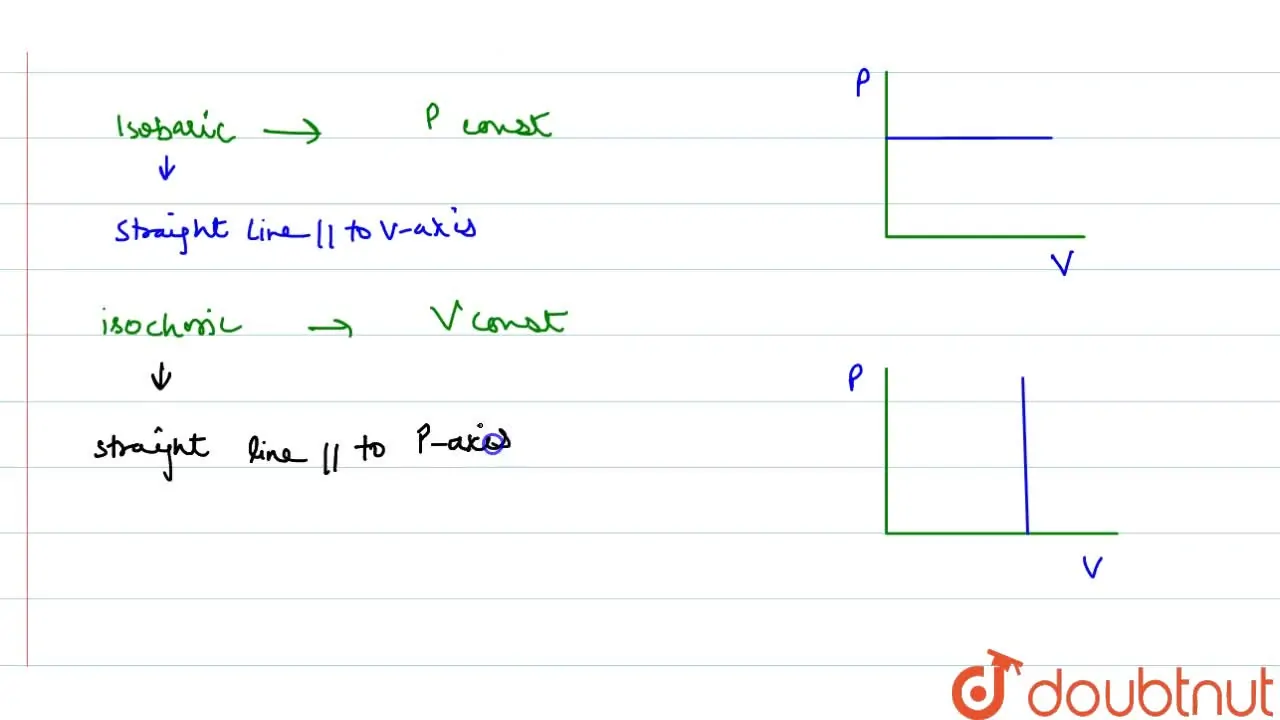
What is the nature of P−V diagram for isobaric and isochoric processes?
Video Solution
Text Solution
In an isobaric process, the P−V diagram is an straight line parallel to volume axis. In an isochoric process, the P−V diagram is a straight line parallel to pressure axis
|
Updated on:21/07/2023
Related Playlists
- BOOK - PRADEEPCHAPTER - THERMODYNAMICSEXERCISE - Short answer questions23videos
THERMODYNAMICS
- BOOK - PRADEEPCHAPTER - THERMODYNAMICSEXERCISE - Long answer questions11videos
THERMODYNAMICS
- BOOK - PRADEEPCHAPTER - THERMODYNAMICSEXERCISE - Conceptual Problems22videos
THERMODYNAMICS
- BOOK - PRADEEPCHAPTER - SYSTEMS OF PARTICLES AND ROTATIONAL MOTIONEXERCISE - Assertion- Reason Type questions20videos
SYSTEMS OF PARTICLES AND ROTATIONAL MOTION
- BOOK - PRADEEPCHAPTER - WORK, ENERGY AND POWEREXERCISE - Assertion-Reason Type Questions24videos
WORK, ENERGY AND POWER
Similar Questions
In an isochoric process
View SolutionIn isochoric process,
View SolutionFor an isochoric process, the changes(s) in ______.
View SolutionFor an Isochoric process
View SolutionWhat is an isochoric process ?
View SolutionWhat is an isobaric process ?
View SolutionIsobaric Process|| Isochoric Process
View SolutionIsobaric Process|| Isochoric Process
View SolutionThe slope of P-V graph for isochoric process is
View SolutionSolve the previous problem for the cases of an isochoric, an isobaric and an isothermic process.
View Solution


