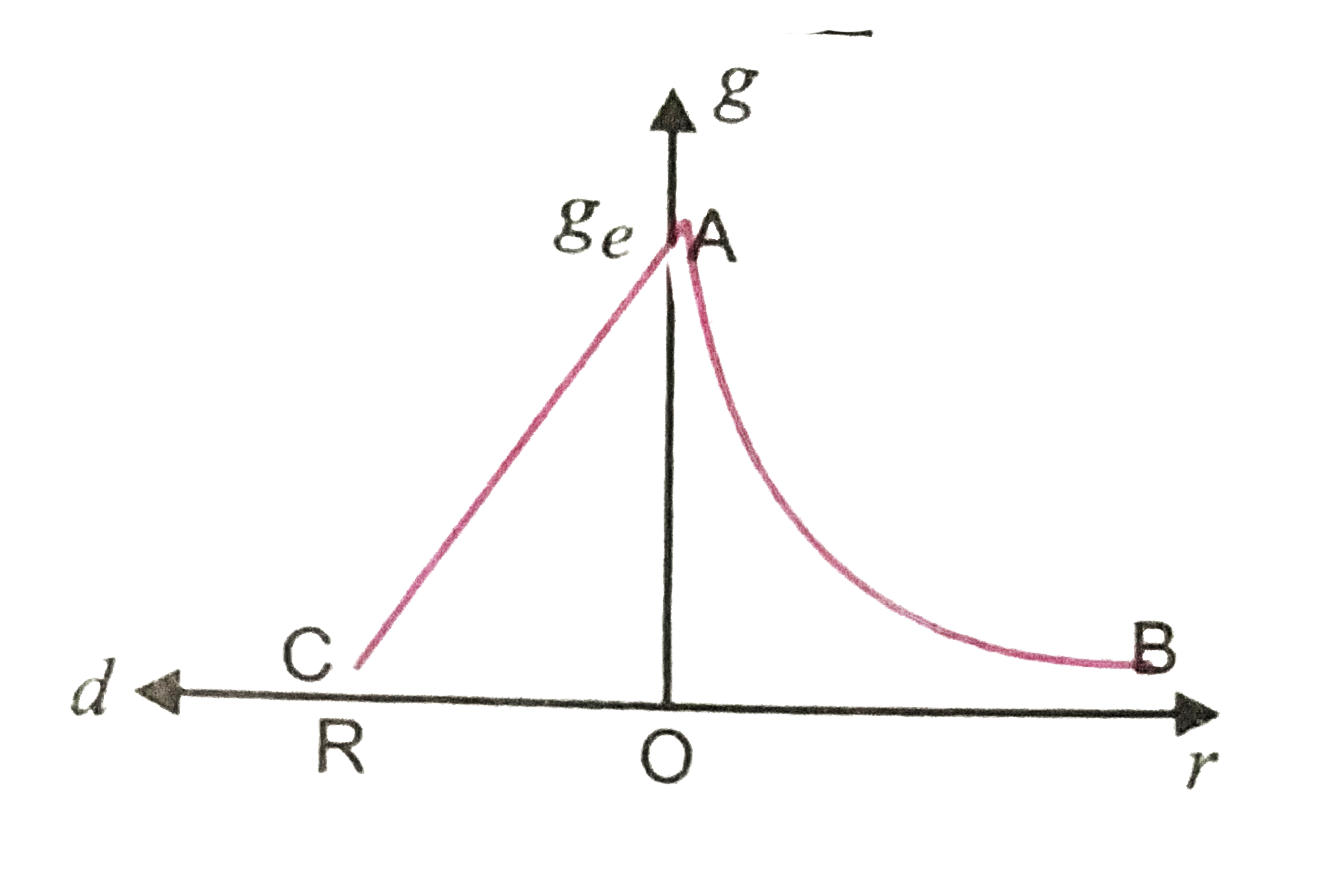
Draw graphs showing the variation of accleeration due to gravity with (a) height above the Earth's surface, (b) depth below the Earth's surface.
Video Solution
Text Solution
(a) The veriation of g with height h is related by ralation g∝1/r2 where r=R+h. Thus, the variation of g and r is a parabolic curve, i.e., part AB of the graph, Fig.
(b) The variation of g with depth is related by equation g'=g(1−dl/R) i.e., g'∝(R−d). Thus, the variation of g and d is at st. line, i.e., part AC of the graph, Fig.

|
Topper's Solved these Questions
- GRAVIATIONBOOK - PRADEEPCHAPTER - GRAVIATIONEXERCISE - CONCEPTUAL PROBLEMS IV.
1 Videos
- GRAVIATIONBOOK - PRADEEPCHAPTER - GRAVIATIONEXERCISE - CONCEPTUAL PROBLEMS V.
1 Videos
- GRAVIATIONBOOK - PRADEEPCHAPTER - GRAVIATIONEXERCISE - CONCEPTUAL PROBLEMS II.
1 Videos
- BEHAVIOUR OF PERFECT GAS & KINETIC THEORYBOOK - PRADEEPCHAPTER - BEHAVIOUR OF PERFECT GAS & KINETIC THEORYEXERCISE - Assertion - Reason Type questions
14 Videos
- KINEMATICSBOOK - PRADEEPCHAPTER - KINEMATICSEXERCISE - 1 NCERT Comprehension
4 Videos
Similar Questions
Knowledge Check
The acceleration due to gravity at a height 1 km above the earth is the same as at a depth d below the surface of earth
Ad = 1 kmBd=32kmCd = 2 kmDd=12 kmThe acceleration due to gravity at a height 1km above the earth is the same as at a depth d below the surface of earth. Then :
Ad=1kmBd=32kmCd=2kmDd=12kmLet the acceleration due to gravity be g1 at a height h above the earth's surface g2 at a depth d below the earth's surface. If g1=g2,h<<R and d<<R then
Ah=dBh=2dC2h=dDit is not possible for g1 to be equal to g2
Draw graphs showing the variation of acceleration due to gravity with depth below the earth's surface.
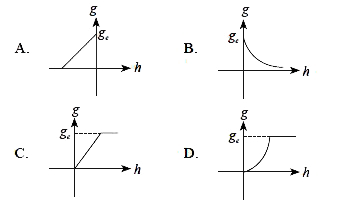
View SolutionWhich of the following graphs shows an approximate variation of acceleration due to gravity g with height h above the Earth's surface?

View SolutionDraw graphs showing the variation of accleeration due to gravity with (a) height above the Earth's surface, (b) depth below the Earth's surface.
View SolutionDerive an expression for the acceleration due to gravity at a depth d below the Earth's surface.
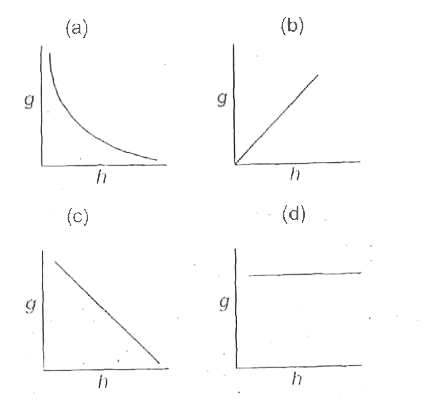
View SolutionWhich of the following graphs shows the variation of acceleration due to gravity g with depth h from the surface of the earth ?

View Solution
