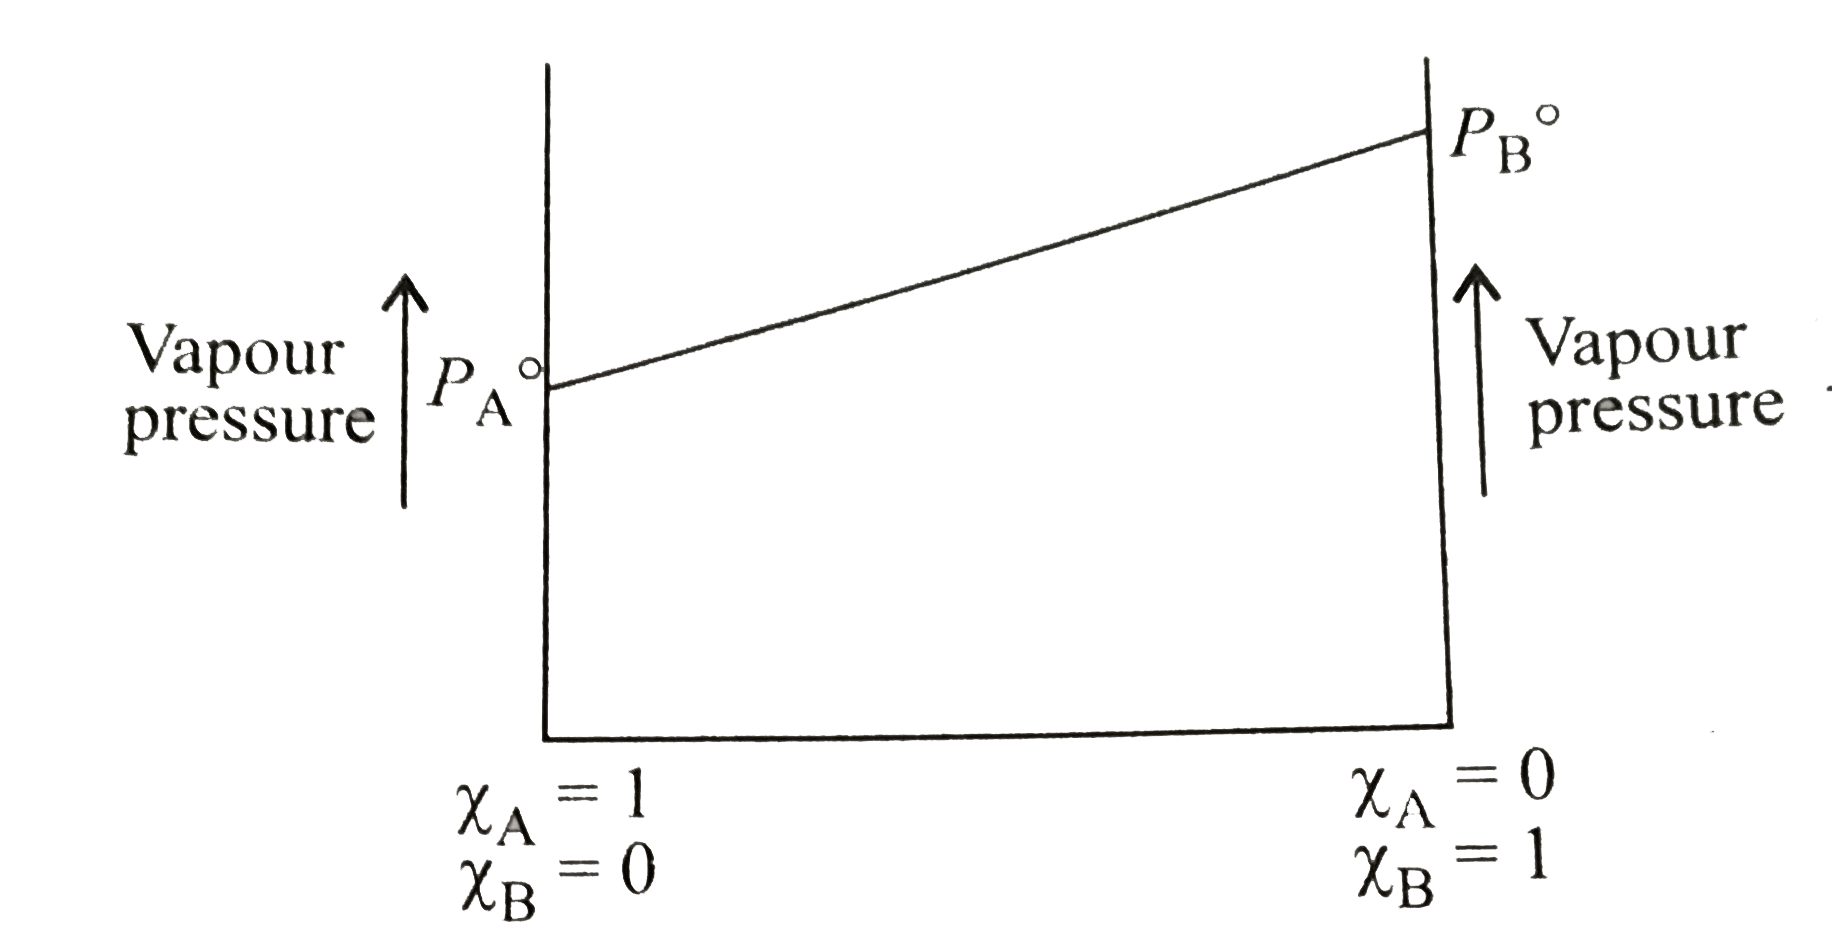
The following is a graph plotted between the vapour pressure of two volatile liquids against their respective mole fractions. Which of the following statements is/are correct?
When XA=1 and XB=0, then P=P∘A
When XB=1 and XA=0, then P>P∘A
When XA=1 and XB=0, then P<P∘B
When XB=1 and XA=0, then P=P∘B
The correct Answer is:A, B, C, D
P=P∘AXA+P∘BXB
when XA=1,XB=0⇒P=P∘A
Also P∘A<P∘B
when XB=1,XA=0⇒P=P∘B
and from graph, P∘B>P∘A
Topper's Solved these Questions
- DILUTE SOLUTION AND COLLIGATIVE PROPERTIESBook:P BAHADURChapter:DILUTE SOLUTION AND COLLIGATIVE PROPERTIESExercise:Exercise 3B Objectice Problems
Explore 1 Video
- DILUTE SOLUTION AND COLLIGATIVE PROPERTIESBook:P BAHADURChapter:DILUTE SOLUTION AND COLLIGATIVE PROPERTIESExercise:Exercise 9 Advanced Numerical
Explore 12 Videos
- CHEMICAL KINETICSBook:P BAHADURChapter:CHEMICAL KINETICSExercise:Exercise 9
Explore 13 Videos
- ELECTROCHEMISTRYBook:P BAHADURChapter:ELECTROCHEMISTRYExercise:Exercise (9) ADVANCED NUMERICAL PROBLEMS
Explore 36 Videos
Similar Questions
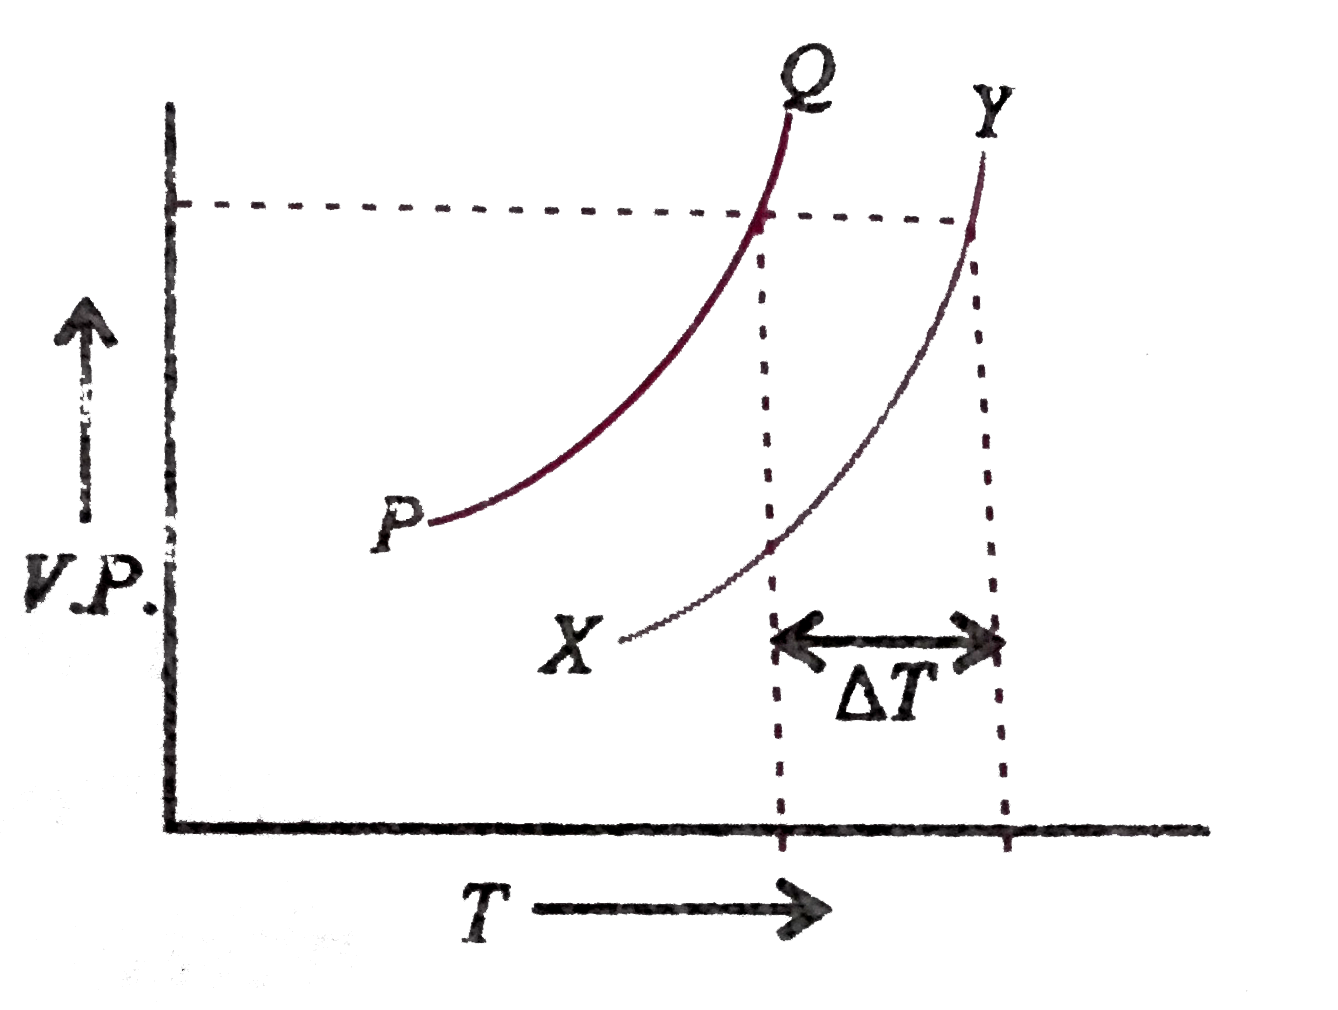
In the graph plotted between vapour pressure (V.P.) and temperature (T),
View Solution10 moles of a liquid L are 50% converted into its vapour at its boiling point (273∘C) and at a pressure of 1 atm.If the value of latent heat of vapourisation of liquid L is 273 L atm/mole , than which of the following statements is/are correct : Assume volume of liquid to be negligible and vapour of the liquid to behave ideally.
View Solution
Knowledge Check
A graph between vapour pressure and temperature of few liquids is given below. Study the graph and answer following question.
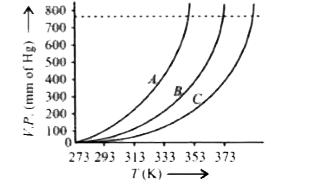
Which of the following statements is not true?ABoiling point of a liquid is the temperature at which its vapour pressure becomes equal to atmospheric pressure.BBoiling point of water can be increased by increased the pressure above the atmospheric pressureCIf liquid B is heated in a closed vessel it will boil at 353 KDLiquid C has higher boilingk point than B due to higher intermolecular forces.If a graph is plotted between log V and log T for 2 moles of a gas of constant pressure of 0.0821 atm, then which of the following statements are correct?
AThe curve is straight line with slope -1.BThe curve is straight line with slope +1CThe intercept on y-axis is equal to 2.DThe intercept on y-axis is equal to 0.3010.A graph is plotted between the vapour pressure and mole fraction of a solutionn containing benzene and toluene. Select the correct statements.
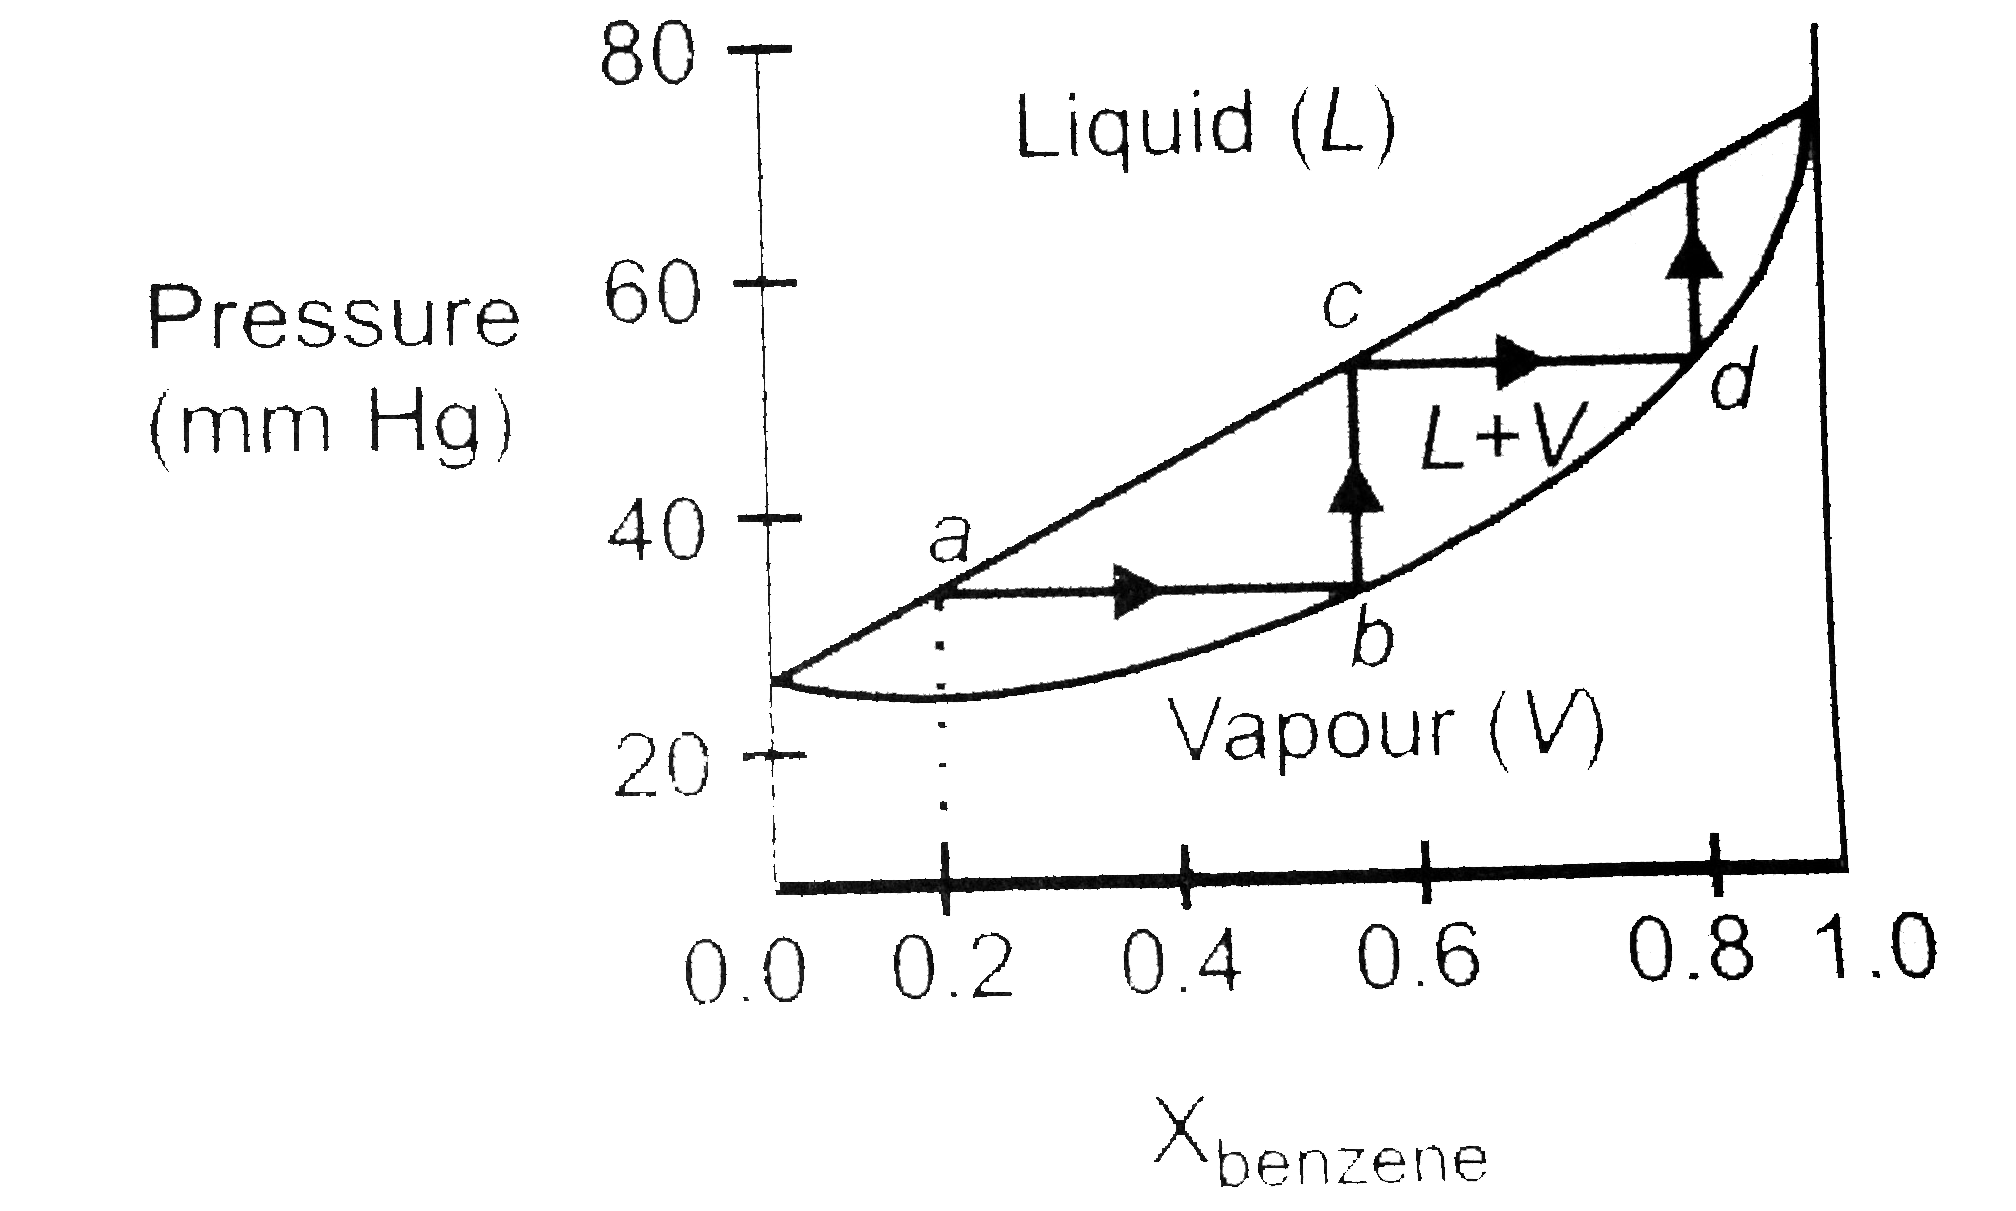 AAt the point a, the mole fraction of toluene is 0.80Bb→c represents condesationCc→d represents vaporizationDc→d represents vaporization as well as condensation
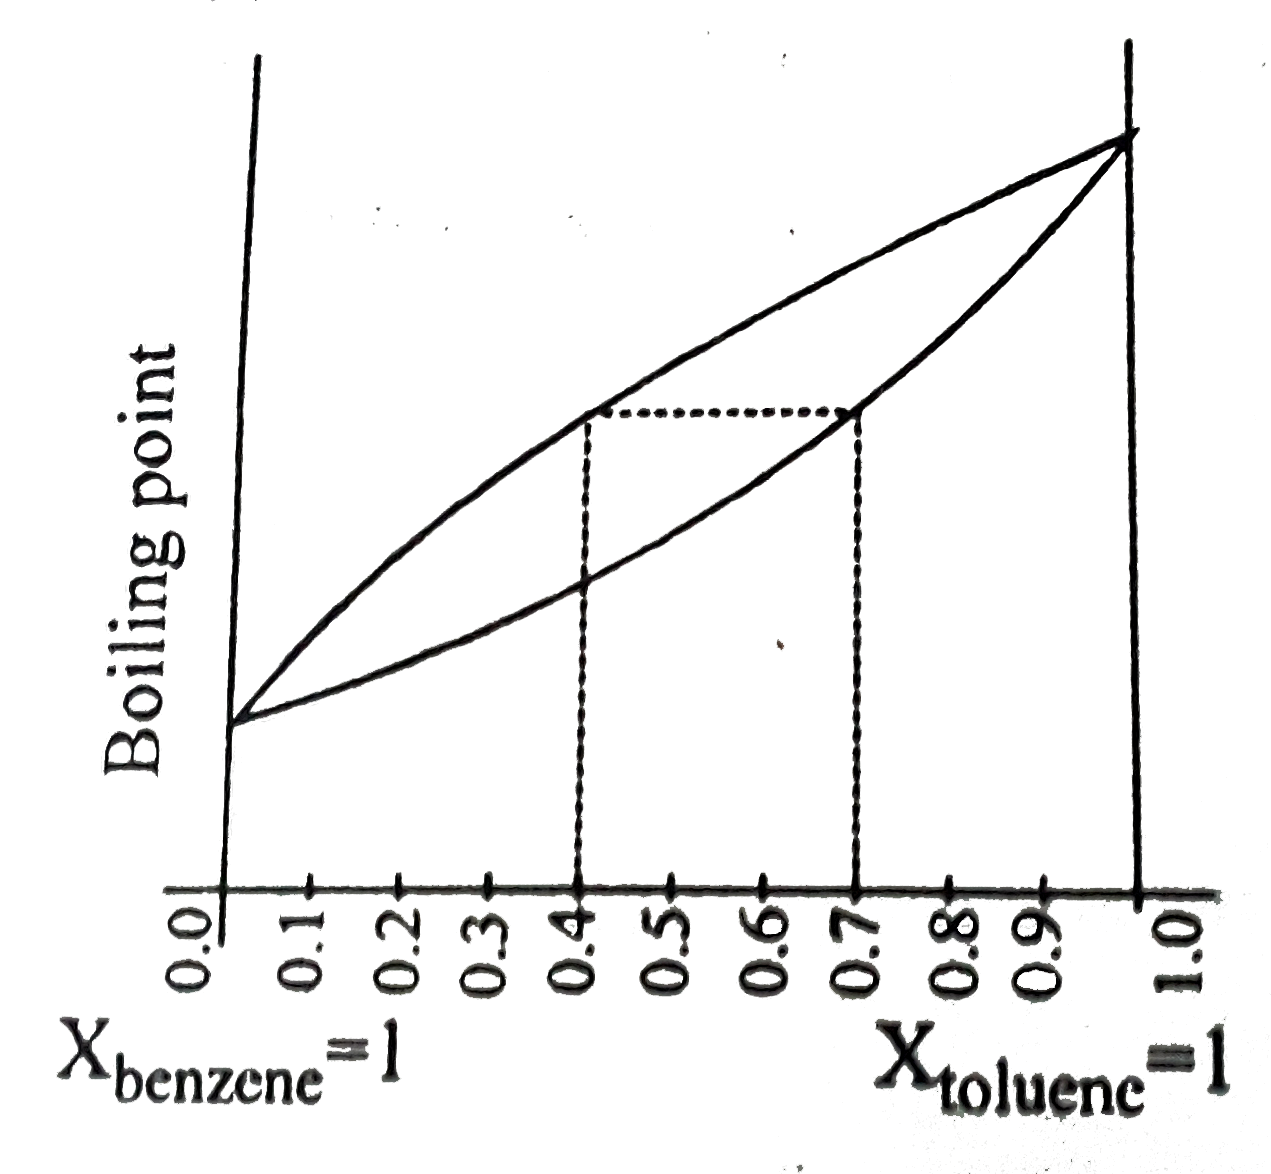
The following graph represents variation of boiling point with composition of liquid and vapours of binary liquid mixture. The graph is plotted at constant pressure.
Which of the following statement(s) is incorrect. Here X & Y stands for mole fraction in liquid and vapour phase respectively.
View SolutionChoose the correct statement with respect to the vapour pressure of a liquid among the following:
View SolutionRelative lowering in vapour pressure of solution containing non-volatile solute is directly proportional to mole fraction of solute. Above statement is
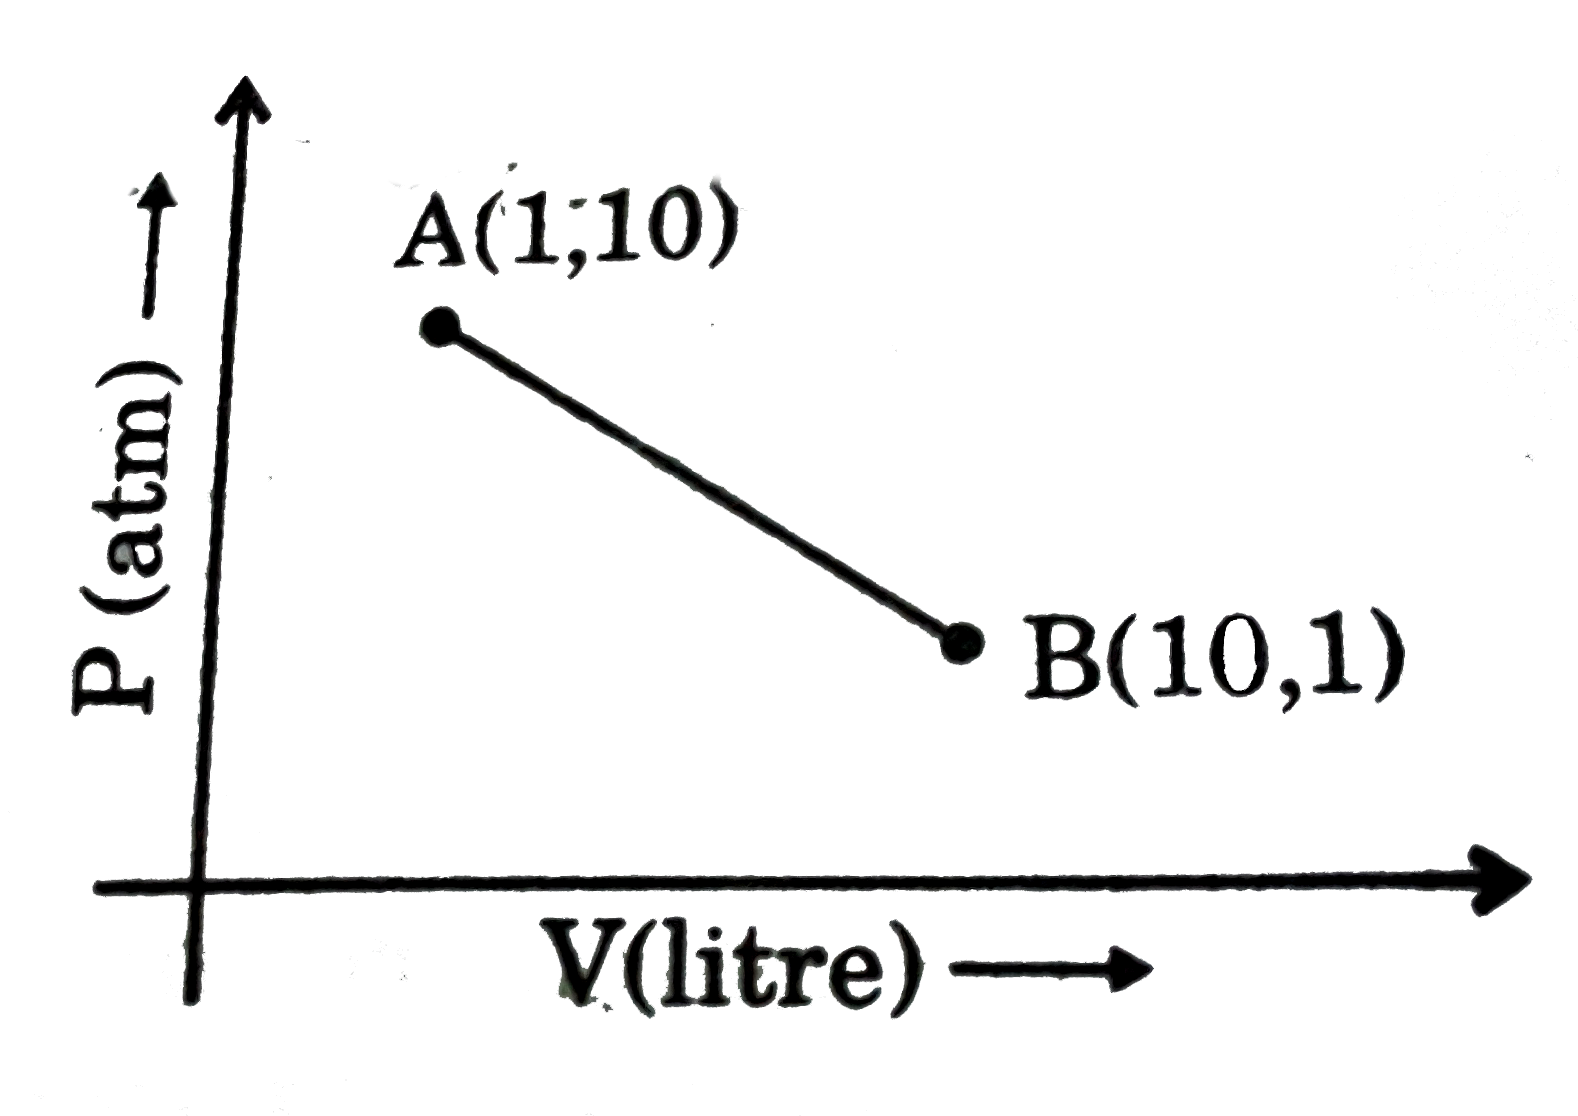
View SolutionFor 1 mole of an ideal gas, a graph of pressure vs volume is plotted as shown. Which of the following option is correct ?
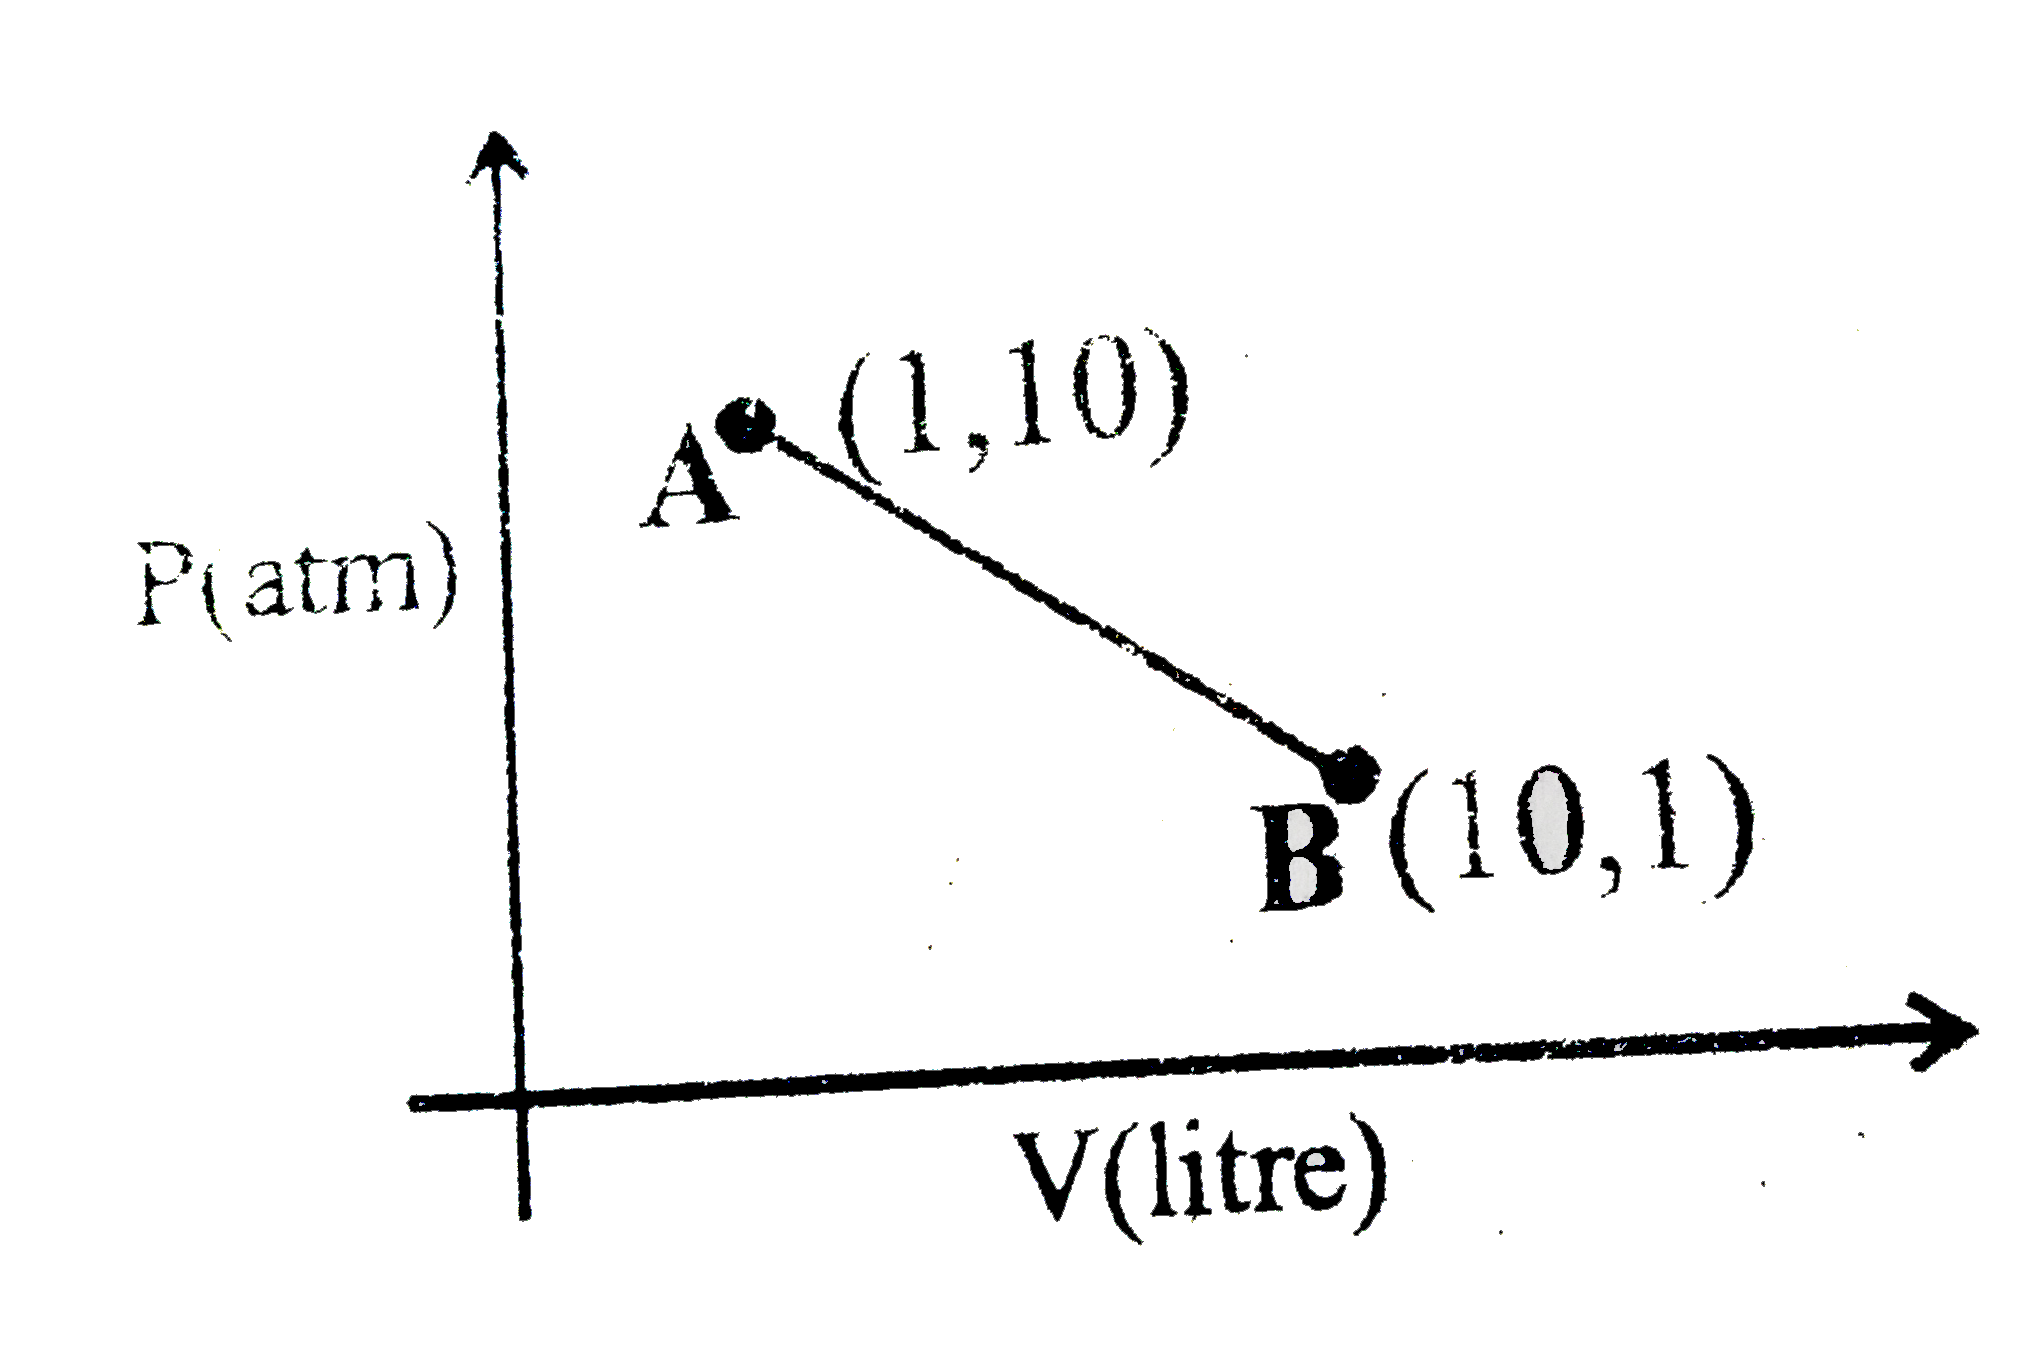
View SolutionFor 1 mole of an ideal gas, a graph of pressure vs volume is plotted as shown. Which of the following options is correct ?
View Solution
