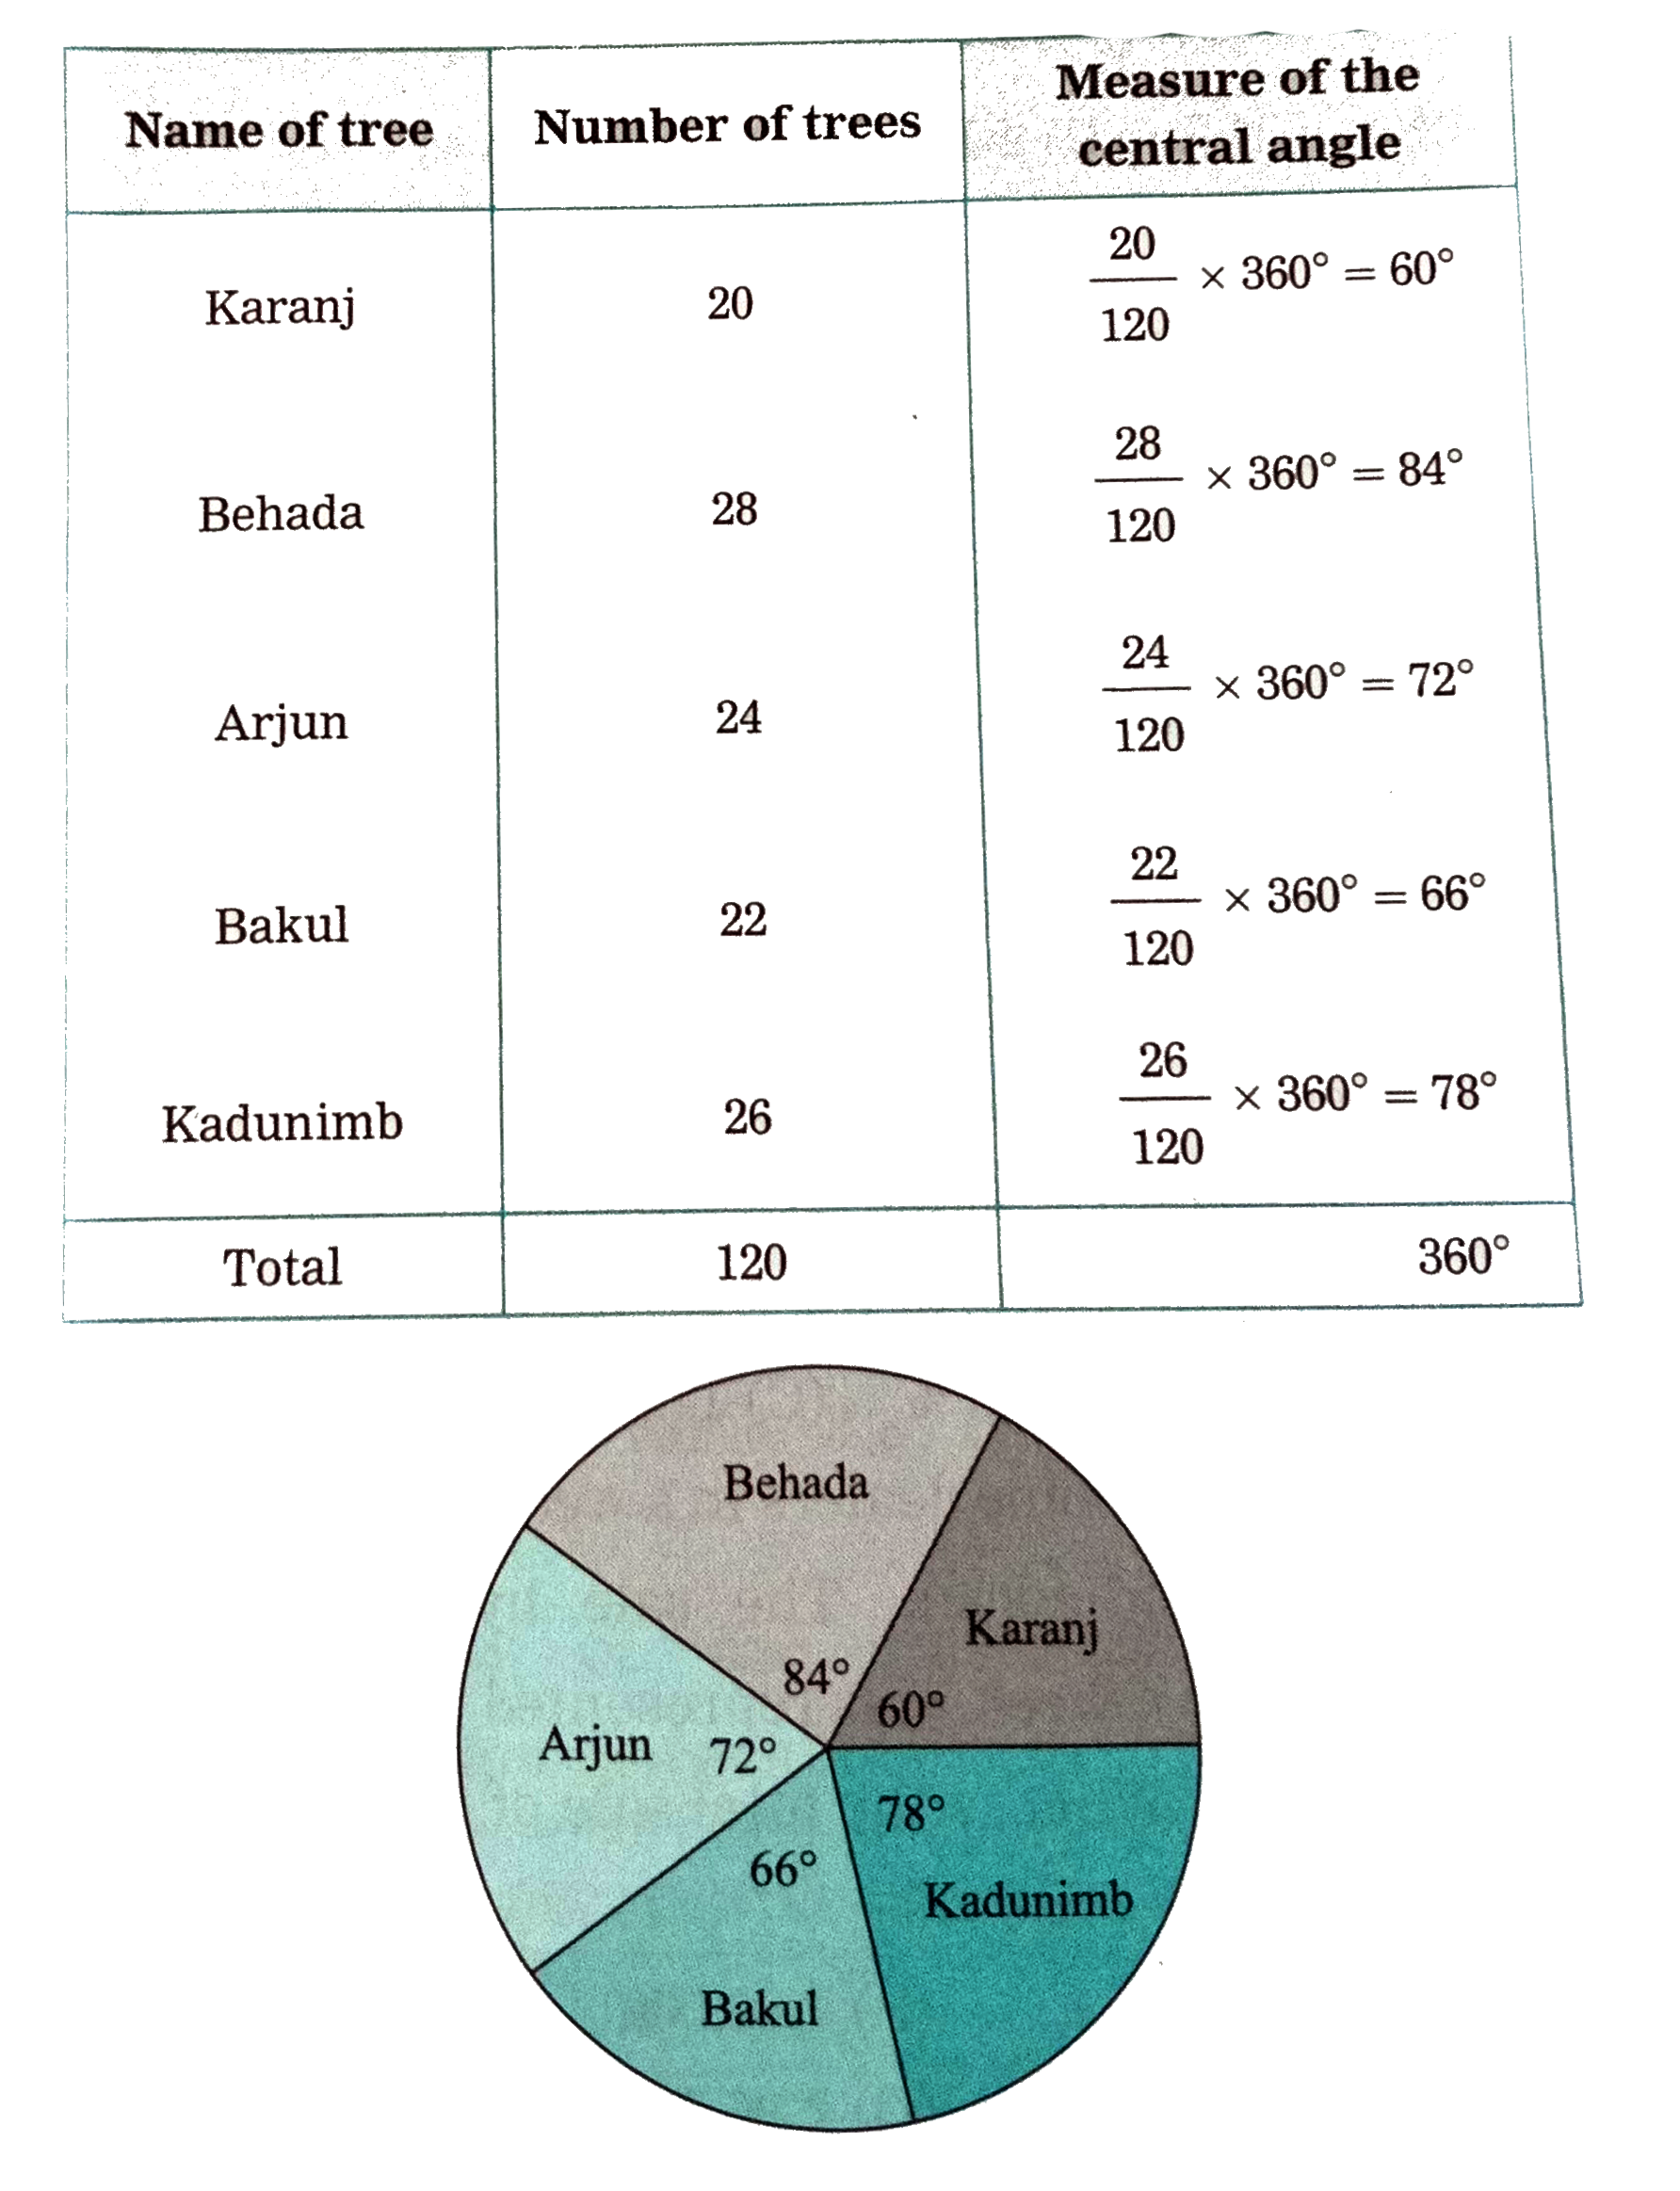
On an environment day, students in a school planted 120 trees under plantation project. The information regarding the project is shown in the following table. Show it by a pie diagram.

The number of trees are converted into components parts of 360∘ in the following table :

Topper's Solved these Questions
- STATISTICSBOOK - NAVNEET PUBLICATION - MAHARASHTRA BOARDCHAPTER - STATISTICSEXERCISE - PRACTICE SET 6.1
6 Videos
- STATISTICSBOOK - NAVNEET PUBLICATION - MAHARASHTRA BOARDCHAPTER - STATISTICSEXERCISE - PRACTICE SET 6.2
4 Videos
- STATISTICSBOOK - NAVNEET PUBLICATION - MAHARASHTRA BOARDCHAPTER - STATISTICSEXERCISE - EXAMPLES
3 Videos
- SIMILARITYBOOK - NAVNEET PUBLICATION - MAHARASHTRA BOARDCHAPTER - SIMILARITYEXERCISE - SUBJECTIVE TYPE
20 Videos
- THEOREMS BOOK - NAVNEET PUBLICATION - MAHARASHTRA BOARDCHAPTER - THEOREMS EXERCISE - CIRCLE
15 Videos
Similar Questions
Knowledge Check
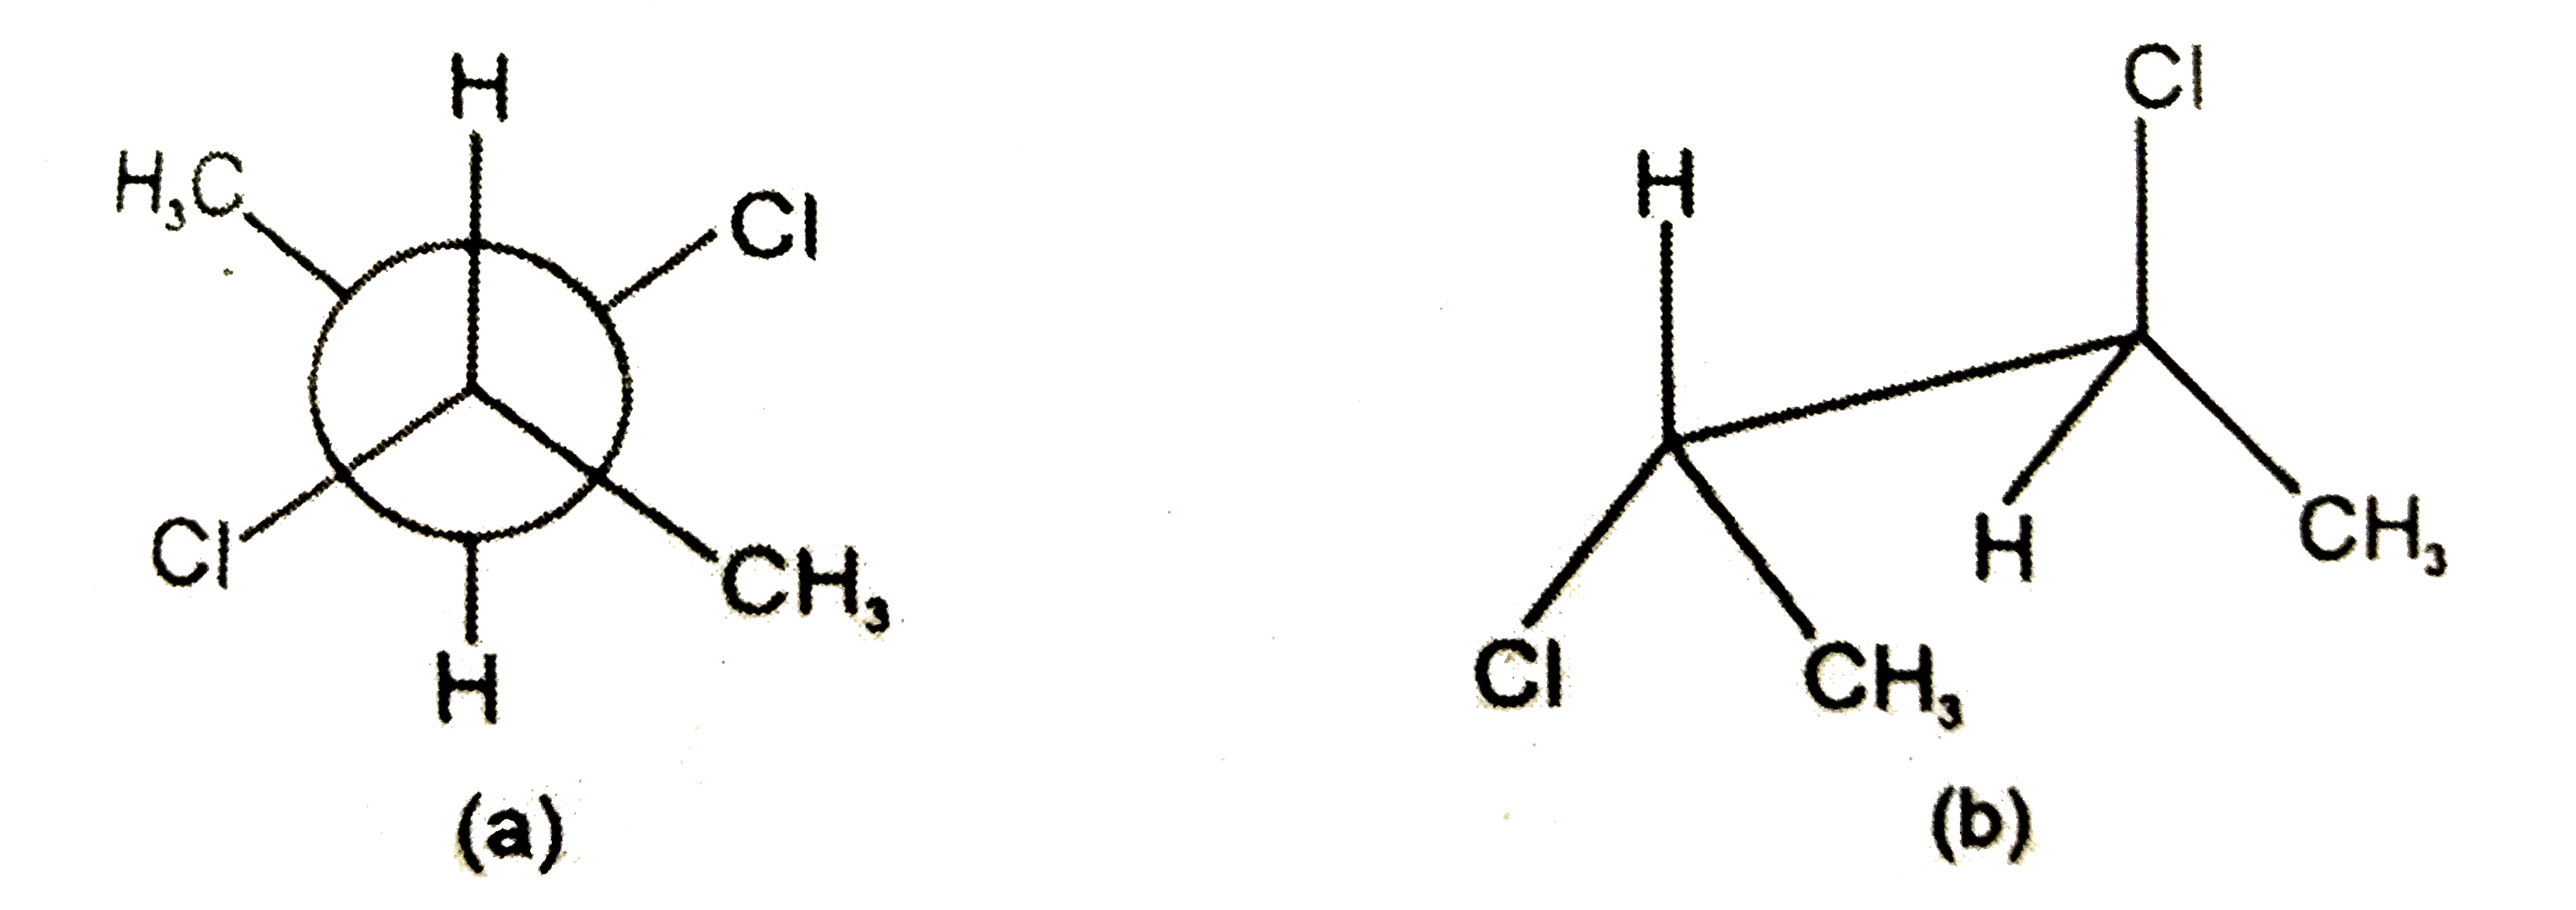
Which of the following statement regarding the projections shown below is true ?
 Aa' and 'b' both represent the same configurationBBoth 'a' and 'b' are optically activeCb' alone is optically activeDa' alone is optically active
Which of the following statements regardings the projections shown below is true?
 Aa and b both represented the same configurationBBoth a and b are optically activeCb alone is optically activeDa alone is optically active
The following table shows causes of noise pollution. Show it by a pie diagram.

View SolutionTotal number of students of a school in different years is shown in the following table
View SolutionIn a tree plantation programme, the number of trees planted by students of different classes is given in the following table. Draw a pie diagram showing the information.

View SolutionIn a tree plantation programme, the number of trees planted by students of different classes is given in the following table. Draw a pie diagram showing the information.

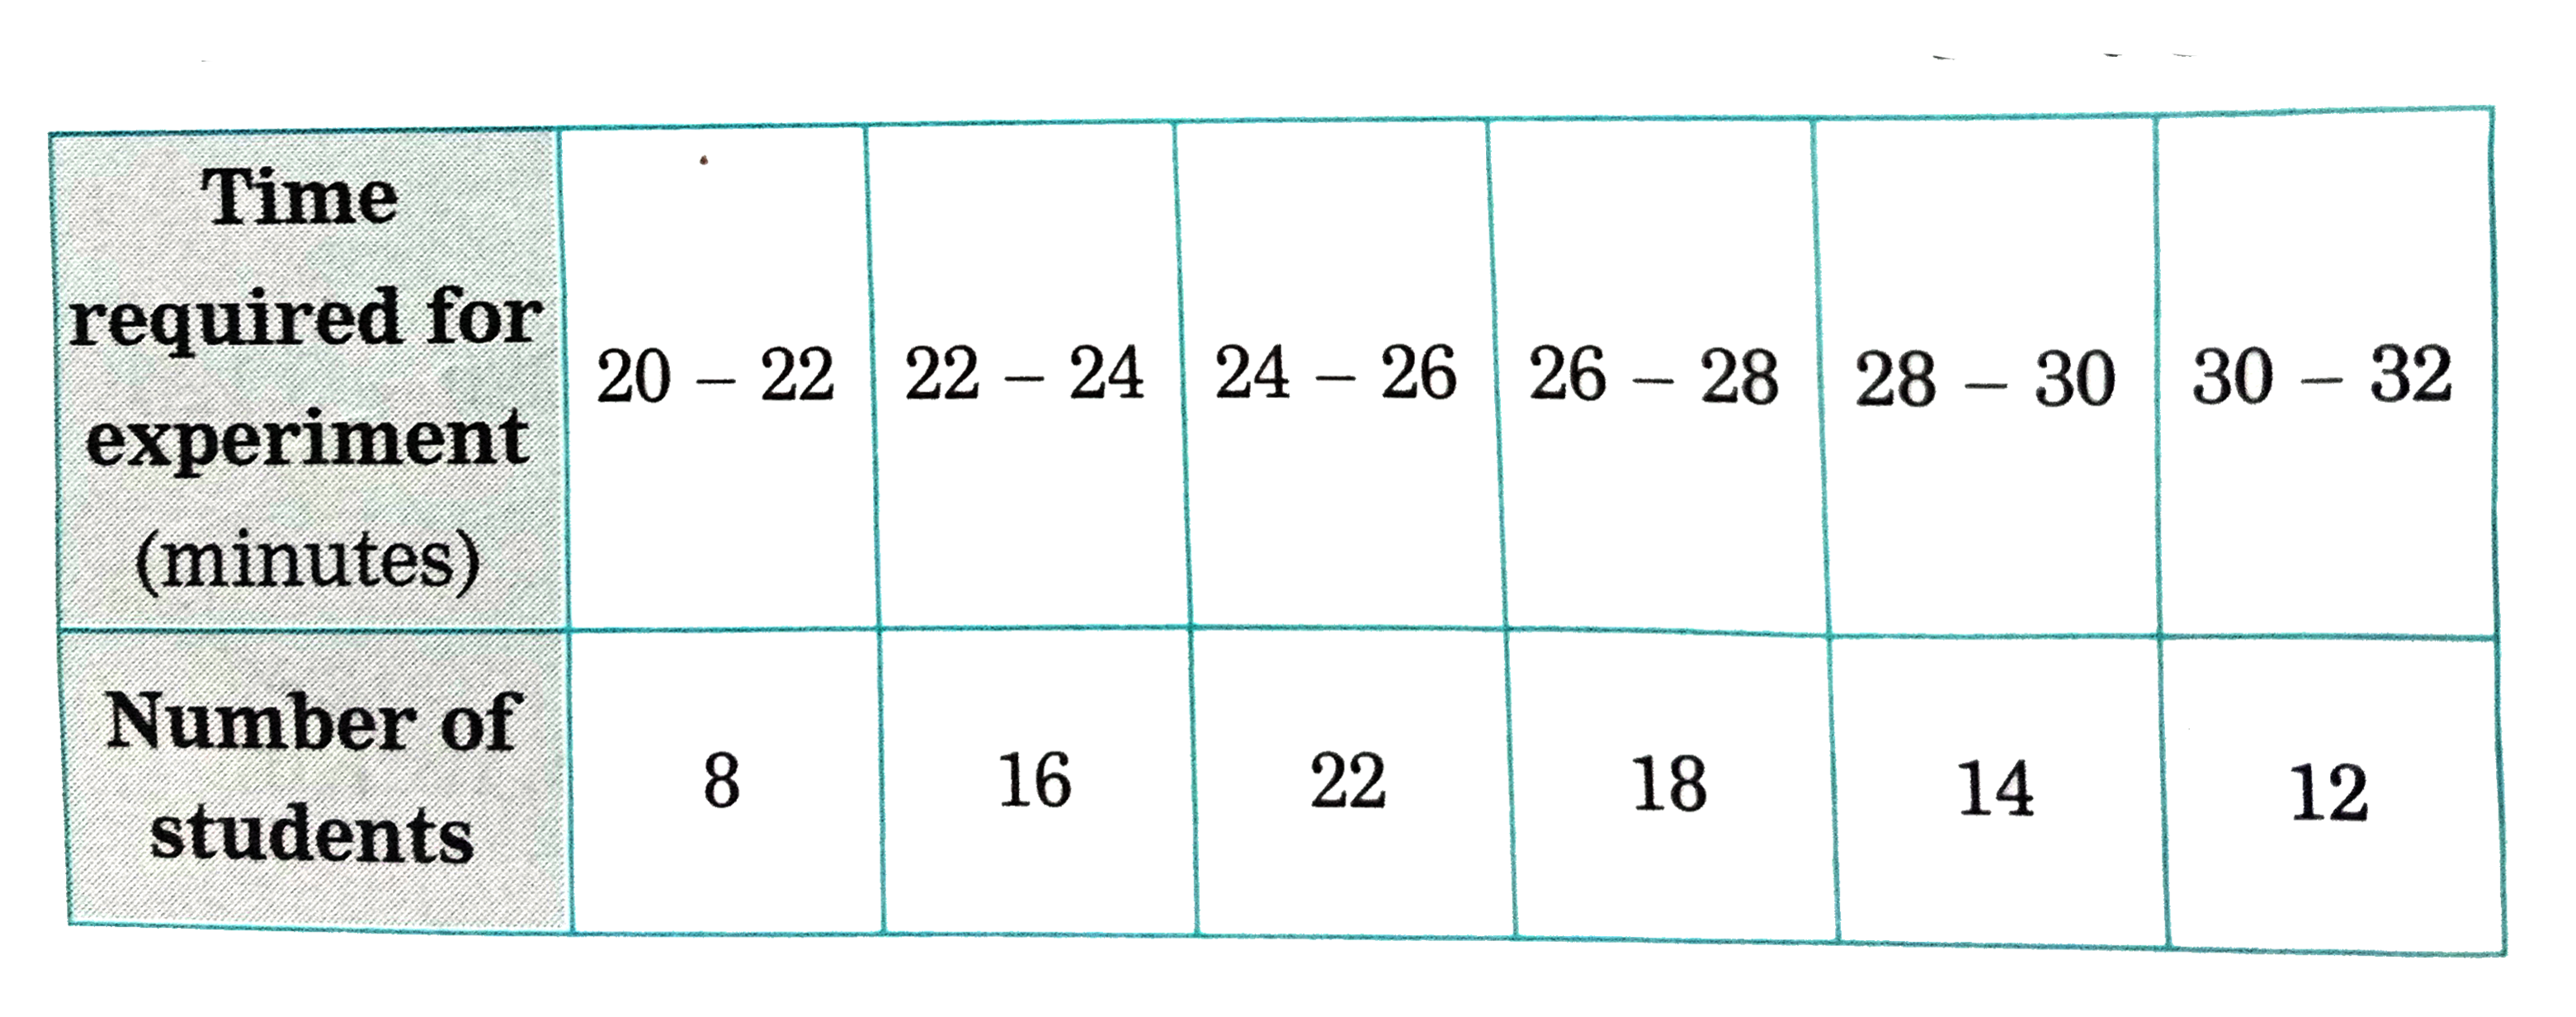
View SolutionThe time required for students to do a science experiment and the number of students is shown in the following grouped frequency distribution table. Show information by a histogram and also by a frequency polygon.

View SolutionTime alloted for the preparation of an examination by some students is shown in the table. Draw a histogram to show the information.

View Solution


