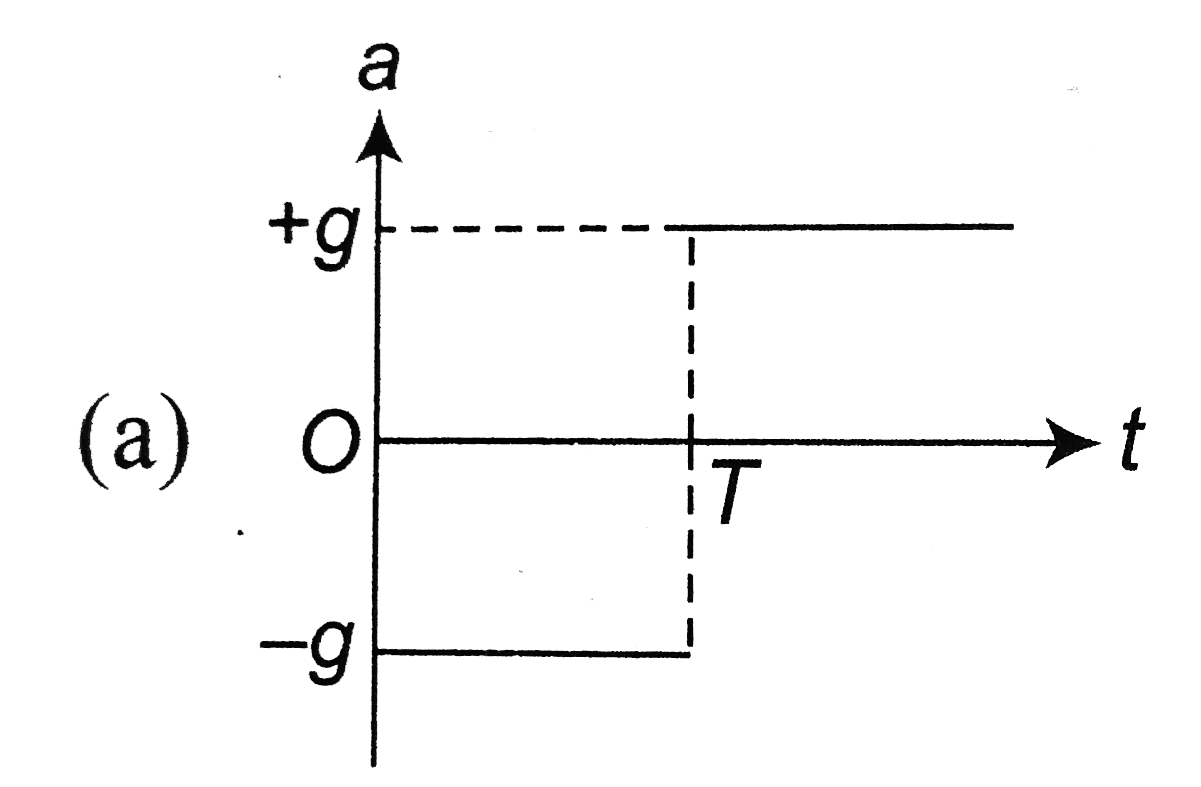
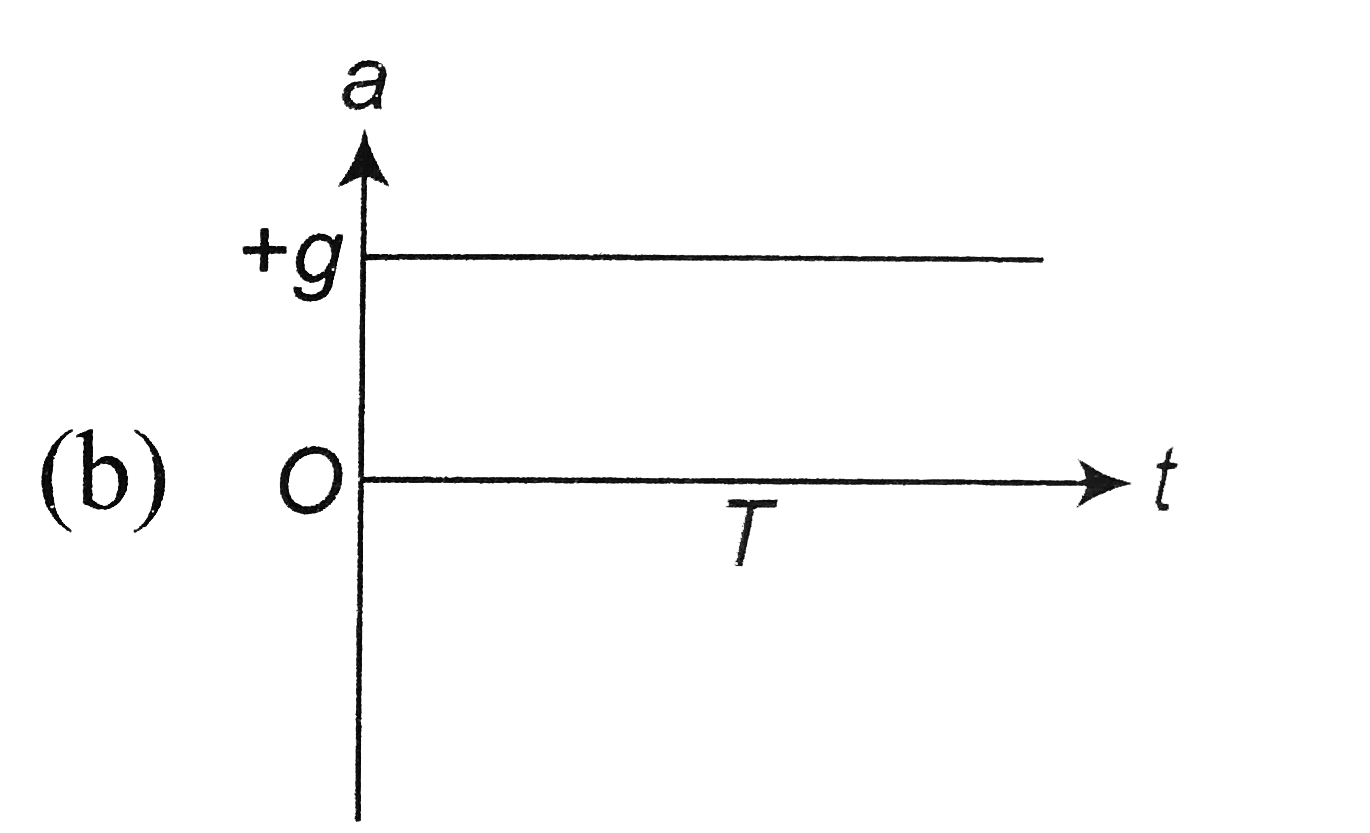
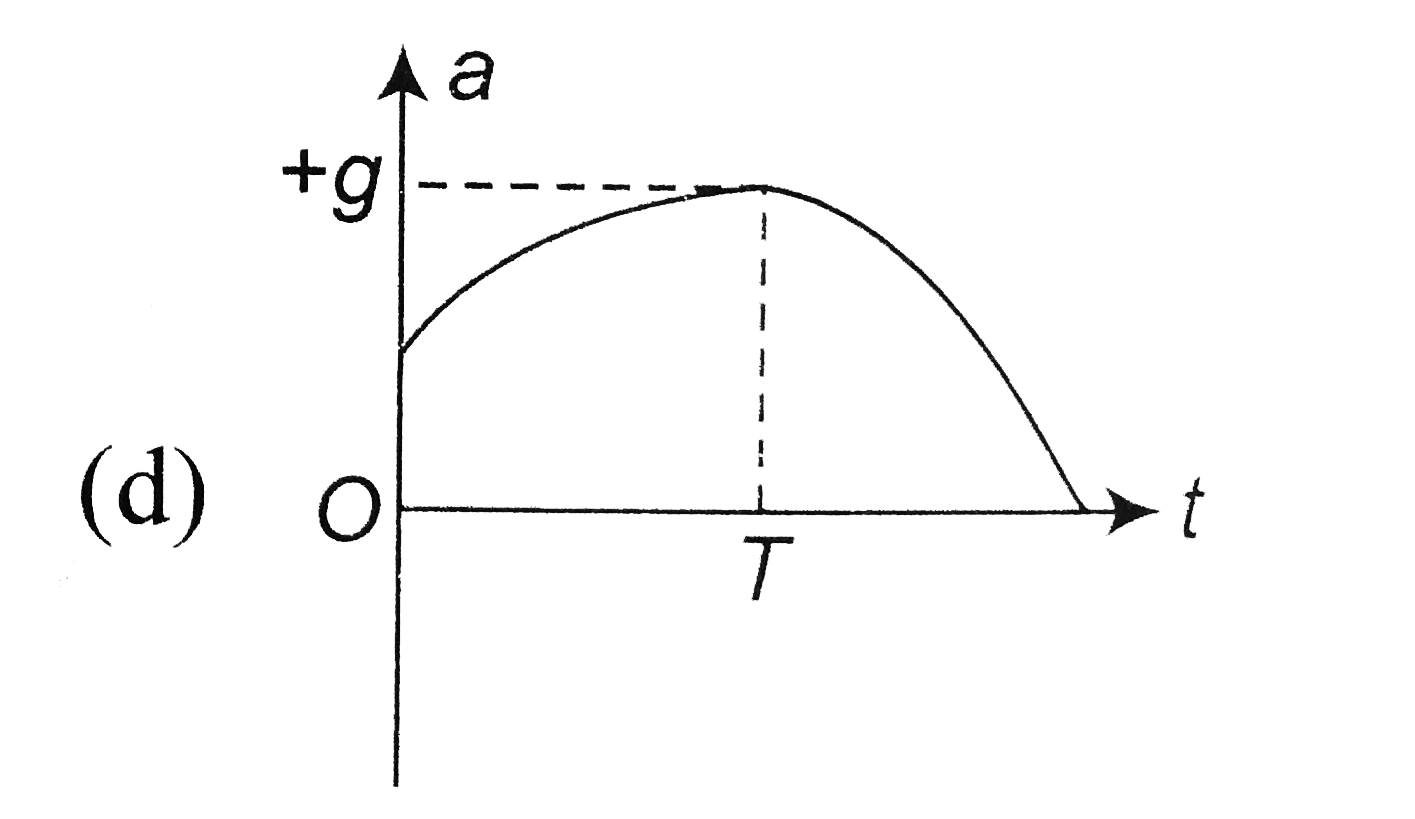
A ball is thrown vetically upwards at time t=0. Air resistance is not negligible and the acceleration of free fall is g. The ball reaches a maximum height at time t=T and then descends, reaching terminal speed. Which graph best shows the variation with time t to the acceleration a of the ball
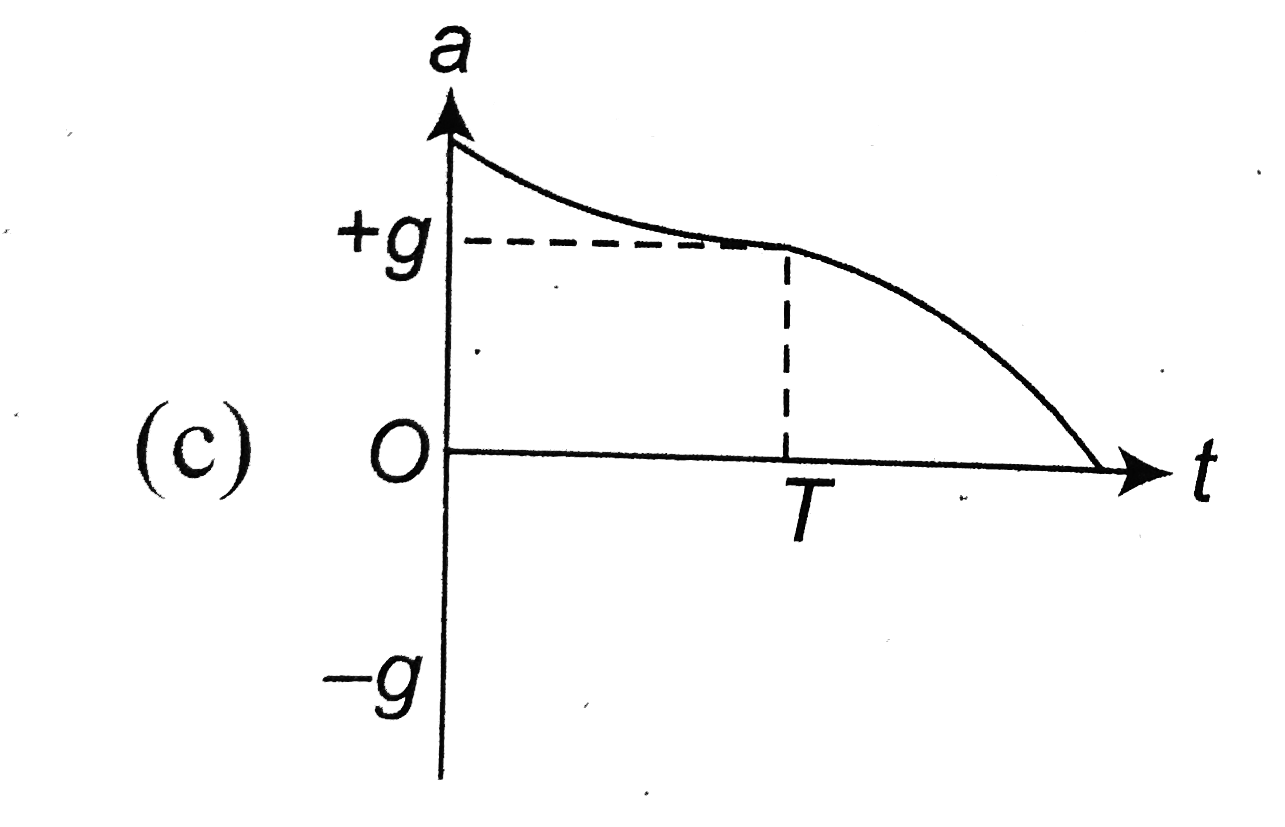
The correct Answer is:C
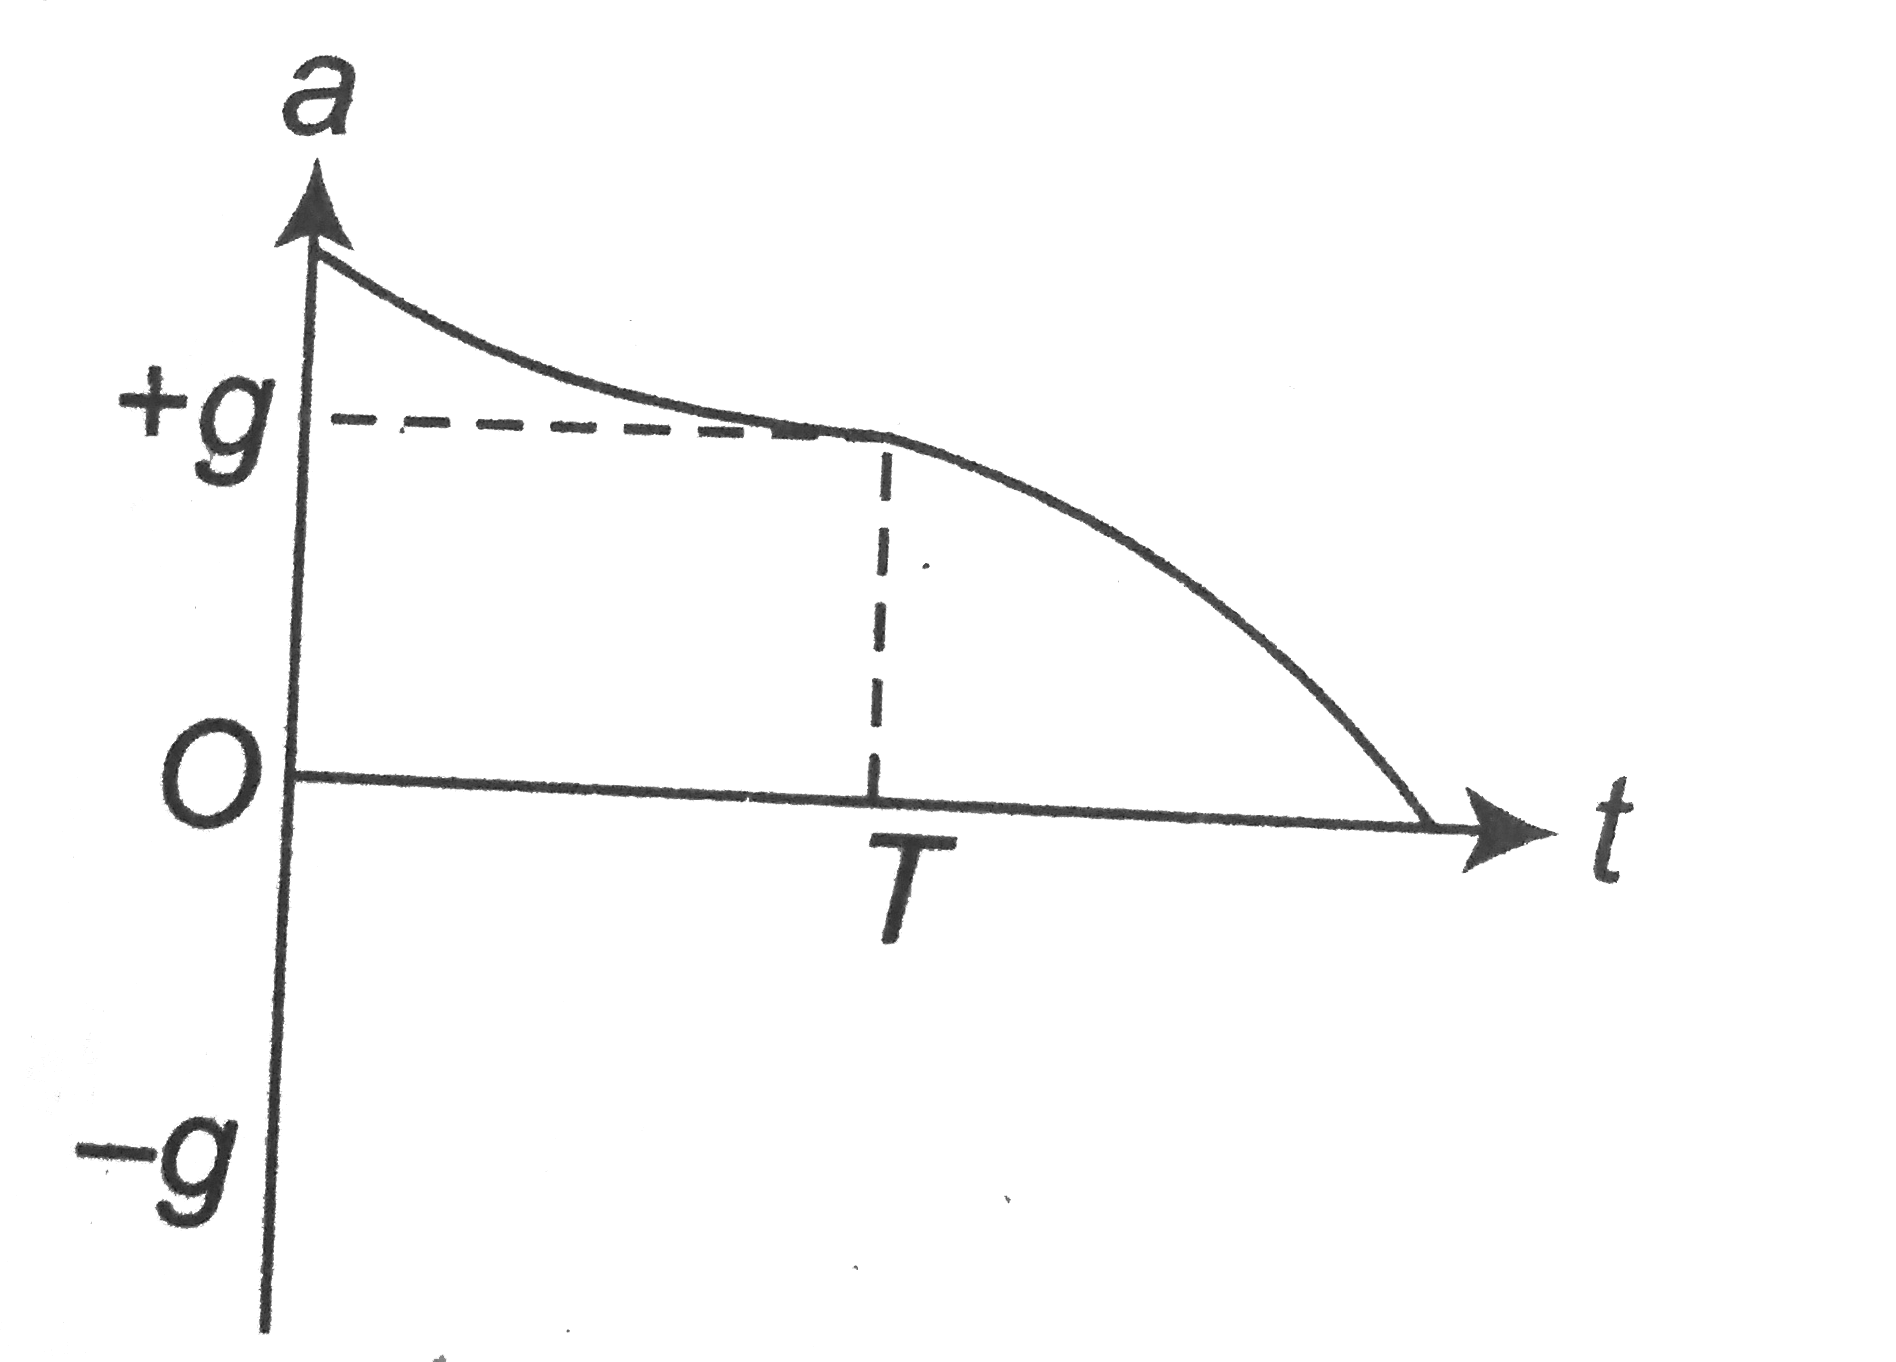
As the ball ascends upwards in addiction to weight air friction also acts downwards. Hence the initial magnitude of acceleration will be greater than magnitude of acceleration due to gravity. So the only possible option is
Topper's Solved these Questions
- PROPERTIES OF MATTERBook:A2ZChapter:PROPERTIES OF MATTERExercise:Problems Based On Mixed Concepts
Explore 34 Videos
- PROPERTIES OF MATTERBook:A2ZChapter:PROPERTIES OF MATTERExercise:Assertion Reasoning
Explore 20 Videos
- PROPERTIES OF MATTERBook:A2ZChapter:PROPERTIES OF MATTERExercise:Pressure Difference And Capillarity
Explore 23 Videos
- OSCILLATION AND SIMPLE HARMONIC MOTIONBook:A2ZChapter:OSCILLATION AND SIMPLE HARMONIC MOTIONExercise:Chapter Test
Explore 29 Videos
- ROTATIONAL DYNAMICSBook:A2ZChapter:ROTATIONAL DYNAMICSExercise:Chapter Test
Explore 29 Videos
Similar Questions
A ball is thrown vertically upwards with a velocity of 4.9m/s Find
(i) the maximum height reached by the ball
(ii) time taken to reach the maximum height
View SolutionA baseball of mass m is thrown upward with some initial speed. If air resistance is neglected, what is the force on the ball: (a) when it reaches half its maximum height, and (b) when it reaches its peak?
View Solution
Knowledge Check
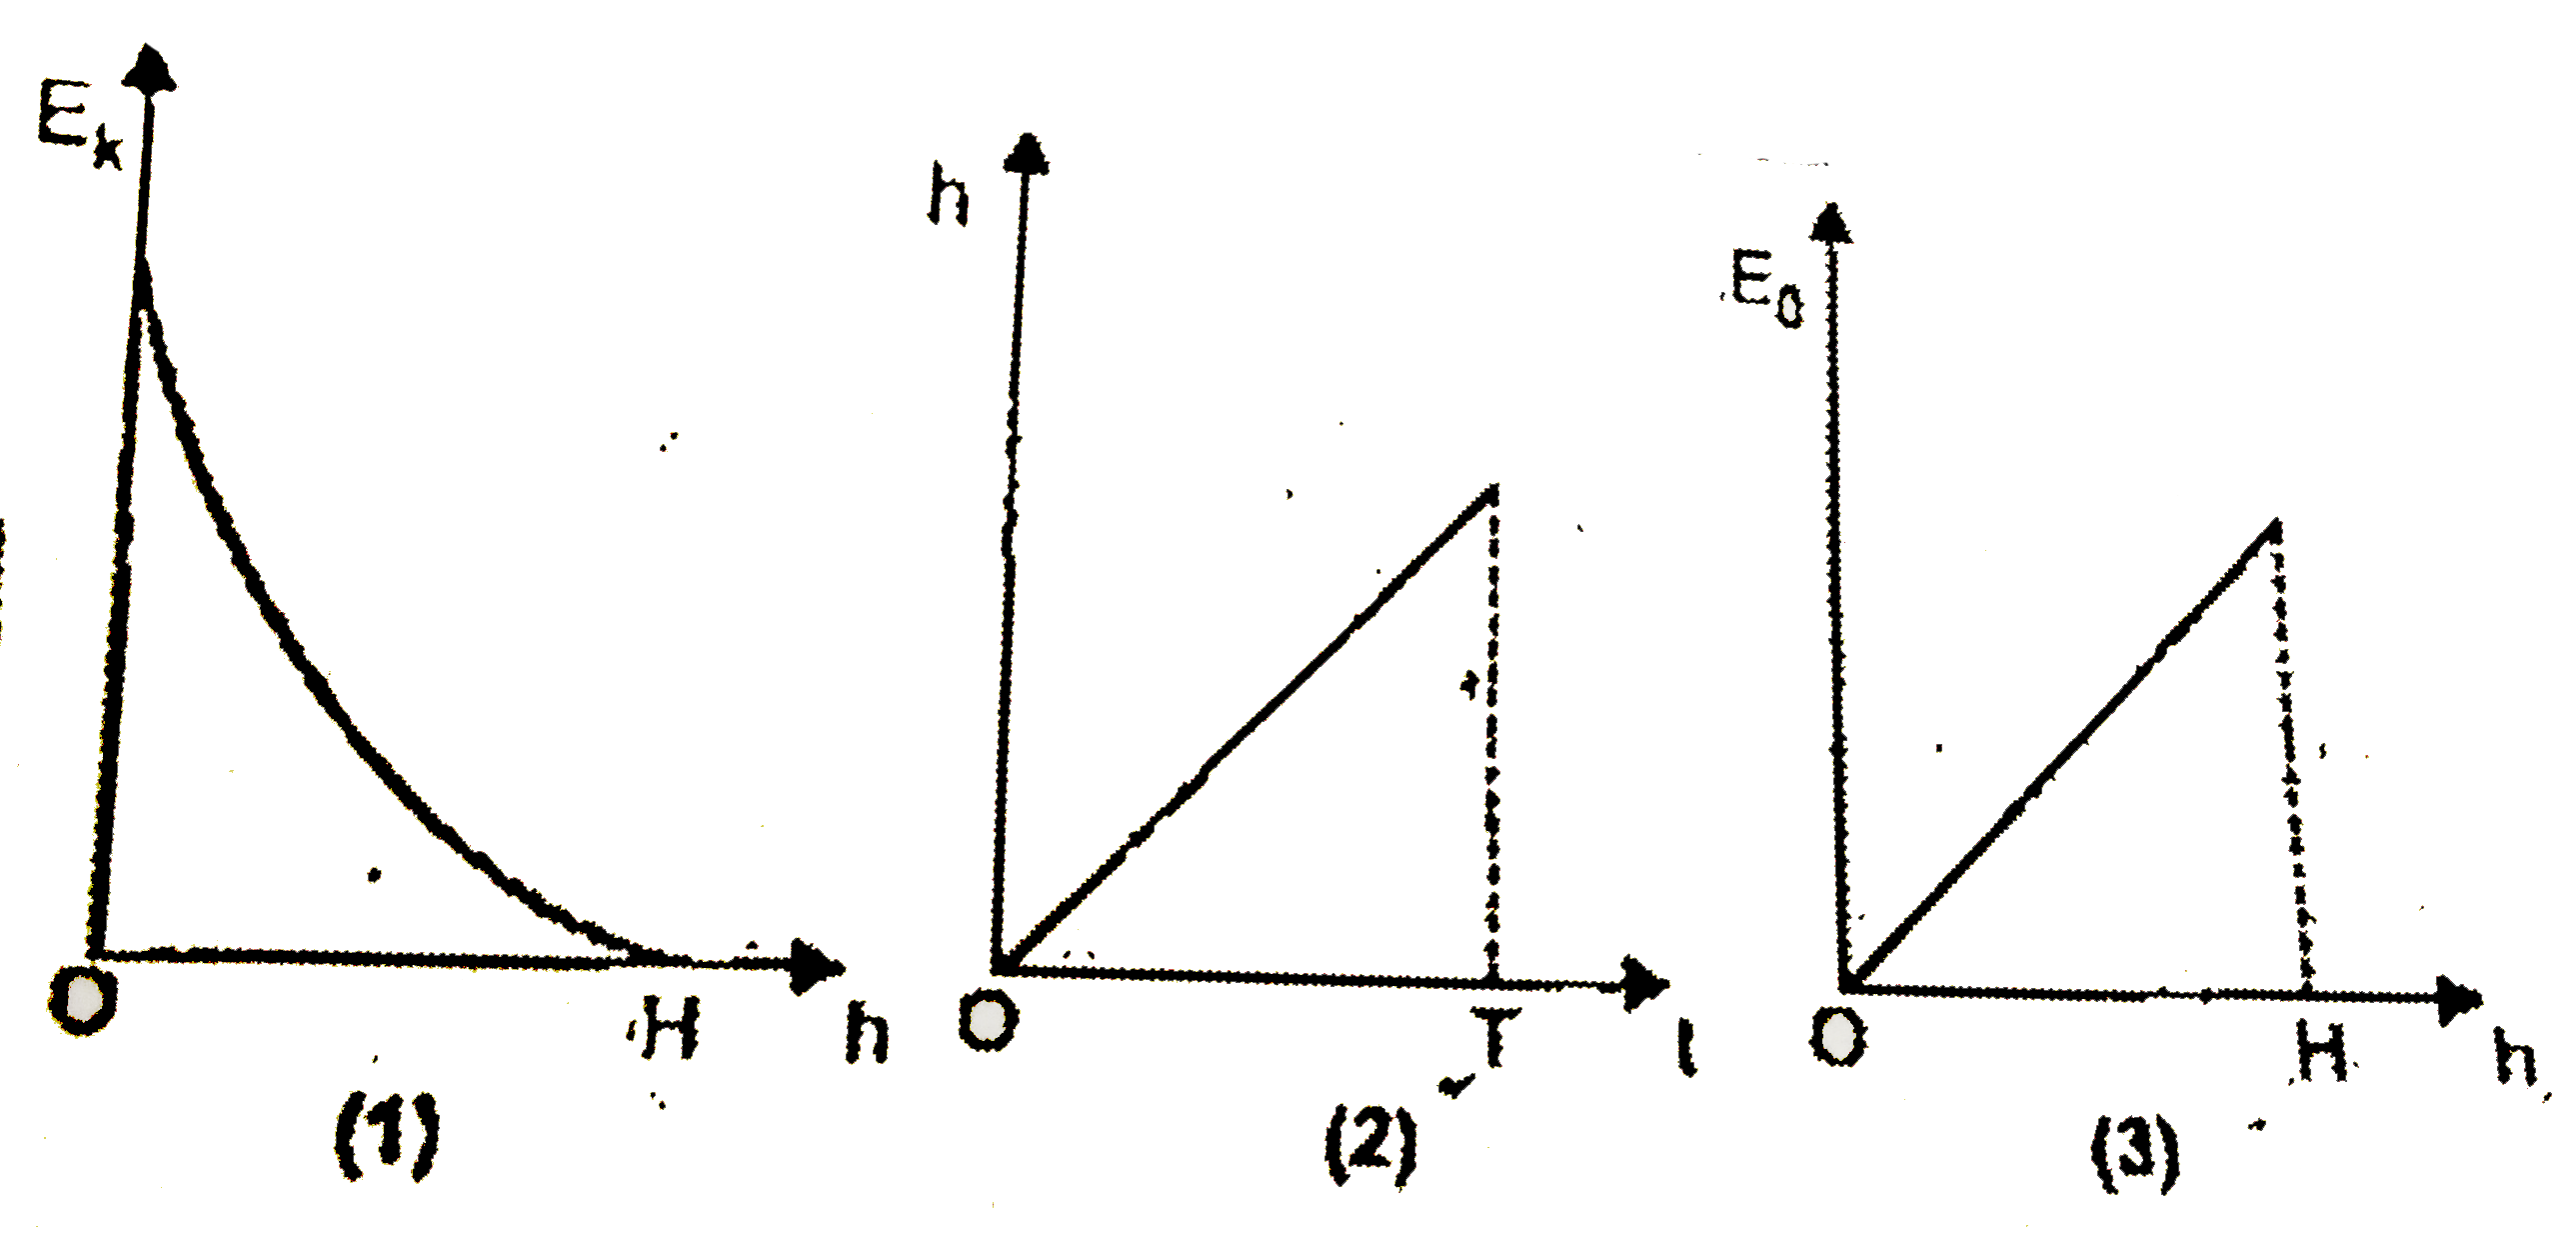
A ball is projected vertically upwards. Air resistance and variation in g may be neglected. The ball rises to its maximum height H in a time T, the height being h after a time t :
(1) The graph of kinetic energy Ek of the ball against height h is shown in figure 1
(2) The graph of height h against time t is shown in figure 2
(3) The graph of gravitational energy Ek of the ball against height h is shown in figure 3
(1)
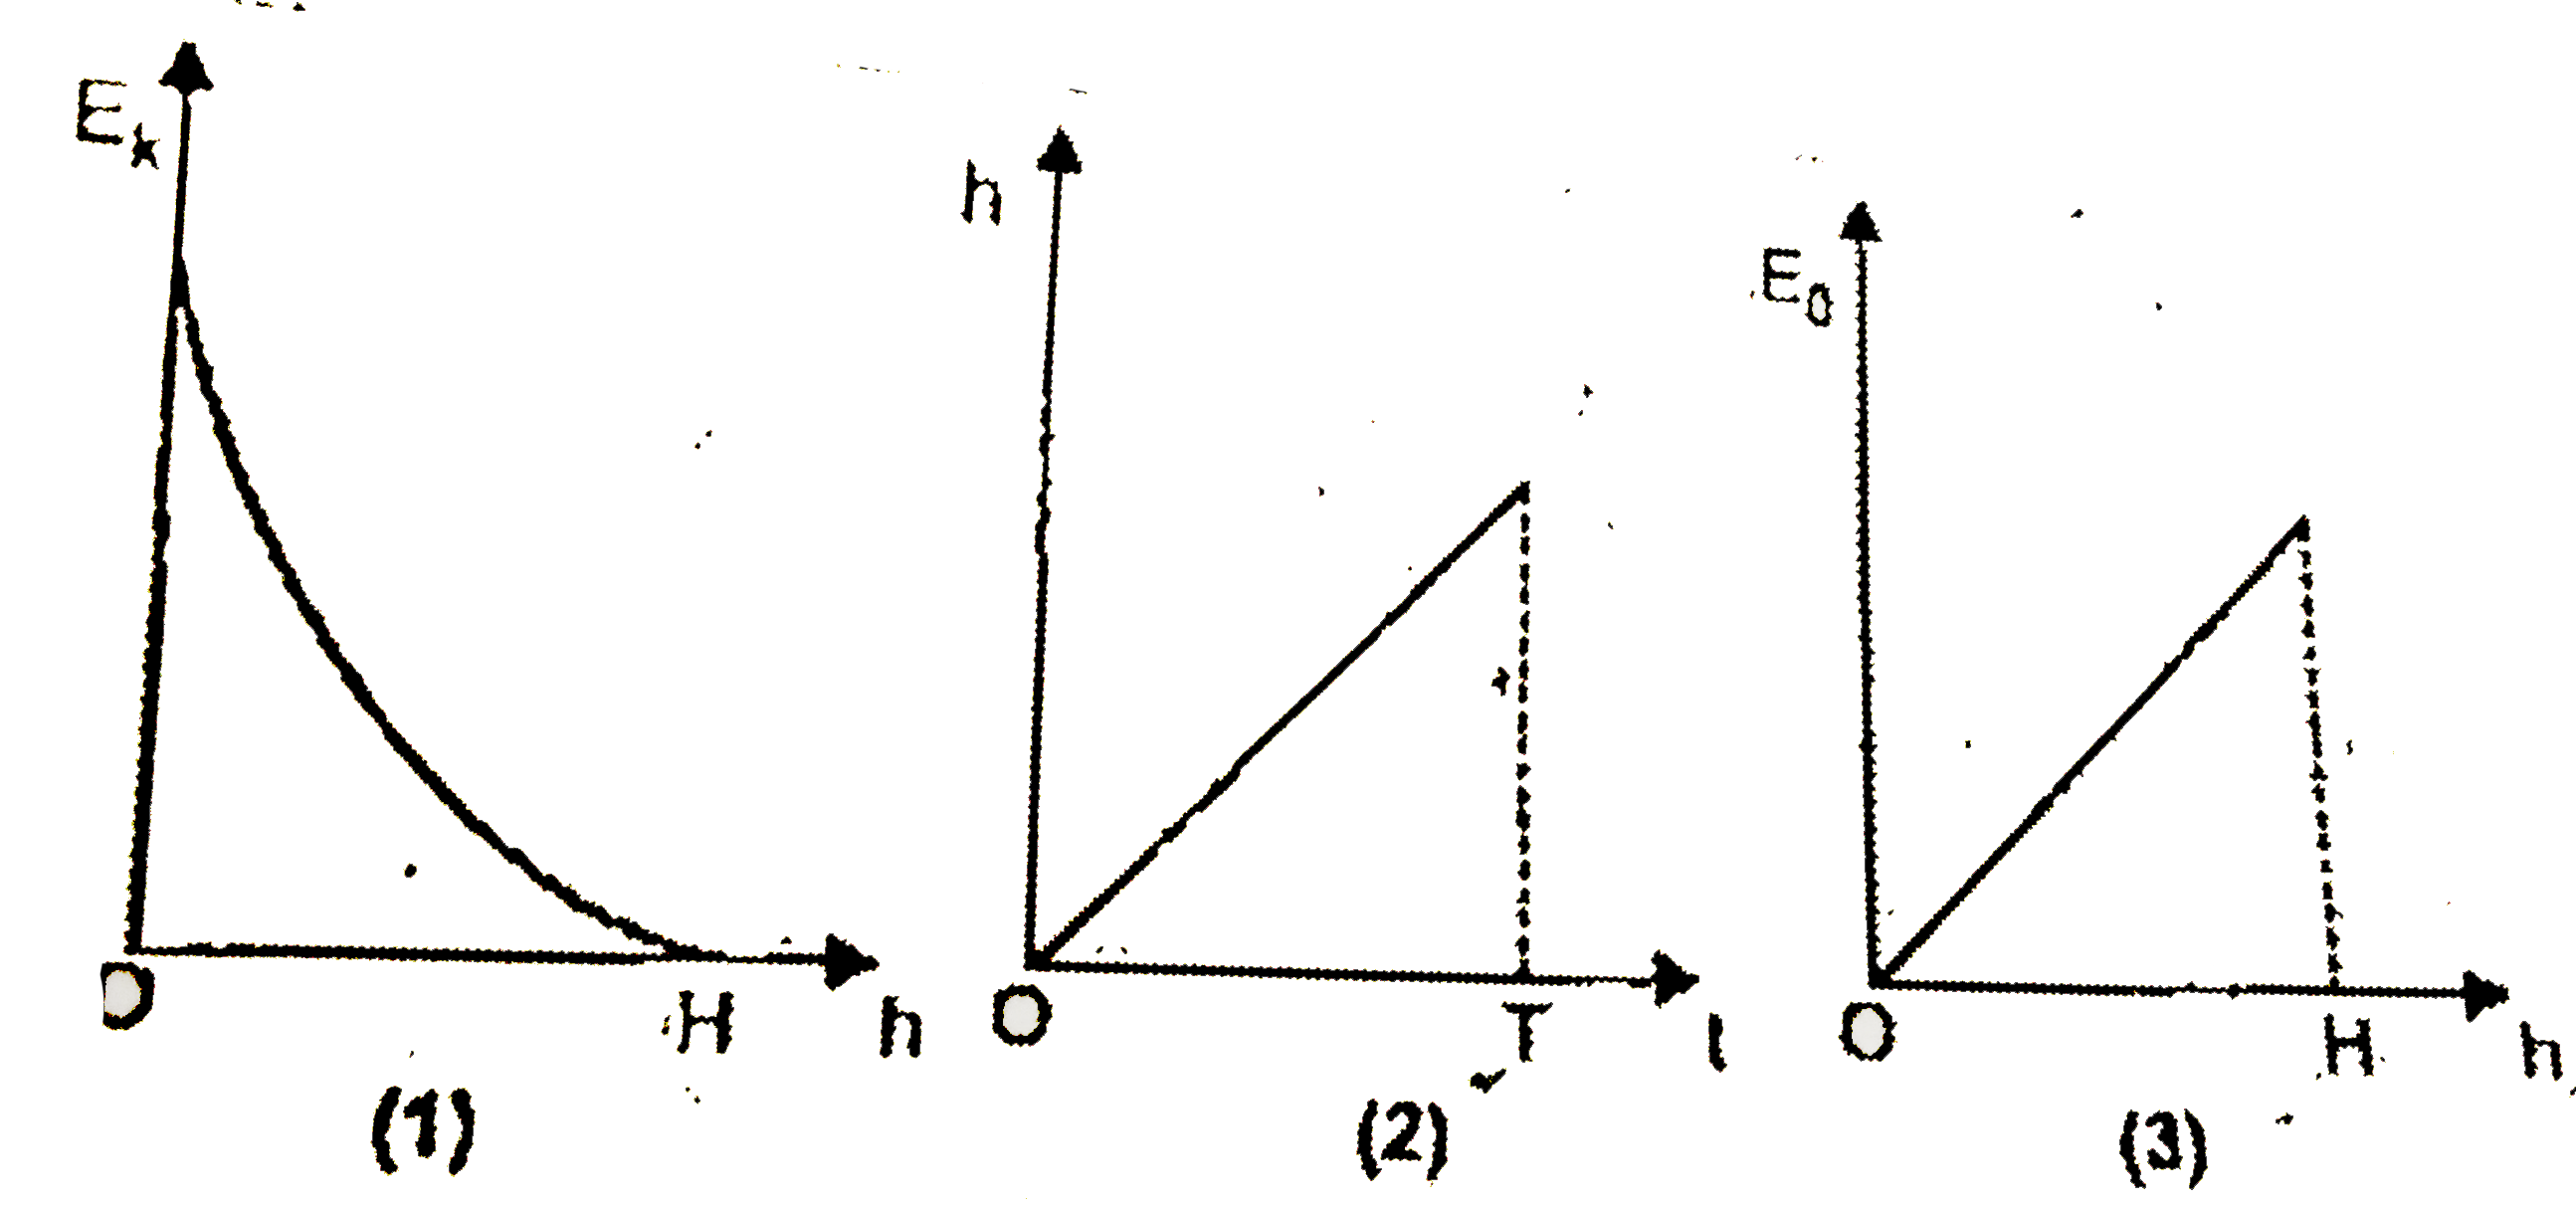
-Which the figure shows the correct answers ?A3 onlyB1, 2C2, 3D1 onlyA ball is projected vertically upwards. Air resistance and variation in g may be neglected. The ball rises to its maximum height H in a time T, the height being h after a time t :
(1) The graph of kinetic energy Ek of the ball against height h is shown in figure 1
(2) The graph of height h against time t is shown in figure 2
(3) The graph of gravitational energy Ek of the ball against height h is shown in figure 3
(1)
(2)
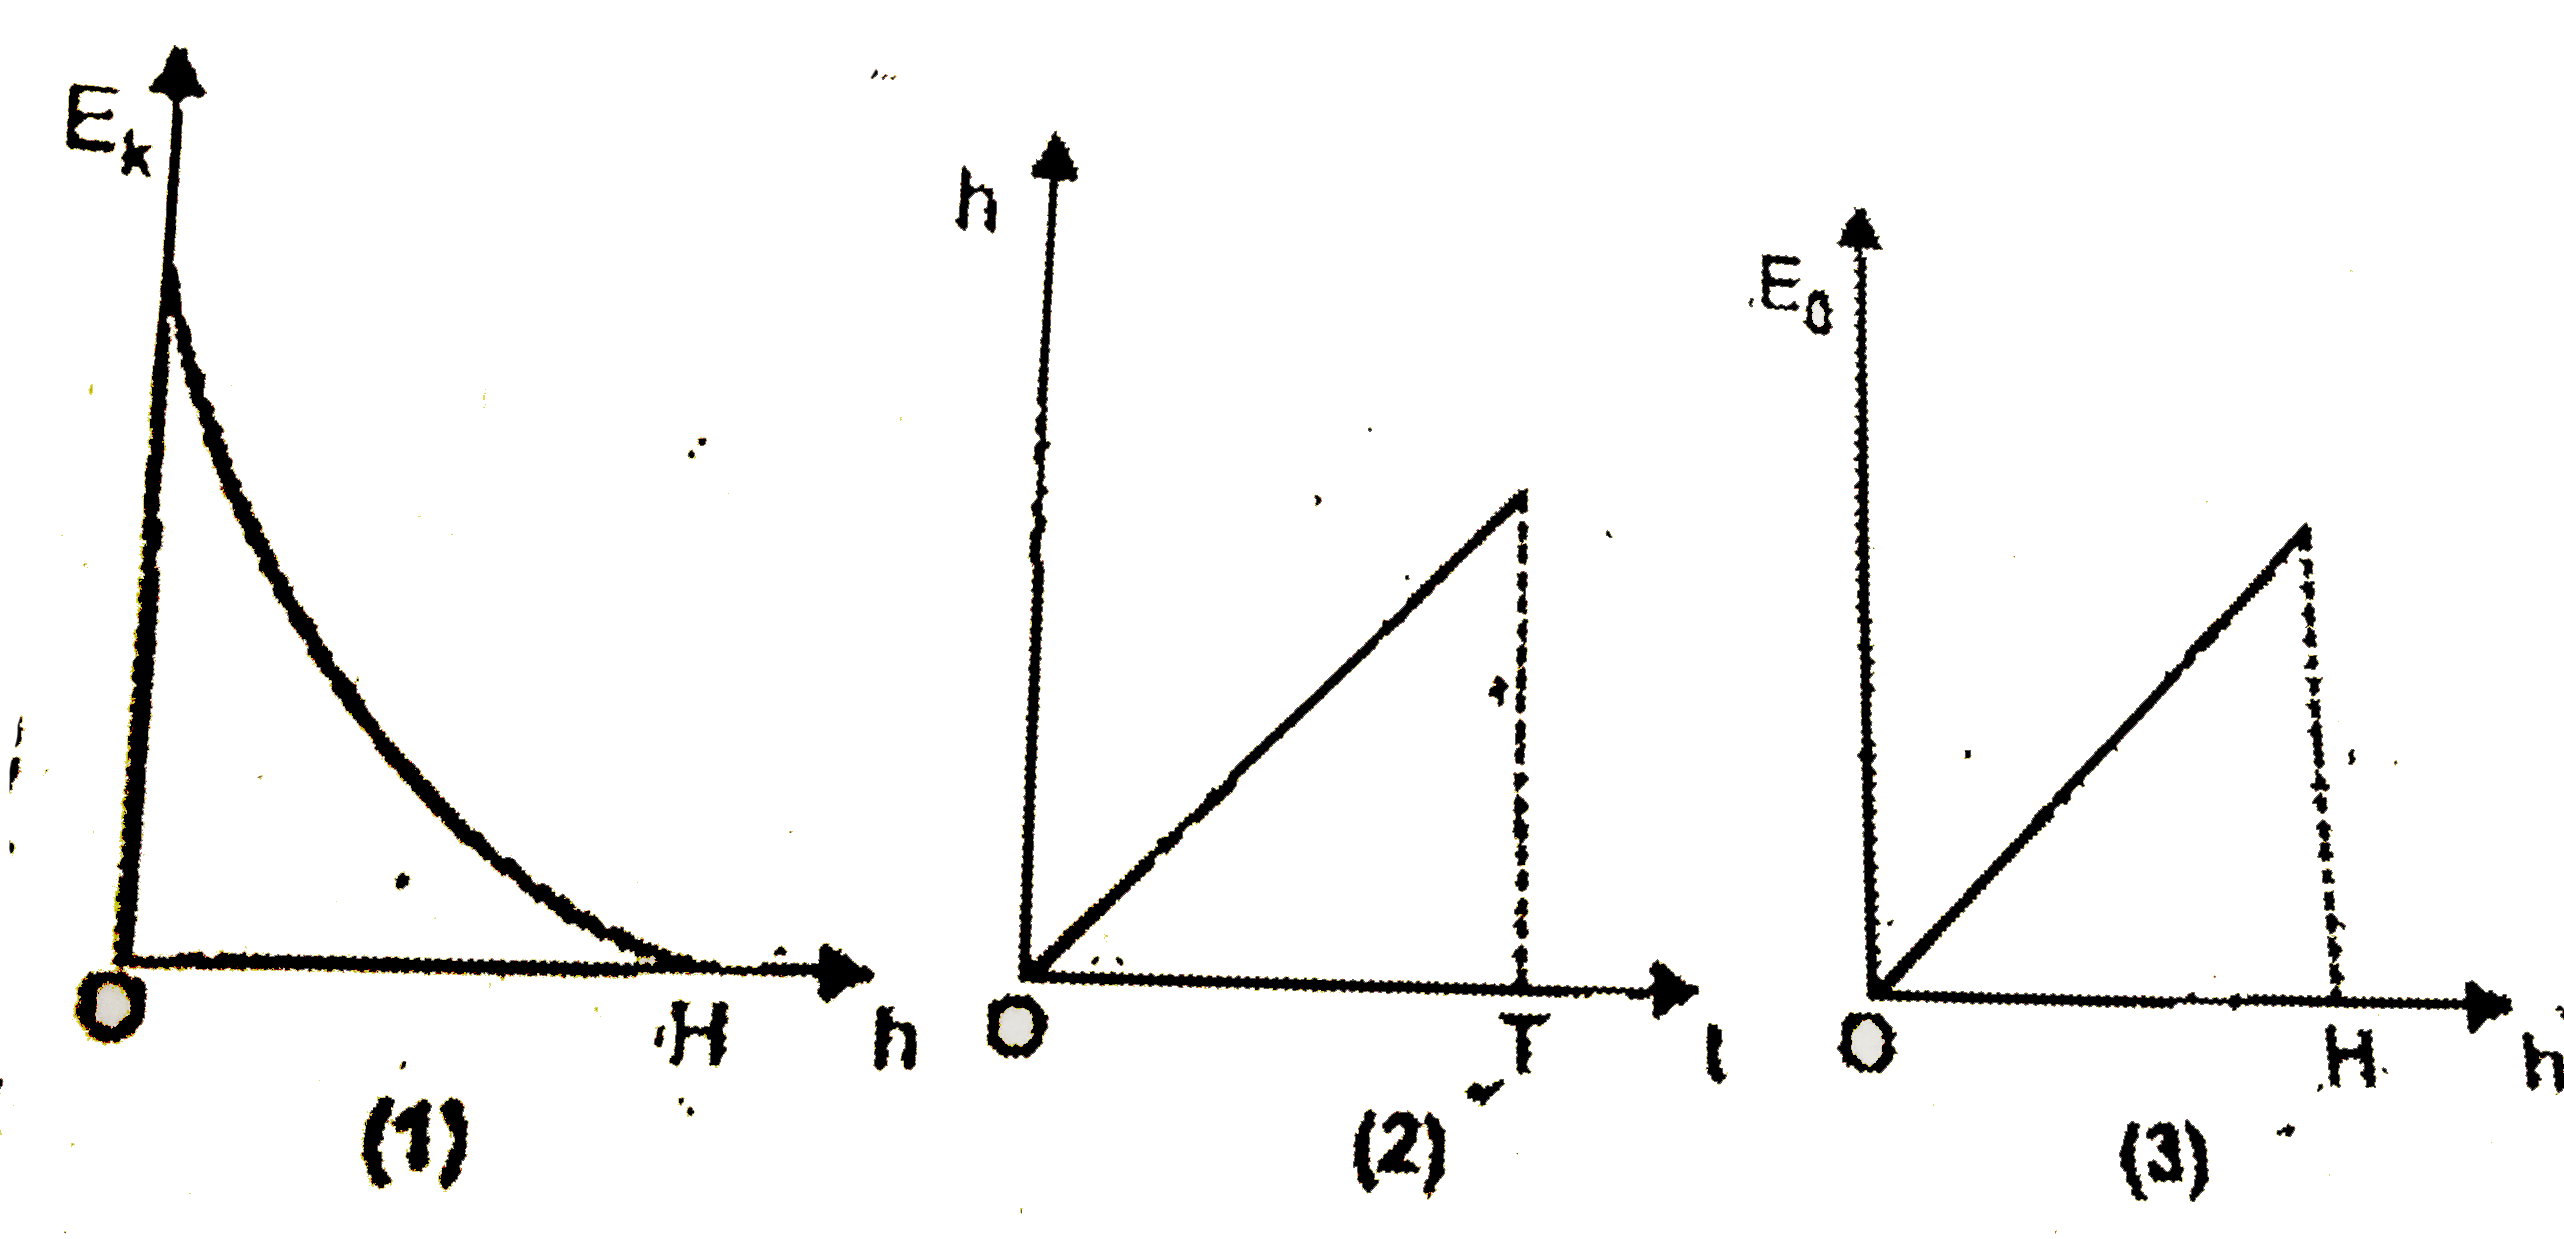
In the above situation the block wili have maximum velocity when:Athe spring force becomes zeroBthe frictional force becomes zeroCthe net force becomes zeroDthe acceleration of block becomes zeroA ball is projected vertically upwards. Air resistance and variation in g may be neglected. The ball rises to its maximum height H in a time T, the height being h after a time t :
(1) The graph of kinetic energy Ek of the ball against height h is shown in figure 1
(2) The graph of height h against time t is shown in figure 2
(3) The graph of gravitational energy Ek of the ball against height h is shown in figure 3
(1)
Two particles move on a circular path ( one just inside and the other just outside) with angular velocities ro and 5ω starting from the same point. Then :Athey cross each other at regular intervals of time 2π4ω when their angular velocities are oppositely directedBthey cross each other at points on the path subtending an angle of 60∘ at the centre if their angular velocities are oppositely directedCthey cross at intervals of time π3ω if their angular velocities are oppositely directedDthey cross each other .at points on the path subtending 90∘ at the centre if their angular velocities are in the same sense
A ball thrown upwards takes 4 s to reach the maximum height. Find the initial speed with which it was thrown.
View SolutionA ball is thrown vertically upwards with a speed of 9.8 m/s from the ground. Draw the x-t, v-t and a-t graph for its motion.
View SolutionA stone thrown vertically upward satisfies the equation s=64t−16t2 where is in meter and t is second .What is the time required to reach the maximum height ?
View SolutionA ball is thrown vertically upwards. Which of the following plots represents the speed-time graph of the ball during its height if the air resistance is not ingnored ?
View SolutionA ball is thrown vertically with some velocity . A constant air resistance acts. If the time of ascent is t1 and that of descent is t2 , then
View Solution

