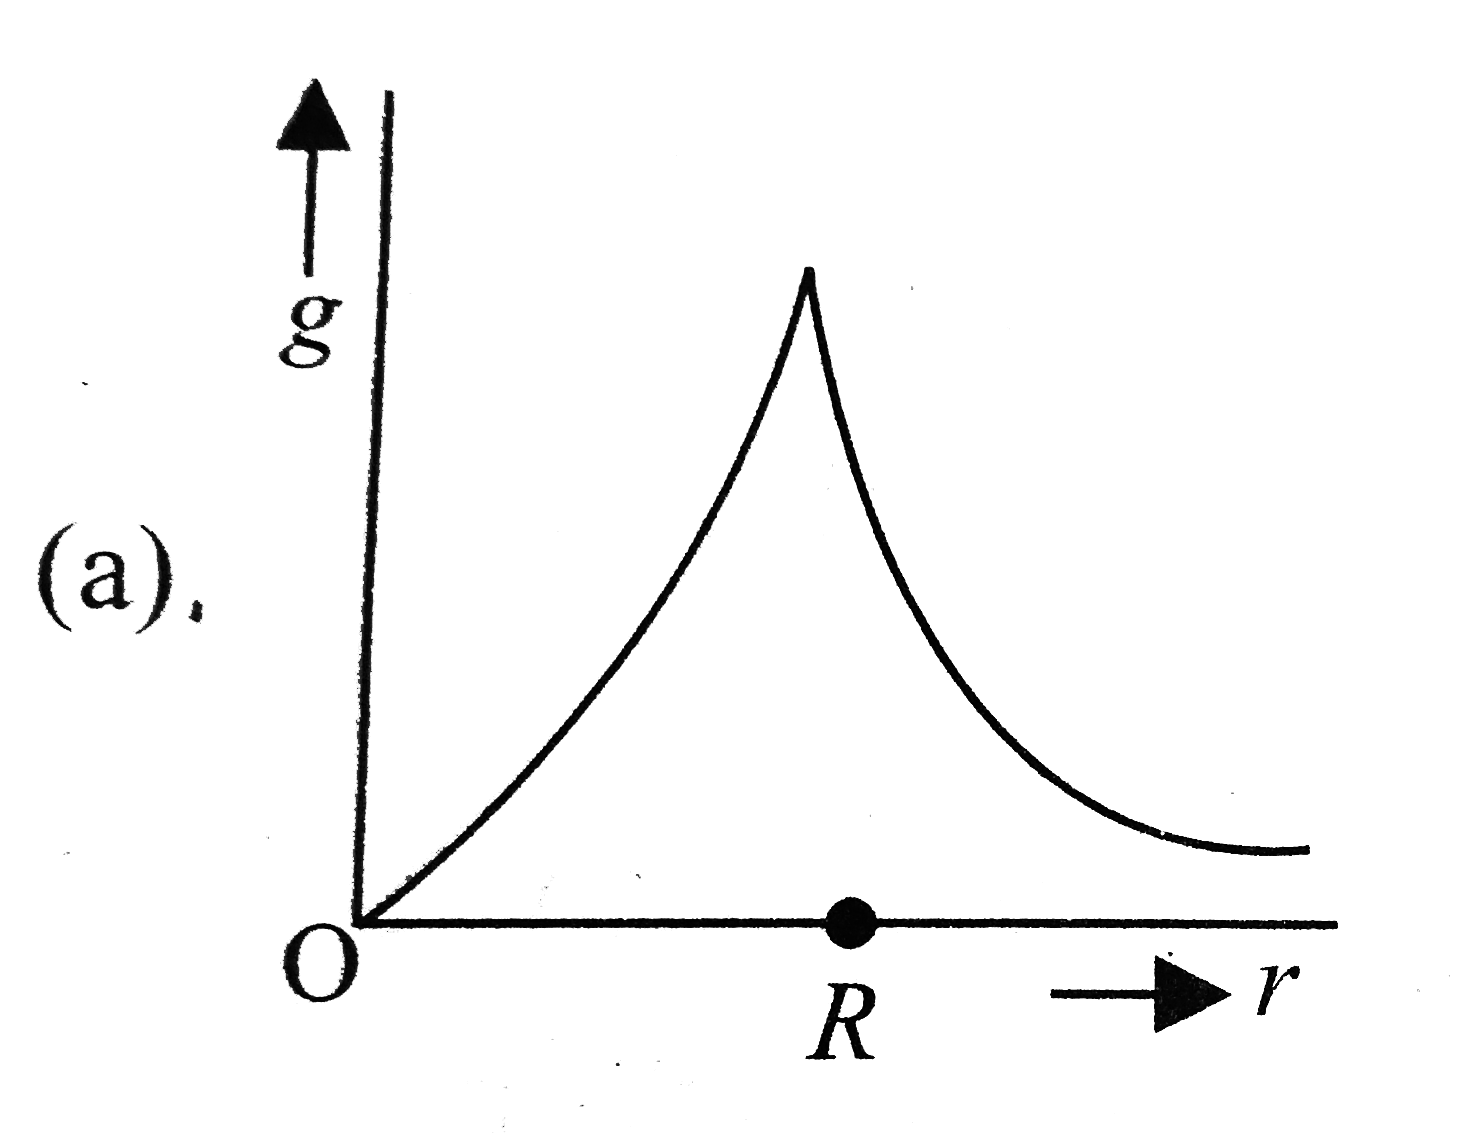
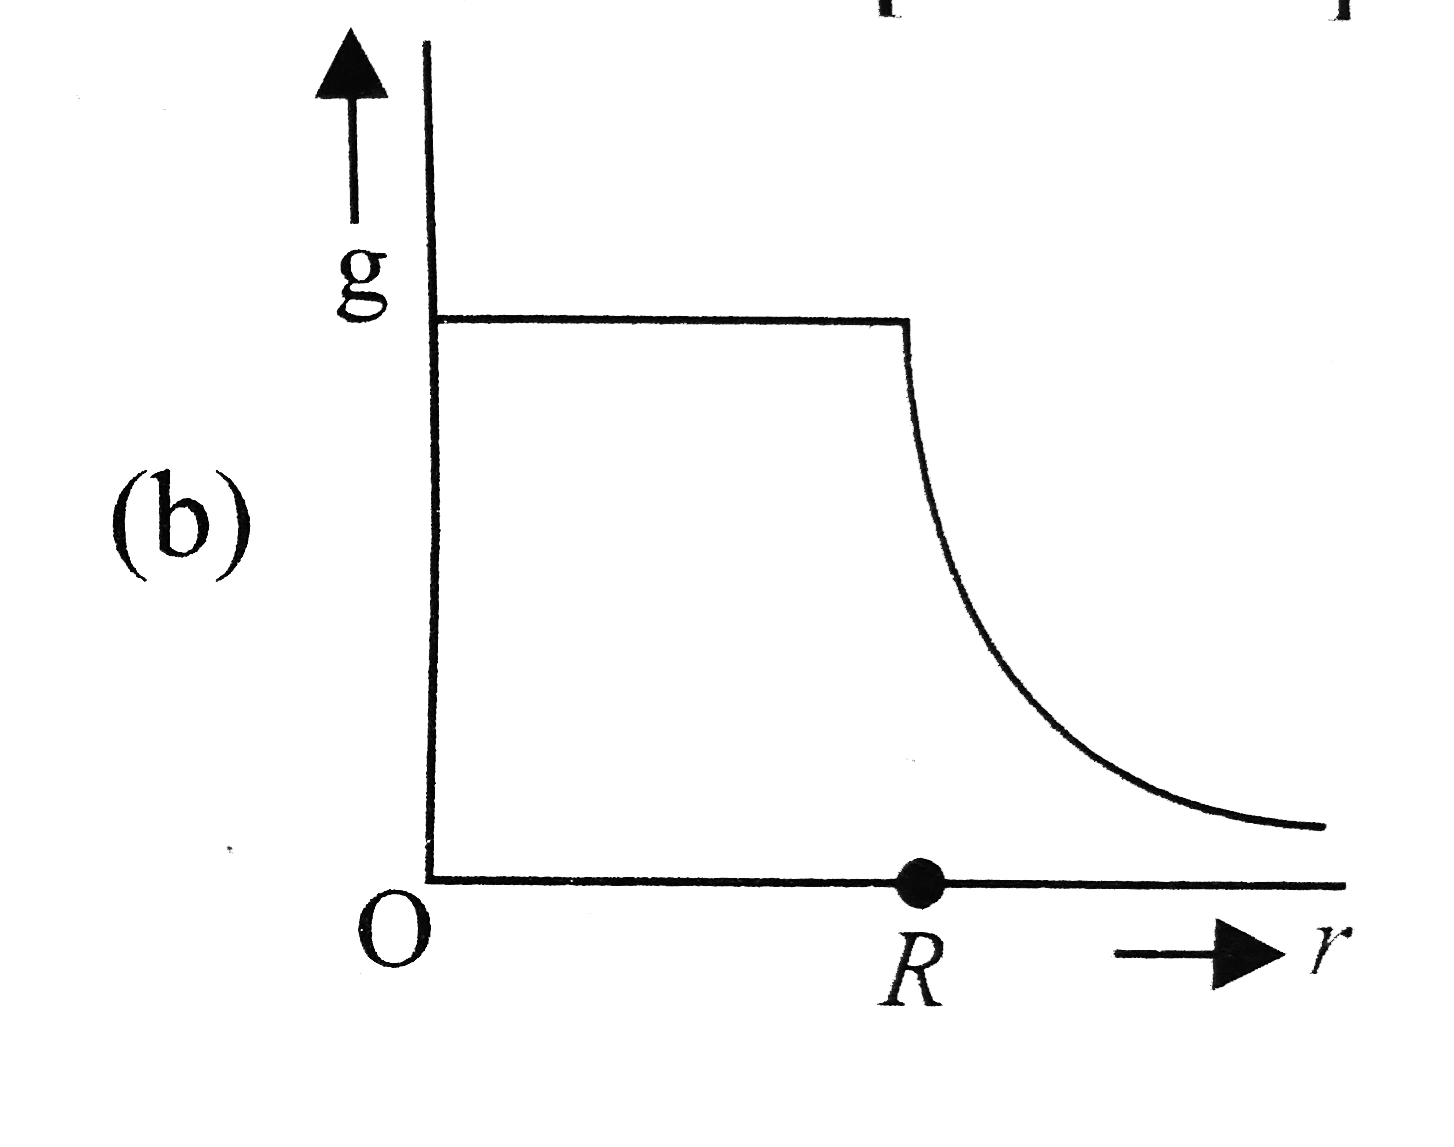
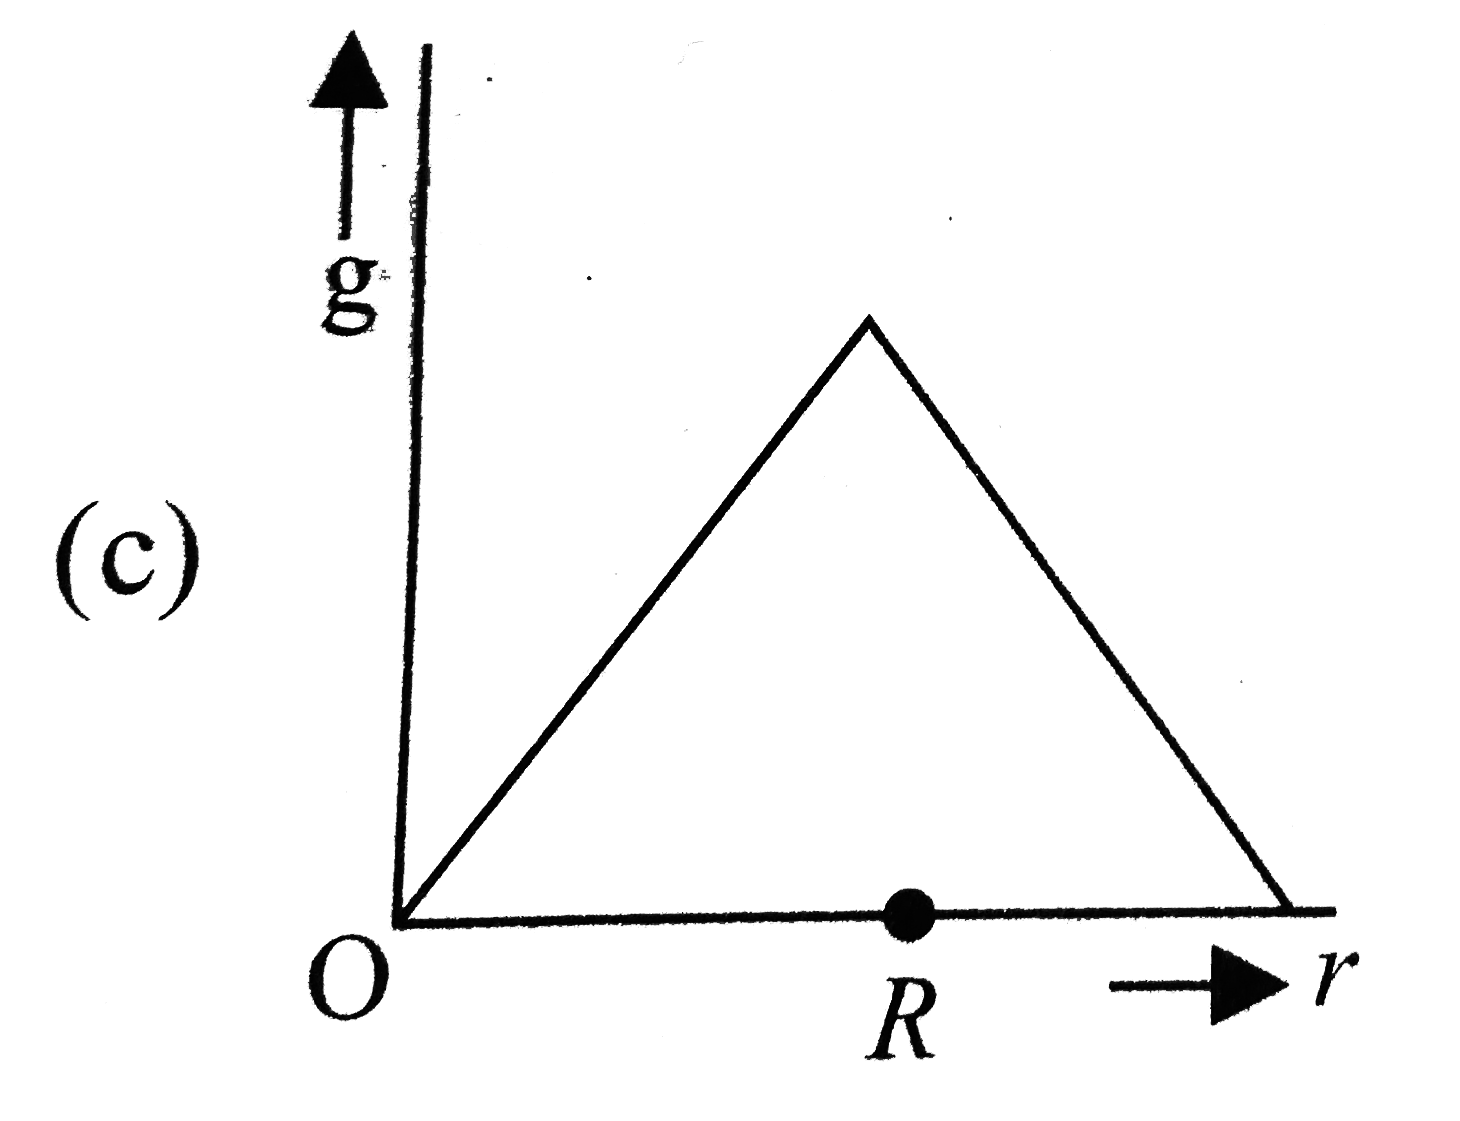
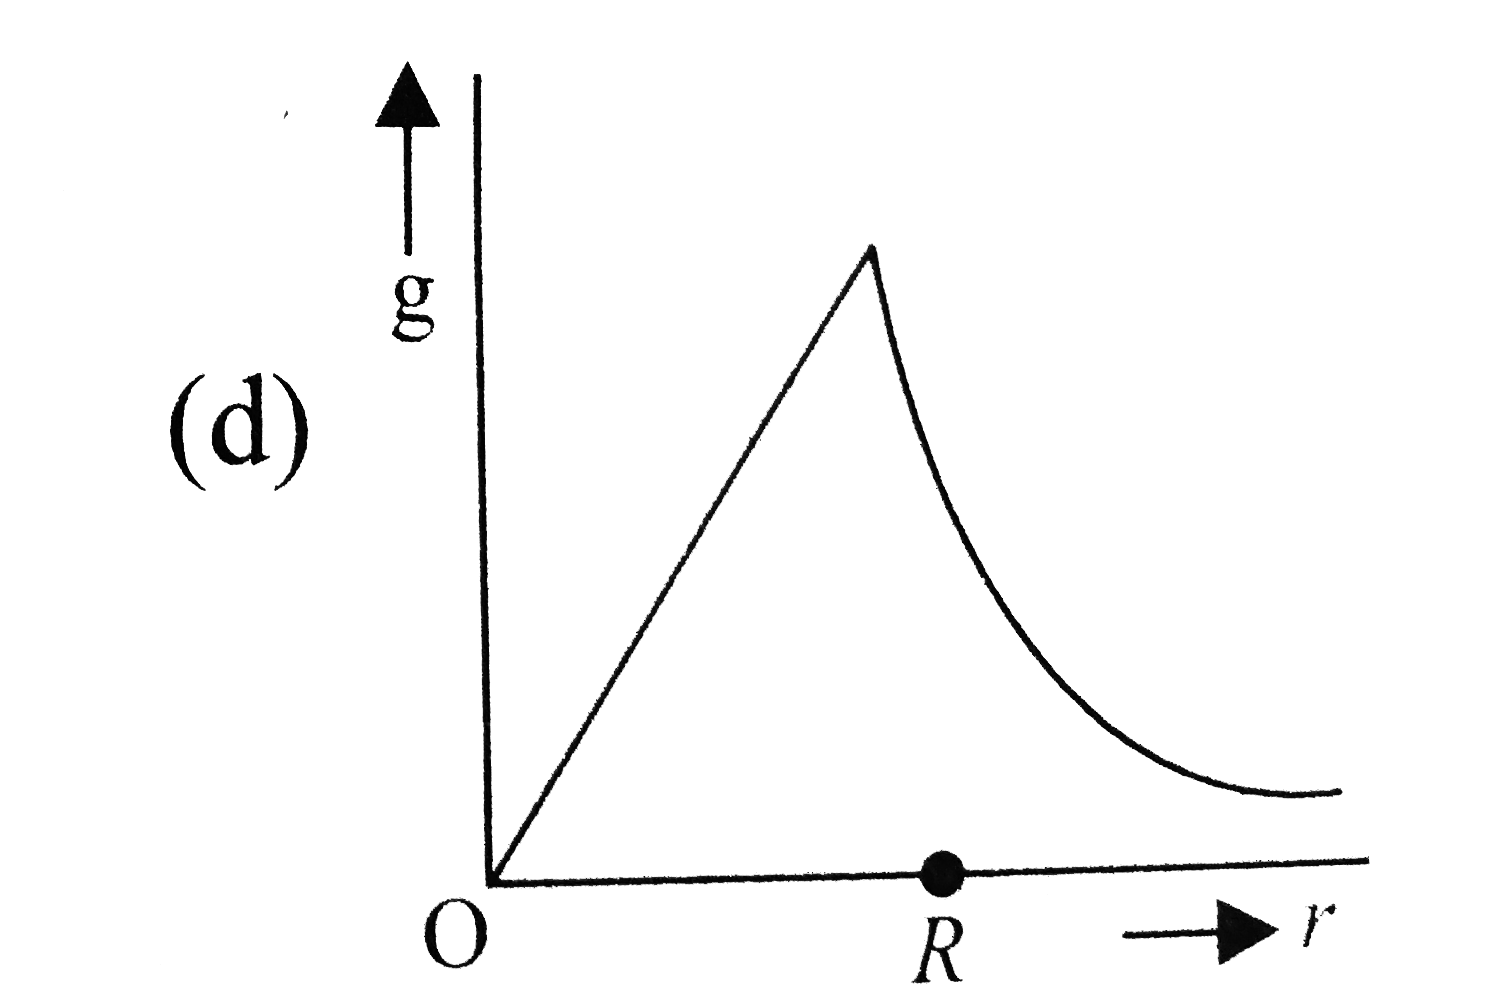
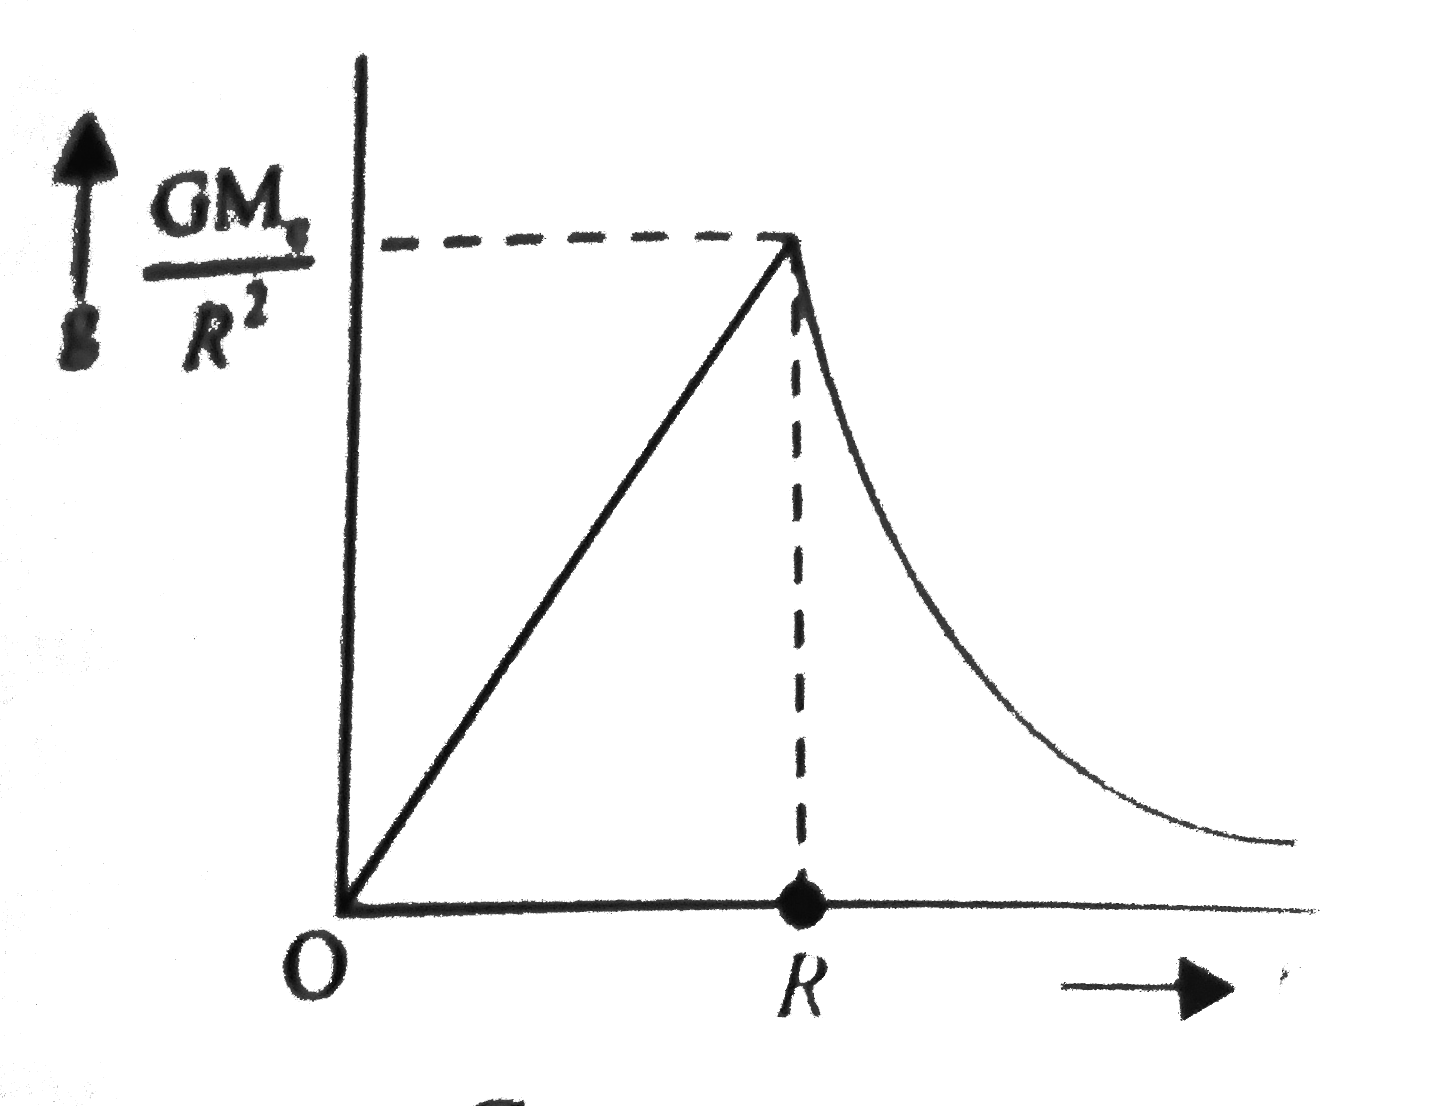
Which graph correctley presents the variation of acceleration due to gravity with the distance form the centre of the earth?
A
B
C
D
Video Solution
Text Solution
The correct Answer is:D
g=(GMeR3e)r,0<r≤R
g=GMer2,r≥Re
|
Topper's Solved these Questions
- GRAVITATIONBOOK - A2ZCHAPTER - GRAVITATIONEXERCISE - AIIMS Questions
21 Videos
- GRAVITATIONBOOK - A2ZCHAPTER - GRAVITATIONEXERCISE - Chapter Test
29 Videos
- GRAVITATIONBOOK - A2ZCHAPTER - GRAVITATIONEXERCISE - Assertion Reasoning
16 Videos
- GENERAL KINEMATICS AND MOTION IN ONE DIMENSIONBOOK - A2ZCHAPTER - GENERAL KINEMATICS AND MOTION IN ONE DIMENSIONEXERCISE - Chapter Test
30 Videos
- KINETIC THEORY OF GASES AND THERMODYNAMICSBOOK - A2ZCHAPTER - KINETIC THEORY OF GASES AND THERMODYNAMICSEXERCISE - Chapter Test
29 Videos
Similar Questions
Knowledge Check
The value of acceleration due to gravity of the earth is
A98m/s2B9.8m/s2C0.98m/s2D0.098m/s2The value of acceleration due to gravity of earth :
Ais the same on equator and polesBis the least on polesCis the least on equatorDincrease from pole to equatorThe graph showing acceleration due to gravity of the earth from the center of the earth is
A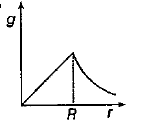 B
B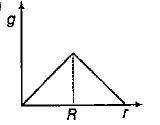 C
C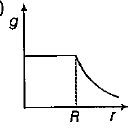 D
D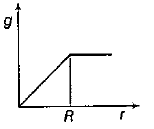
Find the acceleration due to gravity at a distance of 20000 km from the centre of the earth.
View SolutionVariation In Acceleration Due To Gravity
View SolutionWhat is the value of acceleration due to gravity on the surface of earth ?
View SolutionThe value of acceleration due to gravity at the surface of earth
View SolutionThe acceleration due to gravity on the surface of earth varies
View Solution
