All the students of a class performed poorly in Mathematics. The teacher decided to give grace marks of 10 to each of the students. Which of the following statistical measures will not change even after the grace marks were given ? (1) median (2) mode (3) variance (4) mean
y=x+10;¯¯¯¯.y=¯¯¯¯.x+10
σ=√∑(x−¯¯¯¯.x)n
=√∑(y−10−¯¯¯¯.y+10)n
=√∑(y−¯¯¯¯.y)n
variance does not change
option 3 is correct
Topper's Solved these Questions
Similar Questions
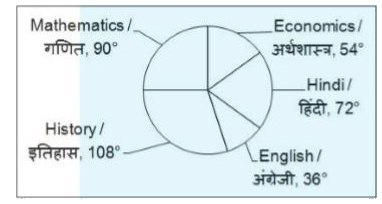
The pie chart given shows the number of marks scored by a student in the given 5 subjects. The total marks scored by the student is 480.

In which of the following 2 subjects the sum of marks scored by the student is equal to the marks scored in Mathematics?
View SolutionThe table given below represents the marks obtained by 5 students in 4 different subjects. Each student was given marks out of 100 in each of the given subjects.

In which subject the total marks of all the students is highest ?
View Solution
Knowledge Check
All the students of a class performed poorly in Mathematics. The teacher decided to give grace marks of 12 to the entire class. Which of the following statistical measures will not change even after the grace marks were given?
AMedianBModeCVarianceDMeanAll the student of a class performed poorly in mathematics the teacher decied to give gracs marks of 10 to each student which of the following statistical measures will not change even after the grace marks were given
AmeanBmedianCmodeDvarianceAll the students of a class performed poorly in physics. The teacher decided to give grace marks of 15 to the entire class. Which of the following statistical measures will not change even after the grace marks were given?
AmedianBmodeCvarianceDmean
The table given below represents the marks obtained by 5 students in 4 different subjects. Each student was given marks out of 100 in each of the given subjects.

Which student scored the maximum marks in all the 4 subjects taken together ?
View SolutionThe following table shows frequency distribution of marks of 100 students of 10th class which they obtianed in a practice examination. Find the median of the marks.

View SolutionThe mean deviation from the mean of the data given below is:
Marks 10 15 20 25 30
No. of Students 2 4 6 8 5
View SolutionThe ratio of marks obtained by a student in 3 subject was 1:2:3. The teacher decided to allow grace marks of 5% for each subject. Find the student' s new ratio.
View SolutionThe students in three classes are in the ratio 2:3:5. If 20 students are increased in each class, the ratio changes to 4:5:7. Originally the total number of students was :
View Solution
