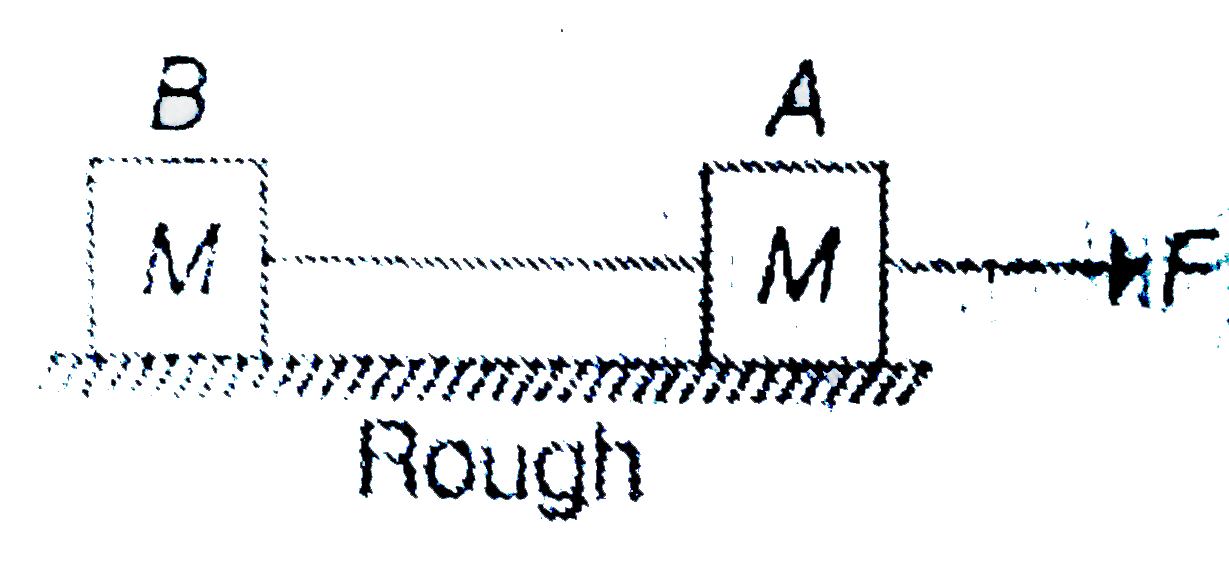
![A force F=t is applied to a block A as shoen in figure where t is time in seconds. The force is applied at t=0 seconds when the system was at rest. Which of the following graph correctly gives the frictional force between A and horizontal surface an a function of time t. [Assume that at t=0, tension in the string connecting the two blocks is zero].](https://d10lpgp6xz60nq.cloudfront.net/physics_images/BMS_DPP01_DPP7.4_E01_565_Q01.png)
A force F=t is applied to a block A as shoen in figure where t is time in seconds. The force is applied at t=0 seconds when the system was at rest. Which of the following graph correctly gives the frictional force between A and horizontal surface an a function of time t. [Assume that at t=0, tension in the string connecting the two blocks is zero].


The correct Answer is:C
Let mA and mB be the mass of blocks A and B respectively. As the force F increases from 0 to μsmag, the frictional force f on block A is such that f=F. When F=μsmAg, the frictional force f attains maximum value f=μSmg.
As F is further increased to μS(mA+mB)g, The block A does not move. In this duration frictional force on block A remains constant at μSmag.
Hence (c) is correct choice.
Similar Questions
Figure shows two blocks tied by a string. A variable force F=5t is applied on the block. The coefficient of friction for the blocks are 0.6 and 0.5 respectively. Find the frictional force between blocks and ground as well as tension in the string at t = 1s

View SolutionFigure shows two blocks tied by a string. A variable force F=5t is applied on the block. The coefficient of friction for the blocks are 0.6 and 0.5 respectively. Find the frictional force between blocks and ground as well as tension in the string at t = 2s

View Solution
Knowledge Check
A force F=t is applied to block A as shown in figure. The force is applied at t=0 seconds when the system was at rest and string is just straight without tension. Which of the following graphs gives the friction force between B and horizontal surface as a function of time 't'.
 A
A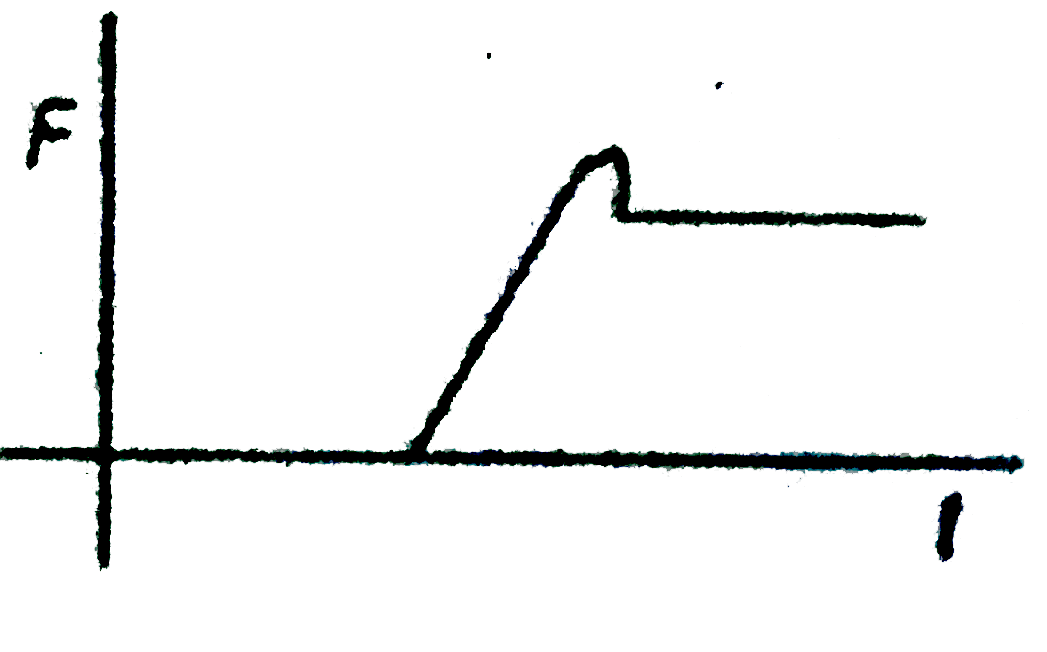 B
B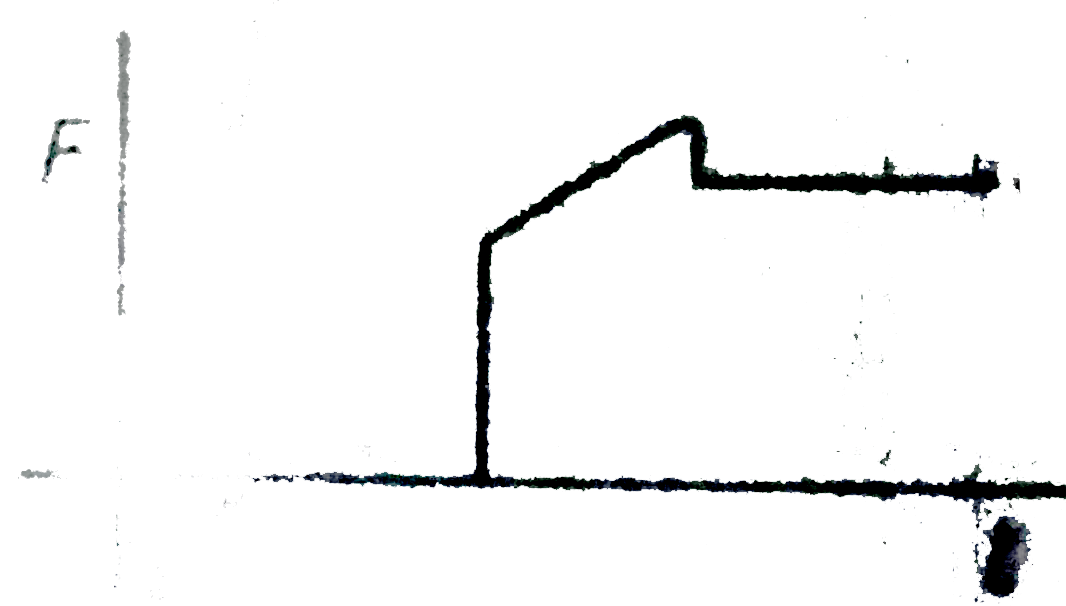 C
C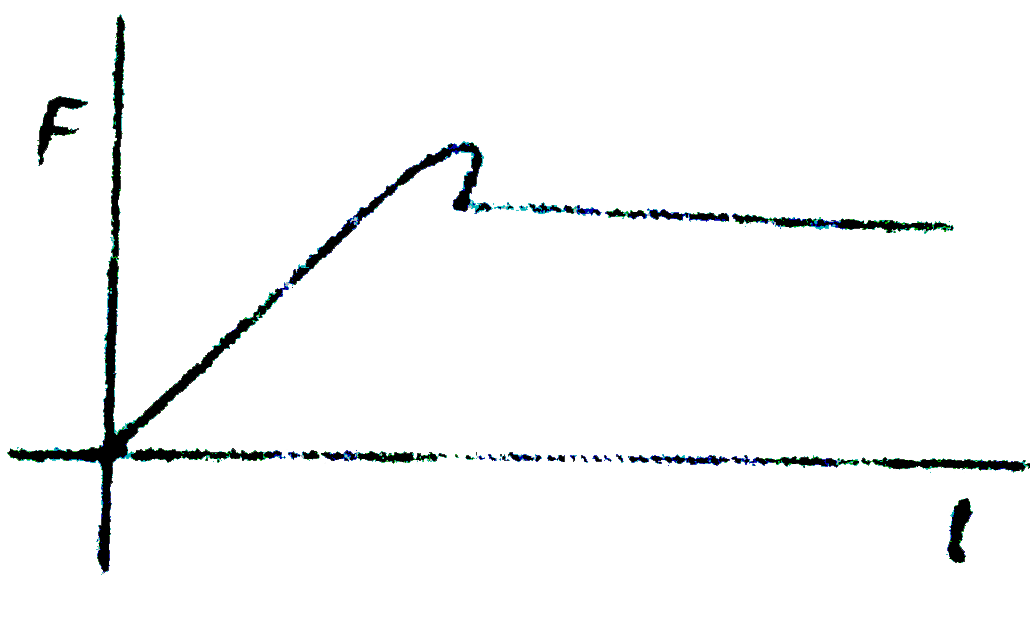 D
D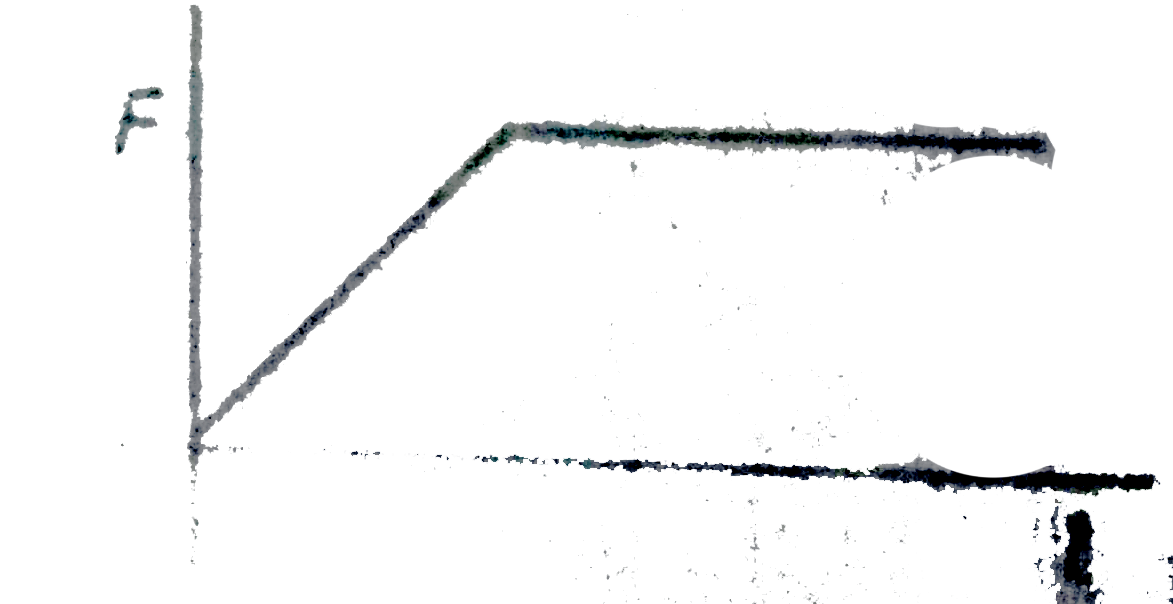
A block is resting over a smooth horizontal plane. A constant horizontal force starts acting on it at t=0. Which of the following graph is correct:
A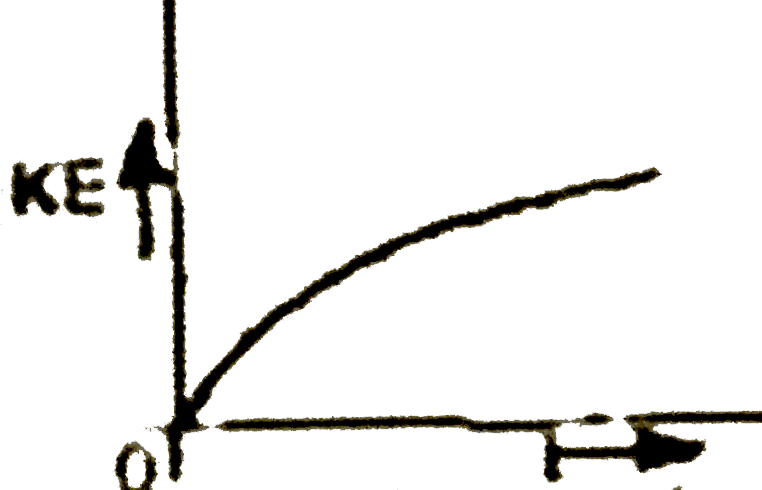 B
B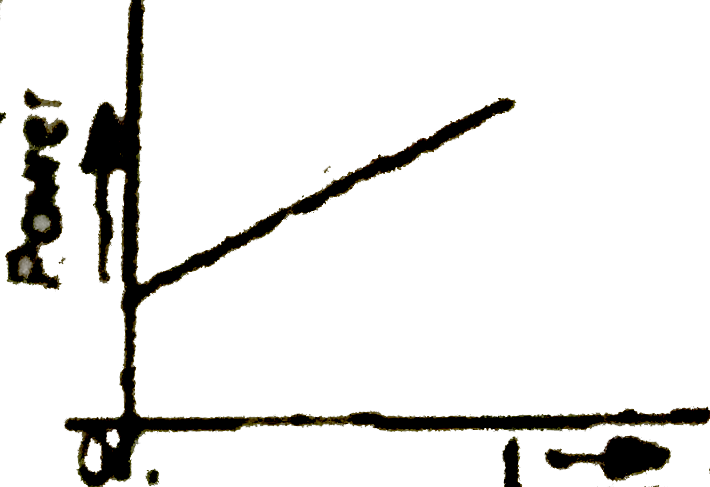 C
C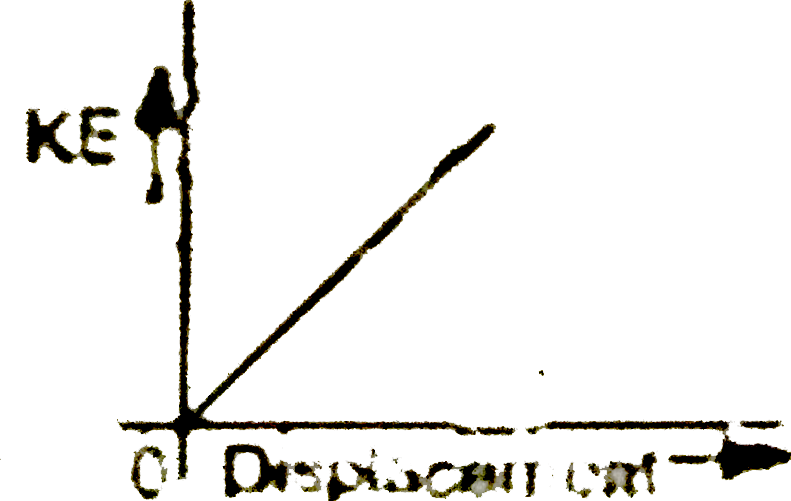 D
D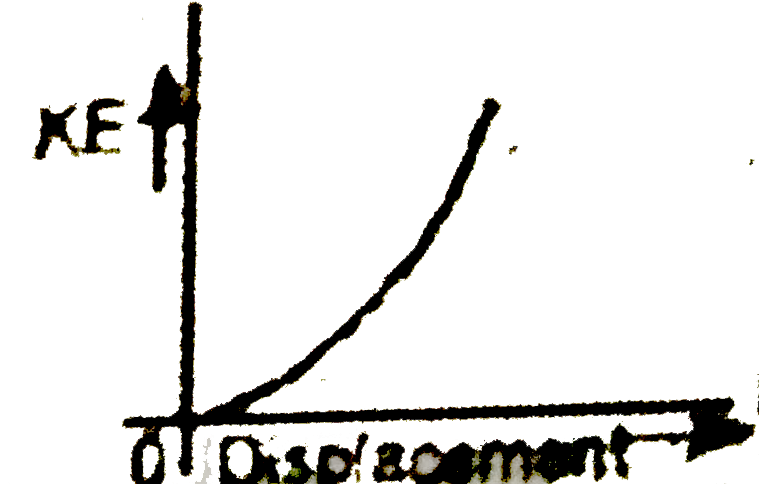
Force F is applied on upper pulley. If F = 30 t where t is time in second. Find the time when m1 loses contact with floor : (Take g=10m/s2)
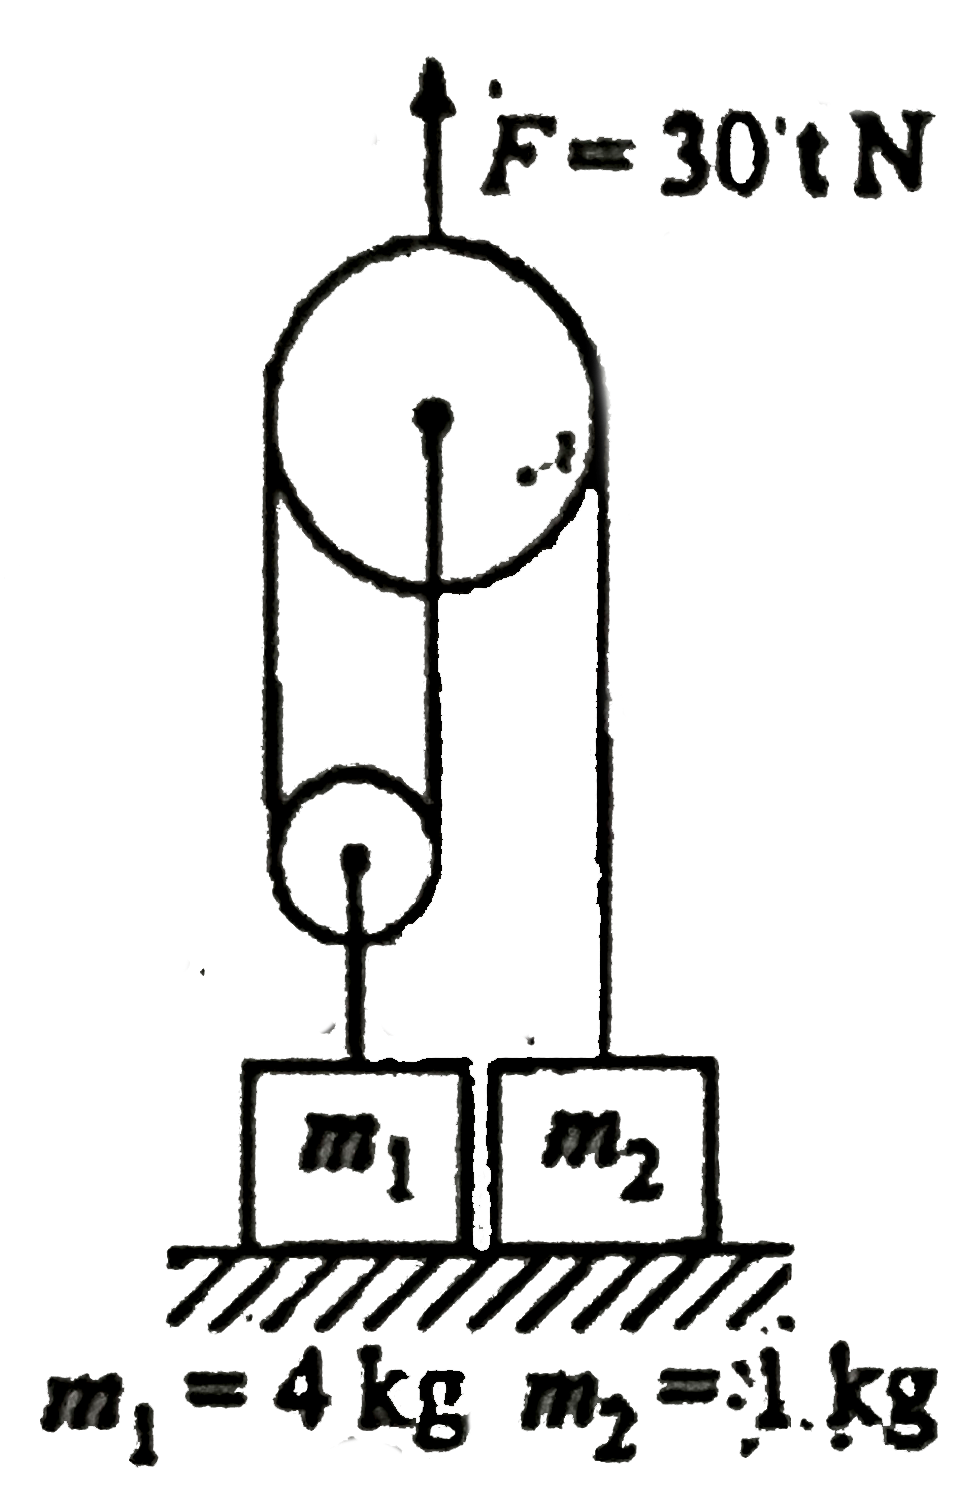 A1 secB1.66 secC2 secDNone of these
Figure shows two blocks tied by a string. A variable force F=5t is applied on the block. The coefficient of friction for the blocks are 0.6 and 0.5 respectively. Find the frictional force between blocks and ground as well as tension in the string at t =3s

View SolutionForce applied on a body is given by ltbygt F=(3t2−2t+10)N where t is in seconds. Find impulse imparted in t=0 to t=2 sec.
View SolutionThe force F = 2t2 is applied on the 2 kg block. Then find out the work done by this force in 2sec. Initially at time t = 0, block is at rest.
View SolutionThree blocks connected together by strings are pulled along a horizontal surface by applying a force F.IfF=36N What is the tension T2 ?.
 .
.
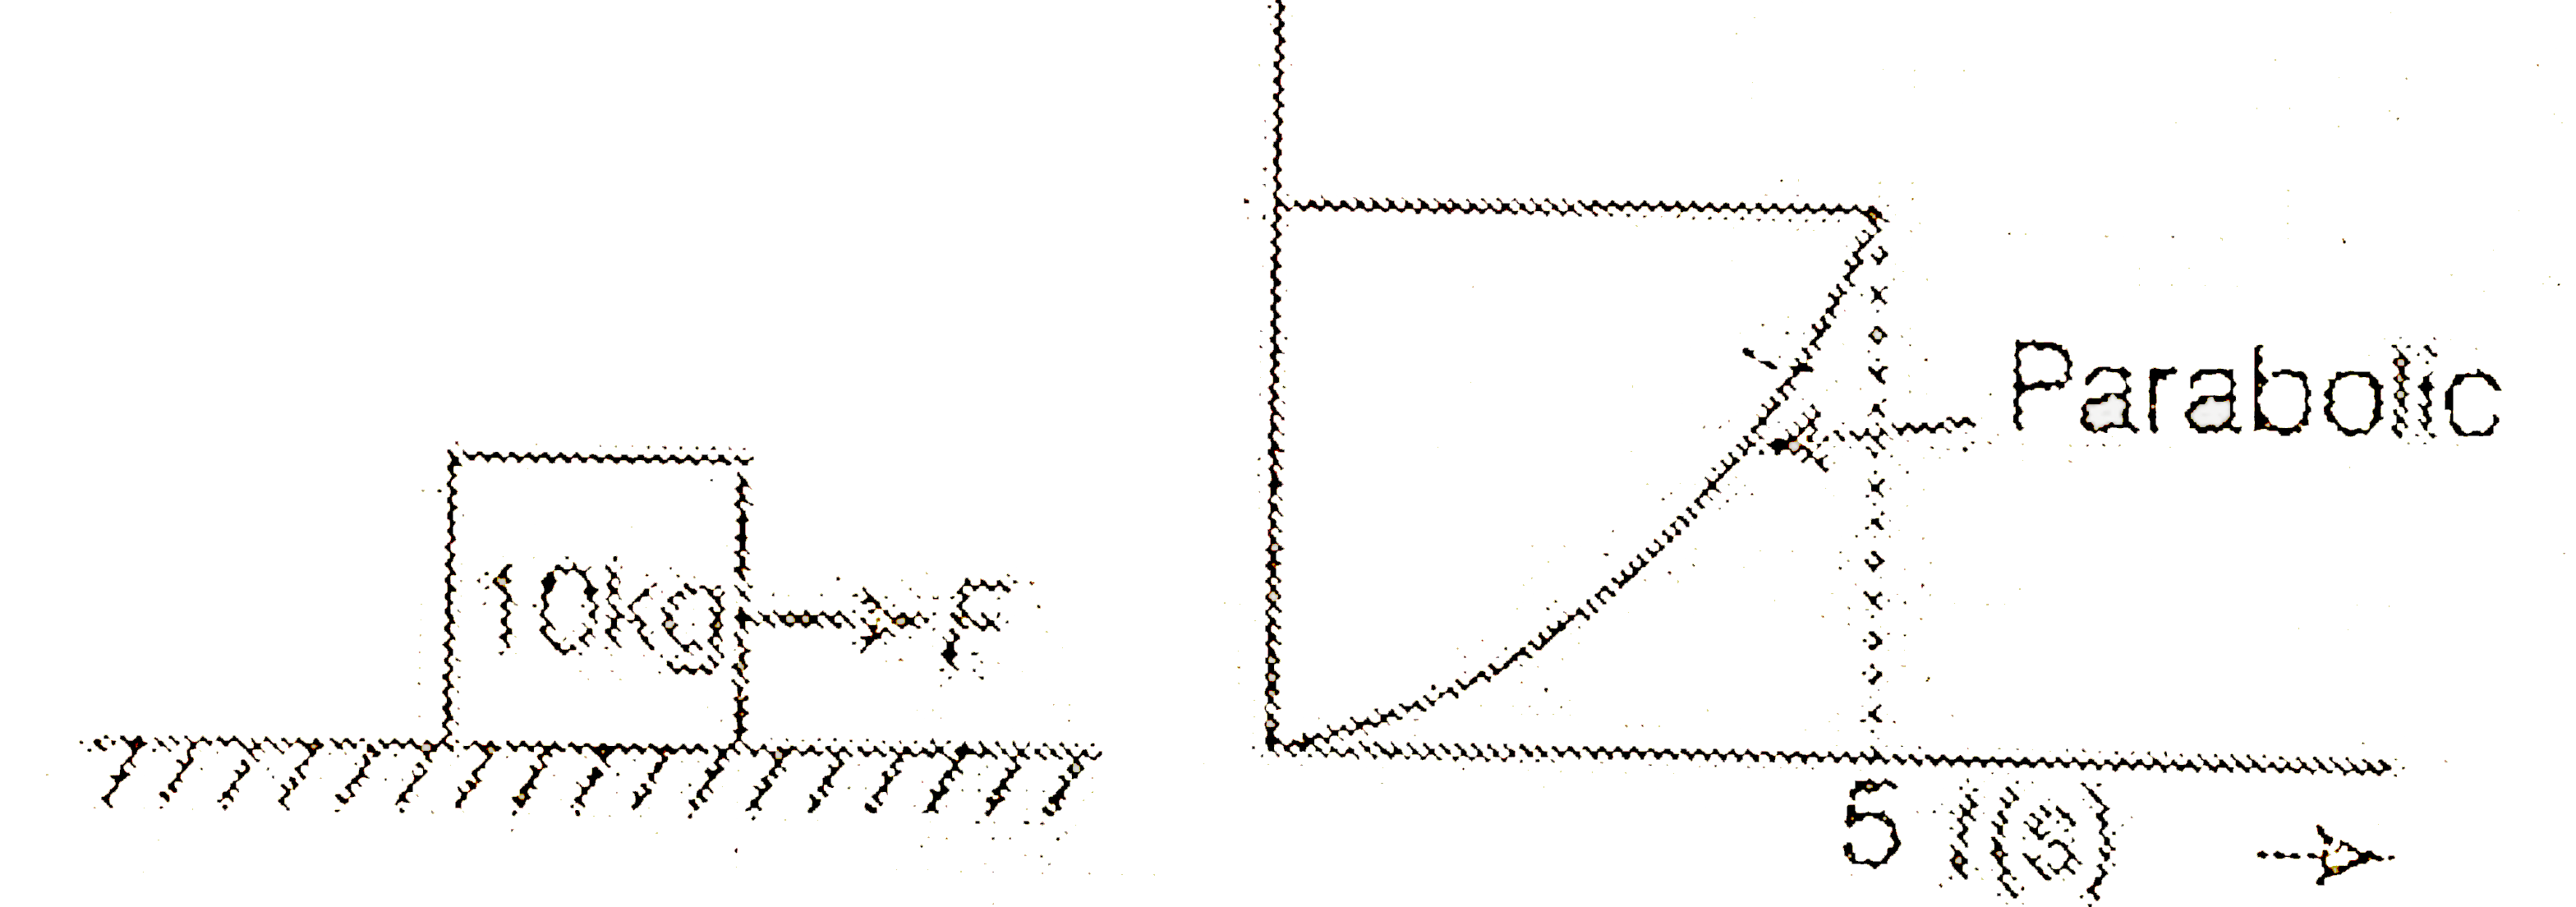
View SolutionA force F is applied to the initially, stationary cart. The variation of force with time is shown in the figure. The speed of cart at t = 5 s is
View Solution
