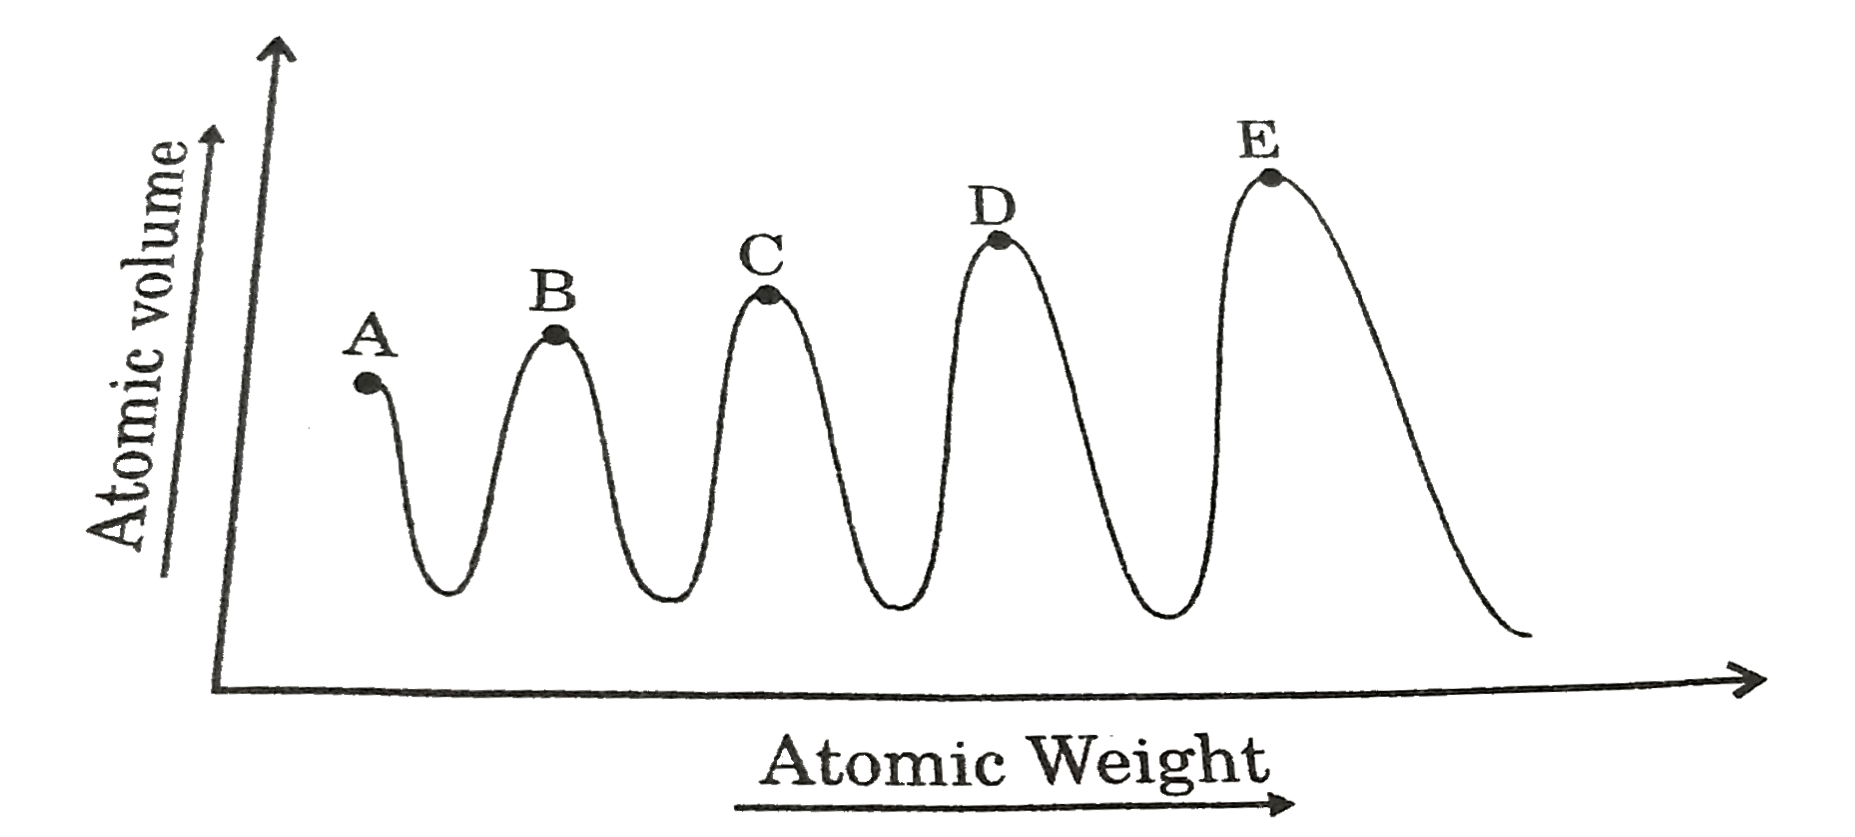
Lother Meyer atttempts to classify the elements by plotting graph between ________and ________.
Video Solution
Text Solution
Atomic weight and atomic volume
|
Topper's Solved these Questions
- APPENDIX - INORGANIC VOLUME 1BOOK - CENGAGE CHEMISTRYCHAPTER - APPENDIX - INORGANIC VOLUME 1EXERCISE - Exercise Short
146 Videos
- APPENDIX - INORGANIC VOLUME 1BOOK - CENGAGE CHEMISTRYCHAPTER - APPENDIX - INORGANIC VOLUME 1EXERCISE - chapter-2 Multiple correct answer
2 Videos
- APPENDIX - INORGANIC VOLUME 1BOOK - CENGAGE CHEMISTRYCHAPTER - APPENDIX - INORGANIC VOLUME 1EXERCISE - chapter-7 Single correct answer
1 Videos
- ALKYNESBOOK - CENGAGE CHEMISTRYCHAPTER - ALKYNESEXERCISE - Exercises (Archives - Analytical and Desriptive Type)
4 Videos
- ATOMIC STRUCTUREBOOK - CENGAGE CHEMISTRYCHAPTER - ATOMIC STRUCTUREEXERCISE - Concept Applicationexercise(4.3)
19 Videos
Similar Questions
Knowledge Check
Lother Meyer obtained the curve for the known elements by plotting their atomic volumes against
AAtomic numbersBAtomic massesCDensitiesDIonization energiesIn the Lother Meyer graph, A,B,C,D and E elements are :
 AhalogensBalkaline earth metalsCalkali metalsDtransition metals
Lother Meyer drew a graph showing the relation between
Aatomic number and atomic weightBatomic number and atomic sizeCatomic weight and atomic volumeDatomic weight and atomic size
What was the basis of classification of elements by Lother Meyer?
View SolutionIn Lother Meyer's curve, the halogens occupy positions on the
View SolutionLother Meyer drew a graph showing the relation between
View SolutionIn Searl's experiment a graph is plotted between
View SolutionIn Lother Meyer plot, the peaks are occupied by
View Solution
