In Searl's experiment a graph is plotted between
load on hanger and radius of wire
load on hanger and mean value of spherometer screw reading
radius of the wire and spherometer screw reading
none of these
The correct Answer is:B
Step by step video, text & image solution for In Searl's experiment a graph is plotted between by Physics experts to help you in doubts & scoring excellent marks in Class 11 exams.
Updated on:21/07/2023Topper's Solved these Questions
- GENERAL PHYSICSBook:DC PANDEYChapter:GENERAL PHYSICSExercise:MCQ_TYPE
Explore 17 Videos
- GENERAL PHYSICSBook:DC PANDEYChapter:GENERAL PHYSICSExercise:MATCH THE COLUMN
Explore 6 Videos
- FLUID MECHANICSBook:DC PANDEYChapter:FLUID MECHANICSExercise:Medical entranes gallery
Explore 49 Videos
- GRAVITATIONBook:DC PANDEYChapter:GRAVITATIONExercise:(C) Chapter Exercises
Explore 45 Videos
Similar Questions
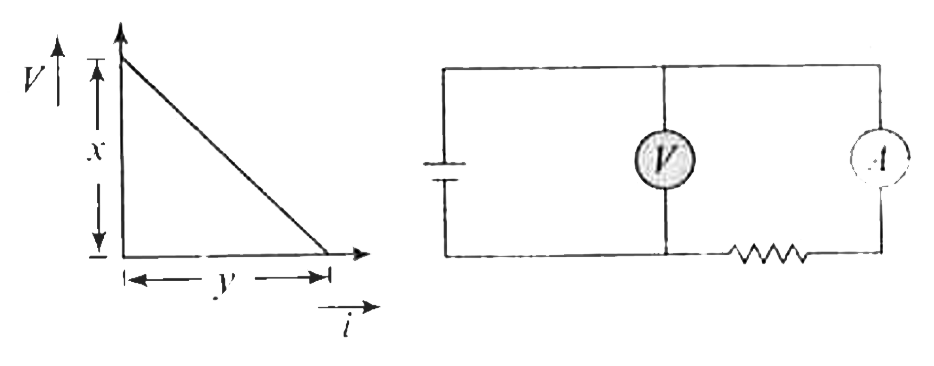
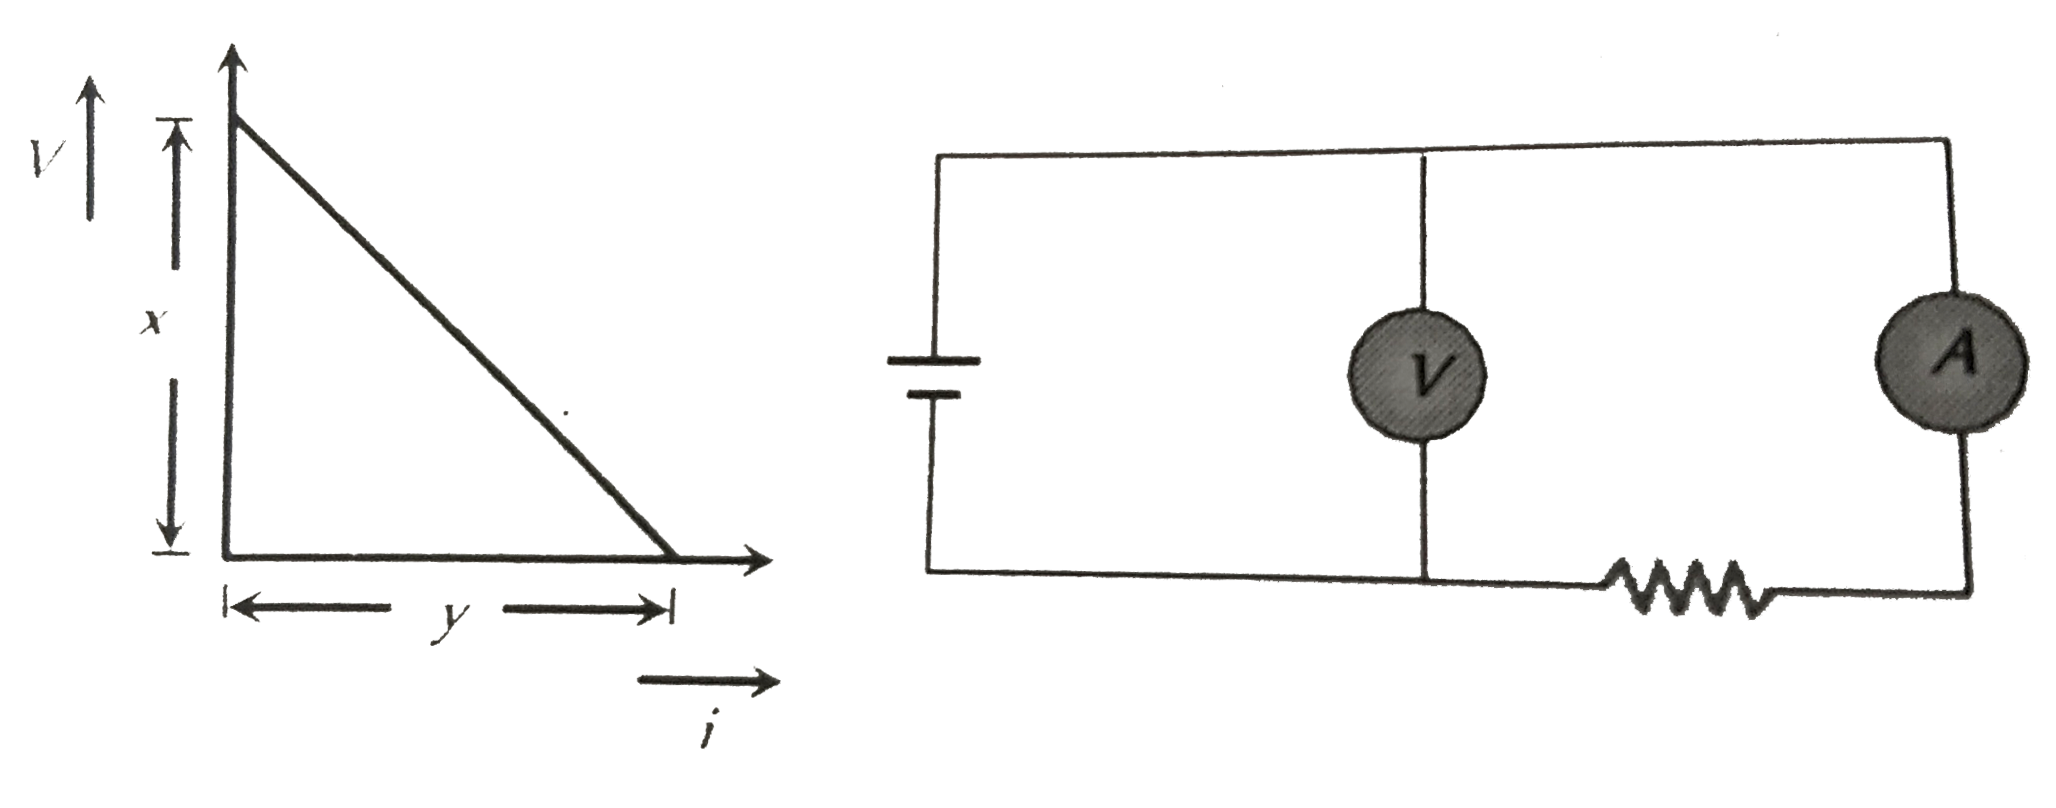
In an experiment a graph was plotted of the potential difference V between the terminals of a cell against circuit current I by varying load rheostat. Find the internal conductance fo the cell.

View SolutionIn case of a curved mirror if the distance of object(u)and image (v) are measured from the pole and a graph is plotted between (1u) and(1/v) ,the graph is
View Solution
Knowledge Check
In an experiment, a graph was plotted of the potential difference V between the terminals of a cell against the circuit current "I" by varying load rheostat, internal conductance of the cell is given by
 AxyBy/xCx/yD(x-y)
In an experiment, a graph was plotted of the potential difference V between the terminals of a cell against the circuit current i by varying load rheostat. Internal conductance of the cell is given by
 AxyByxCxyD(x−y)
For a first order reaction, when a graph is plotted between log10([A])0([A])t on y-axis and time (t) on x-axis , slope of the graph of the graph is equal to __________.
A−KBKC−K2.303DK2.303
In the experiment to study relationship between temperture of the body and time if a graph is plotted between log(θ−θ0) taking it along y−axis and time (t) taking along x−along, it is
View SolutionA cycle wheel is rotating with uniform angular velocity ω A graph is plotted between tangential veloities from the axis. The graph is
View SolutionIn Arrehenius equation if a graph is plotted between logK and 1/T, the slope of the curve will be:
View SolutionSelect correct graph, which is plotted between ionisation energy of 2nd period elements and their atomic number.
View SolutionAt constant temperature if a graph plotted between logP and log(1V) has an intercept of unity then what will be the value of constant (k)
View Solution

