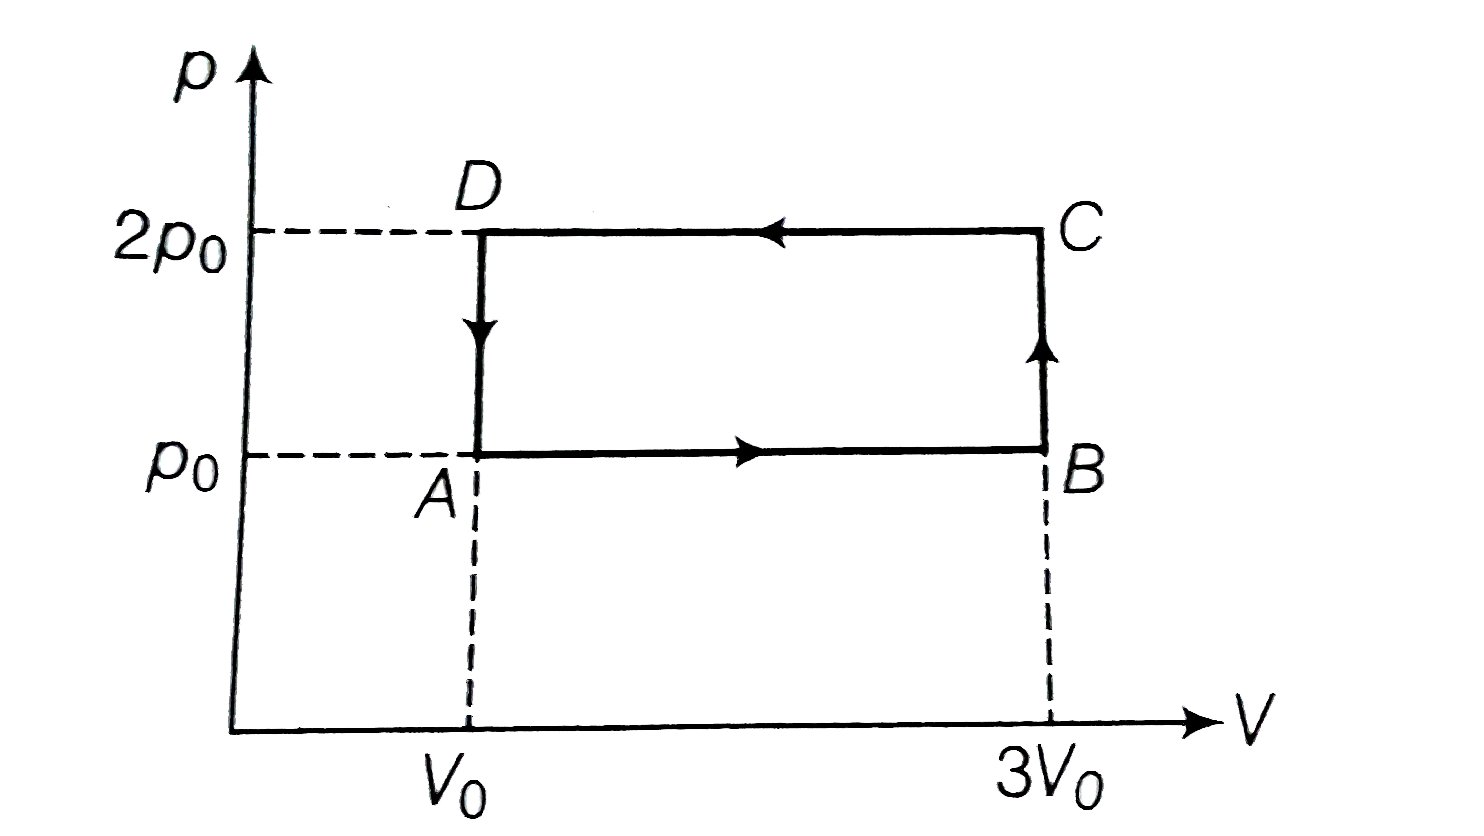
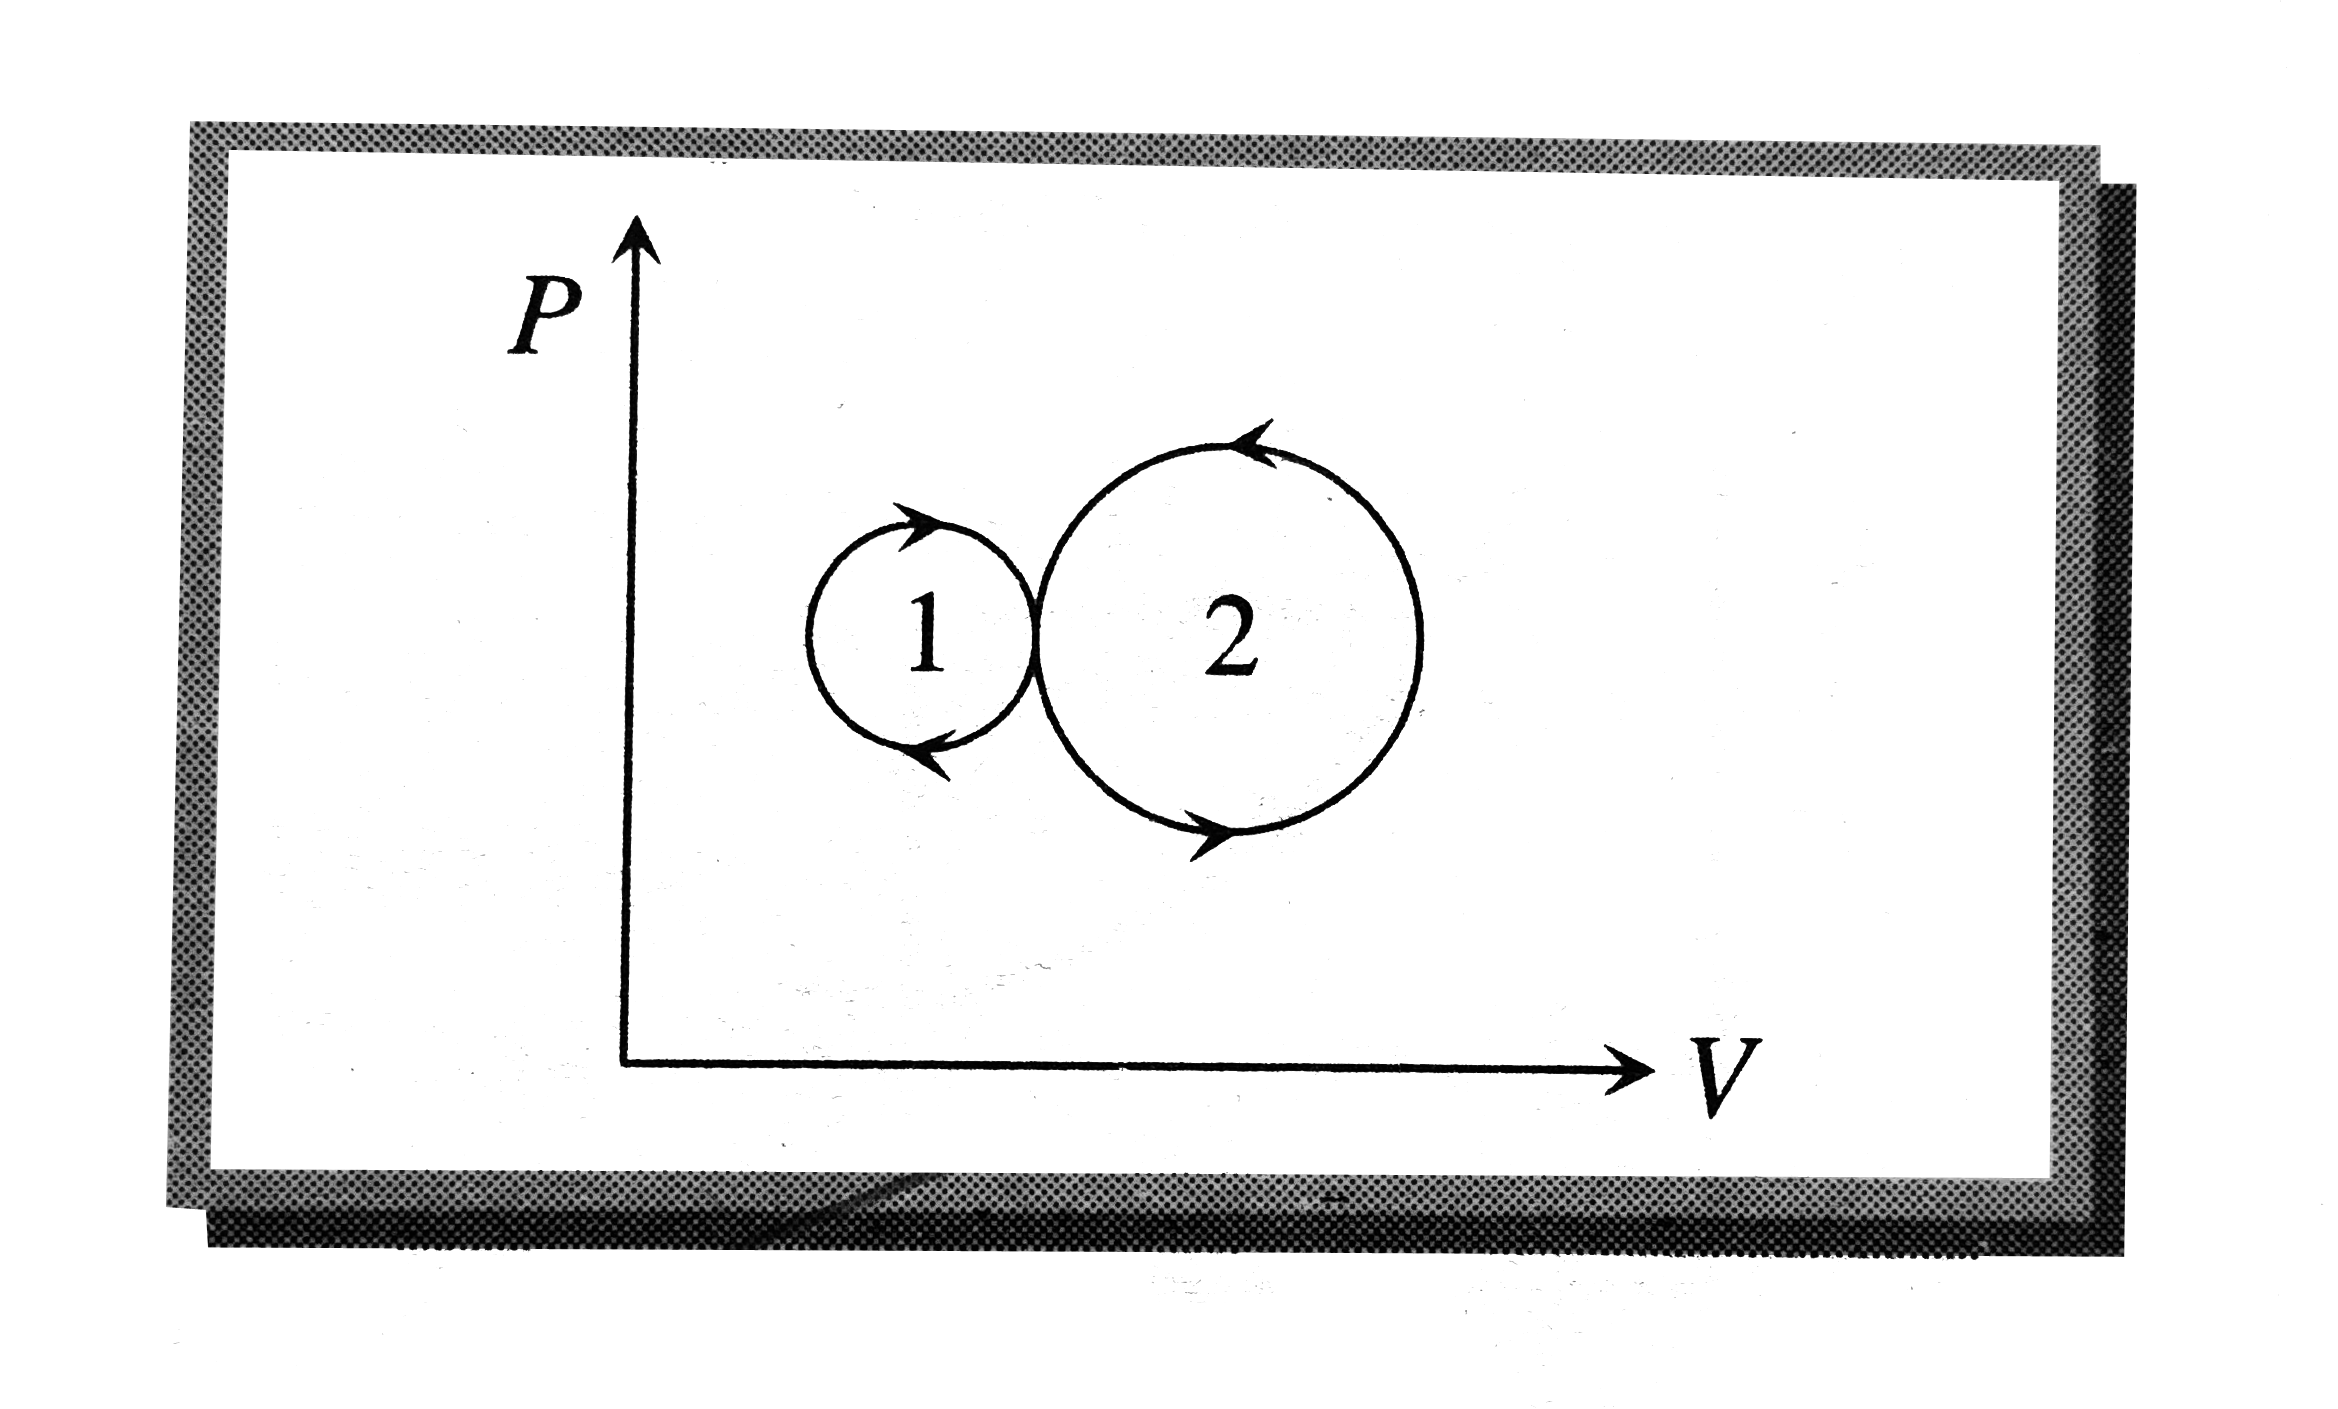
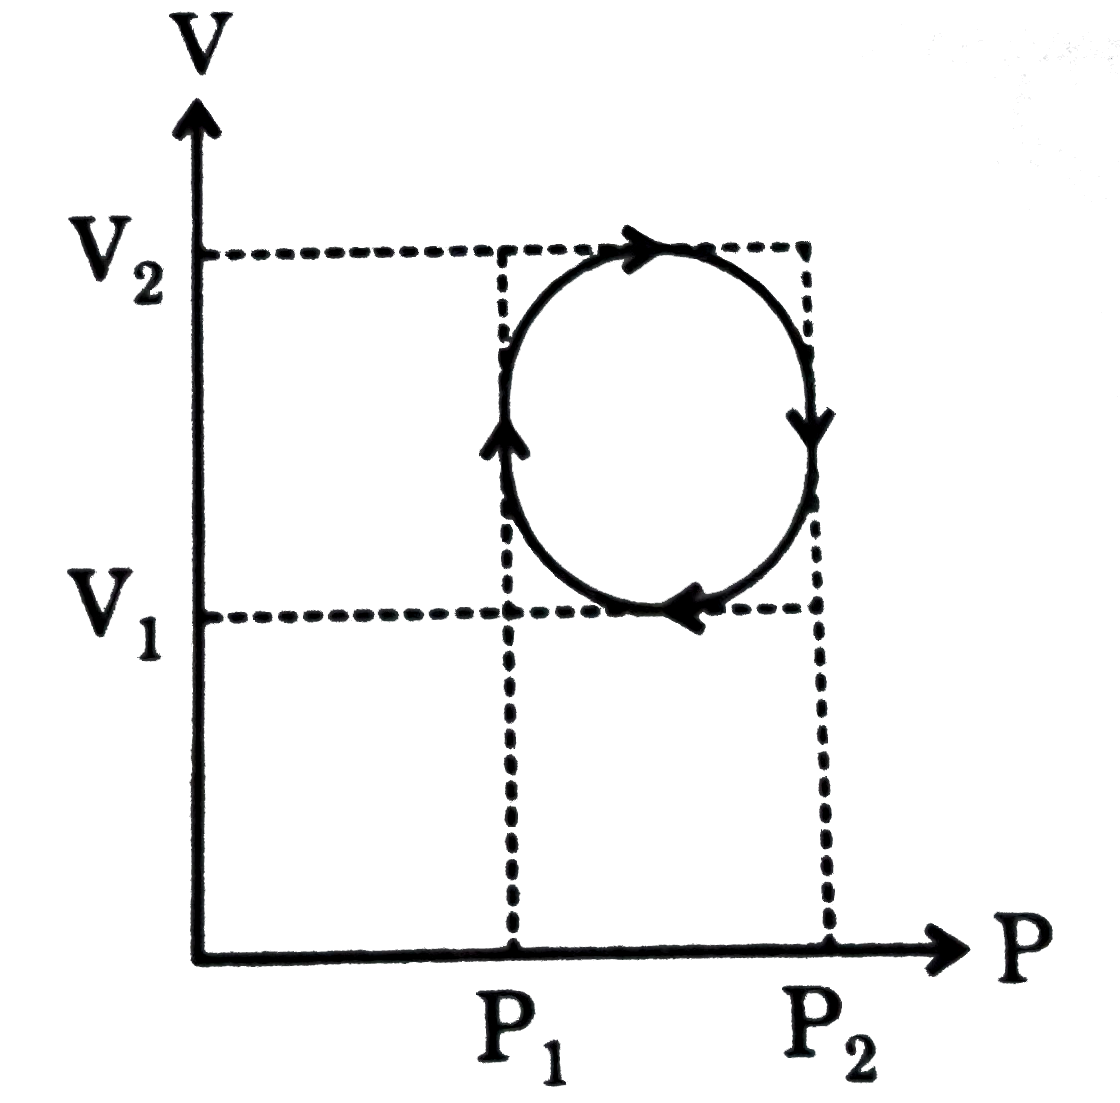
In the following indicator diagram, the net amount of work done will be
A
positive
B
negative
C
zero
D
infinity
Video Solution
Text Solution
The correct Answer is:B
b. Work done during process 1 is positive while during process 2 it is negative, because process 1 is clockwise while process 2 is anticloc wise. But area enclosed P−V graph (i.e., work done) in process 1 is smaller, so net work done will be negative.
|
Topper's Solved these Questions
- KINETIC THEORY OF GASES AND FIRST LAW OF THERMODYNAMICSBook:CENGAGE PHYSICSChapter:KINETIC THEORY OF GASES AND FIRST LAW OF THERMODYNAMICSExercise:Multiple Corrects
Explore 29 Videos
- KINETIC THEORY OF GASES AND FIRST LAW OF THERMODYNAMICSBook:CENGAGE PHYSICSChapter:KINETIC THEORY OF GASES AND FIRST LAW OF THERMODYNAMICSExercise:Assertion-Reasoning
Explore 6 Videos
- KINETIC THEORY OF GASES AND FIRST LAW OF THERMODYNAMICSBook:CENGAGE PHYSICSChapter:KINETIC THEORY OF GASES AND FIRST LAW OF THERMODYNAMICSExercise:Subjective
Explore 22 Videos
- KINETIC THEORY OF GASESBook:CENGAGE PHYSICSChapter:KINETIC THEORY OF GASESExercise:Compression
Explore 2 Videos
- LINEAR AND ANGULAR SIMPLE HARMONIC MOTIONBook:CENGAGE PHYSICSChapter:LINEAR AND ANGULAR SIMPLE HARMONIC MOTIONExercise:Multiple Correct Answer Type
Explore 9 Videos
Similar Questions
Knowledge Check
In the indicator diagram shown,
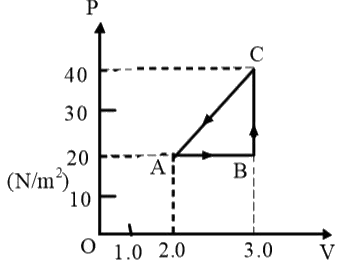 In the above problem work done along path BC is-AzeroB(40 - 20) = 20 jouleC40 jouleD60 joule
In the indicator diagram shown,
 In the above question, the work done along path CA is –A20 jouleB20 jouleC−30 jouleDzero
In the indicator diagram shown, the work done along path AB is
 AzeroB20 jouleC−20 jouleD60 joule
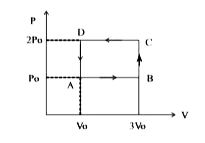
An ideal gas underoges cyclic process of ABCDA as shown in Given P−V diagram (figure)
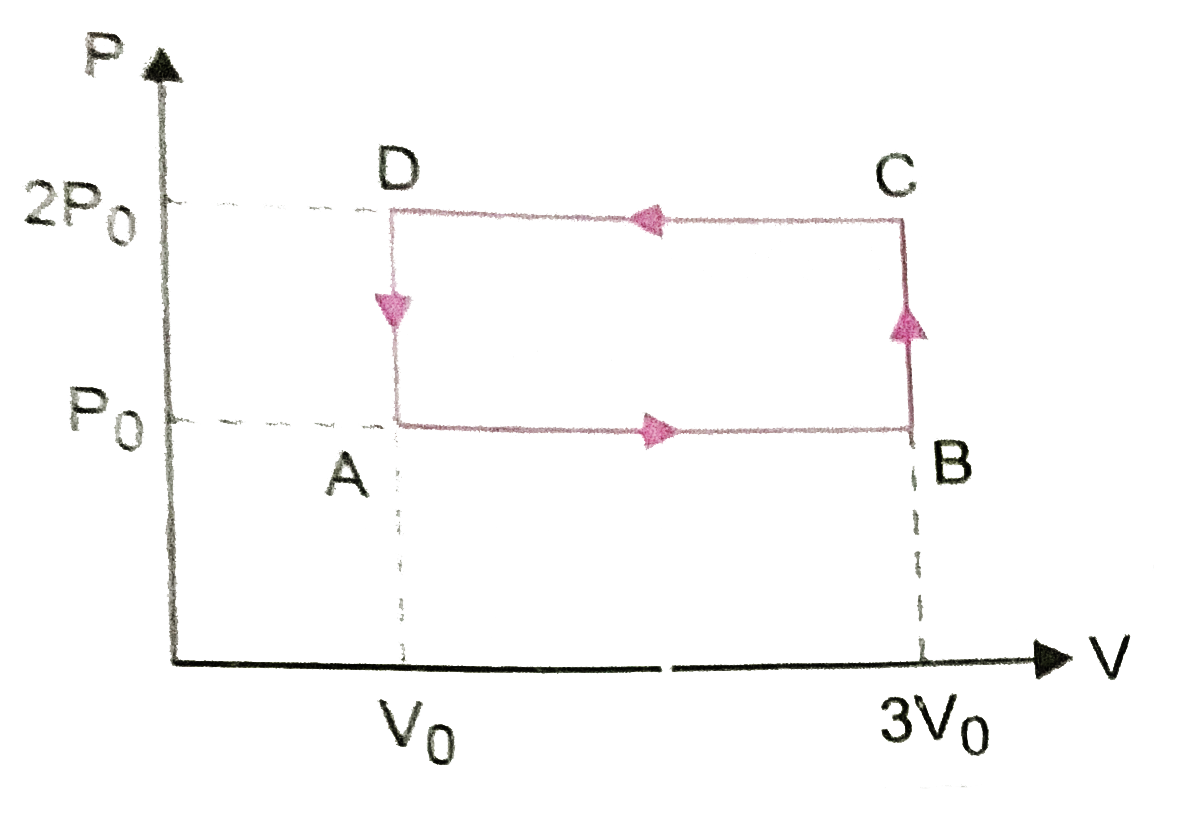
The amount of work done by the gas is
View SolutionIn the cyclic process shown in P-V diagram the magnitude of work done is :
View SolutionAn ideal gas undergoes cyclic process ACBC as shown is given PV diagram
The amount of work done by the gas is
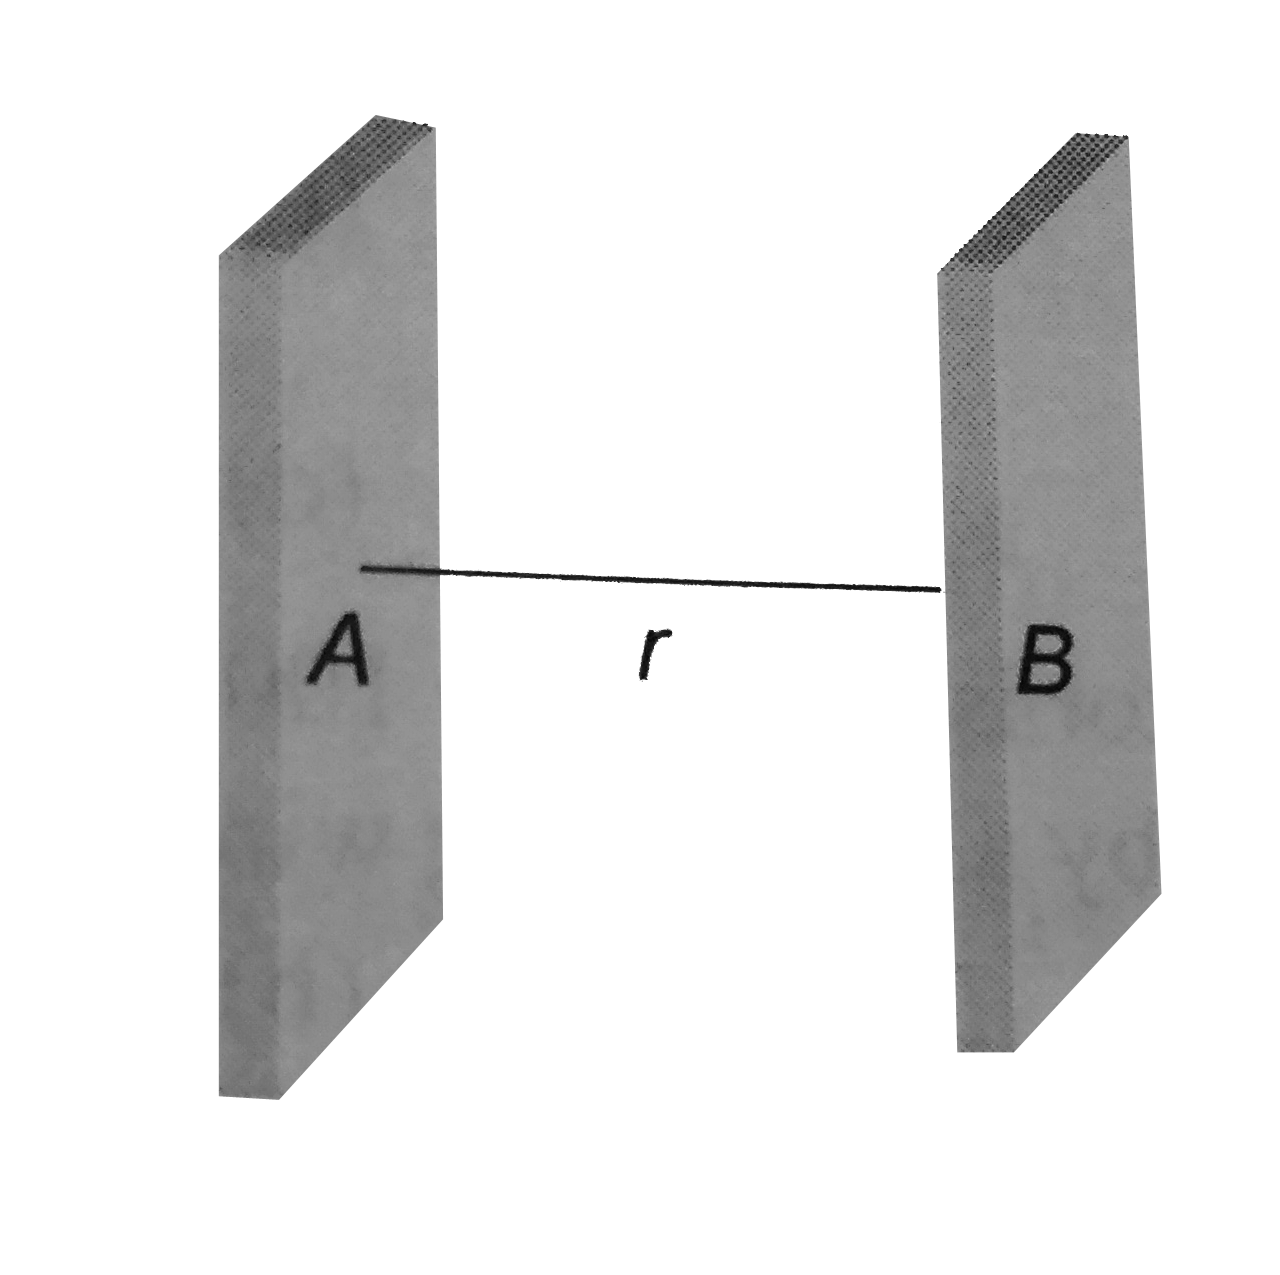
View SolutionThere are two equipotential surafce as shown in figure. The distance between them is r. The charged of −q coulomb is taken from the surface A to B, the resultant work done will be
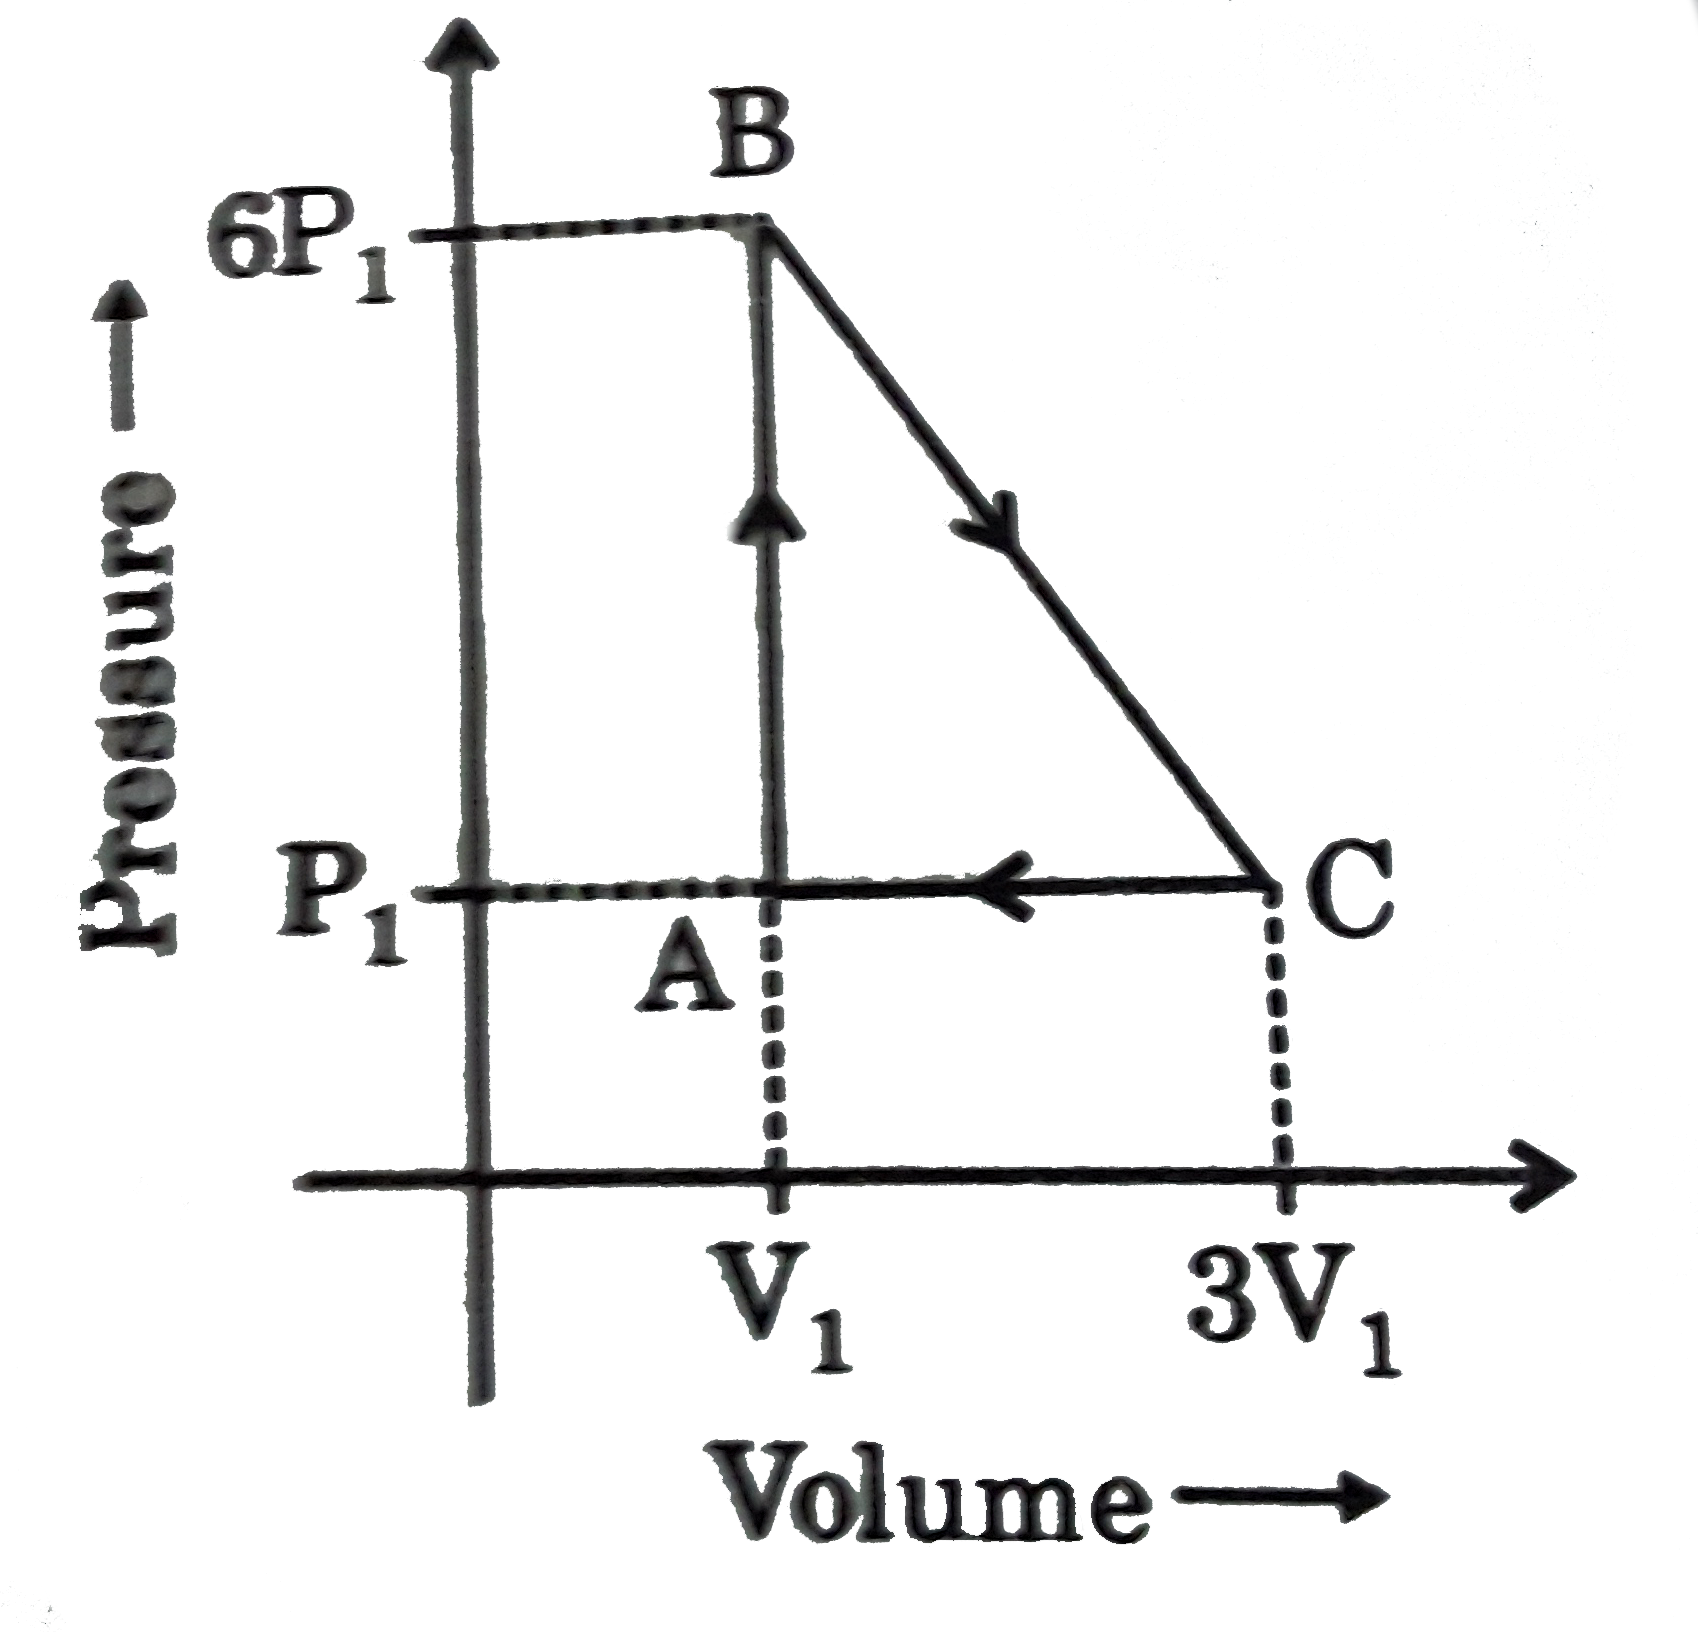
View SolutionAn ideal gas is taken around the cycle ABCA as shown in P-V diagram. The net work done by the gas during the cycle is equal to :
View Solution

