A metallic shell has a point charge 'q' kept inisde its cavity. Which one of the following diagrams correctly represents the electric lines of forces?
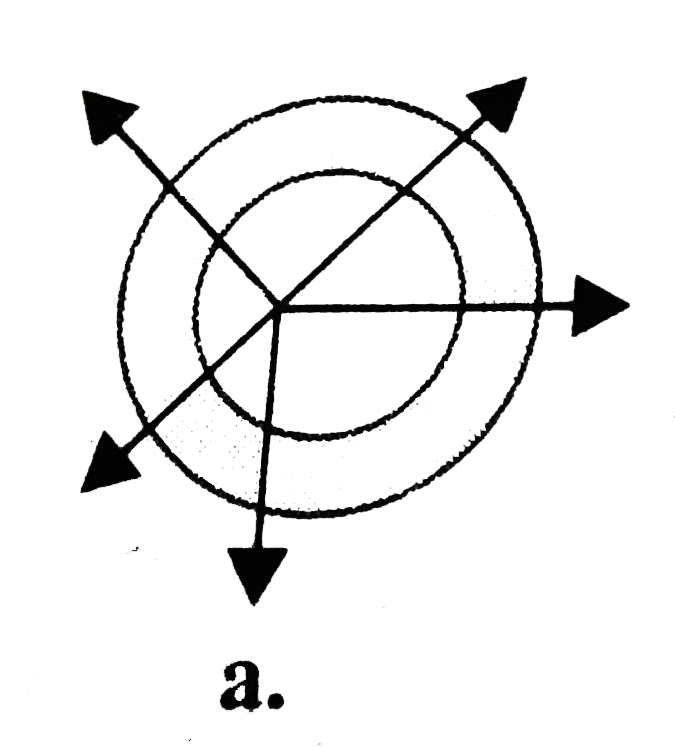
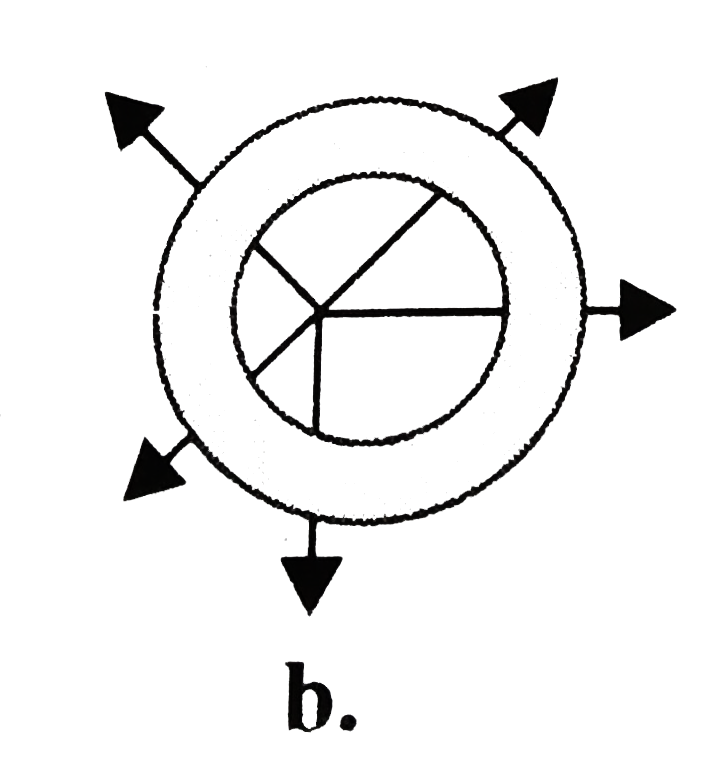
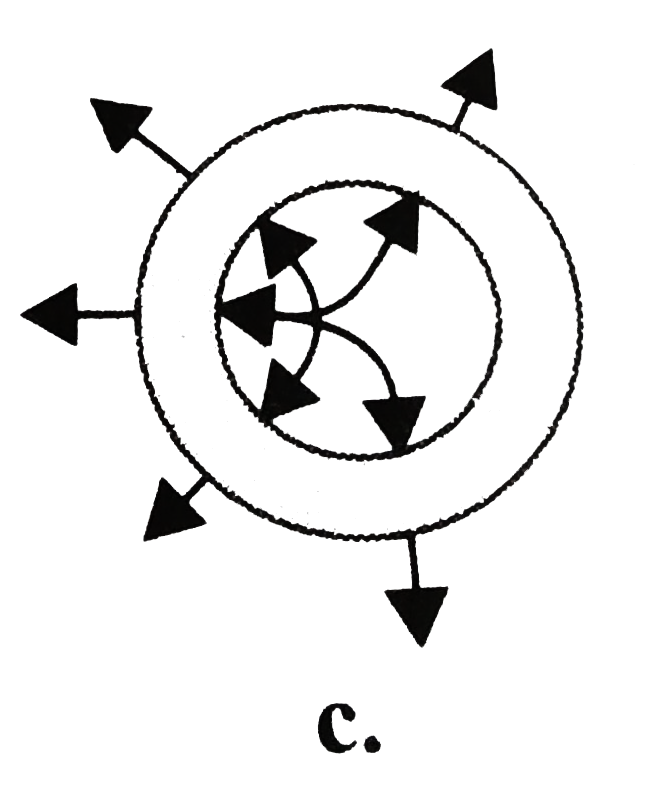
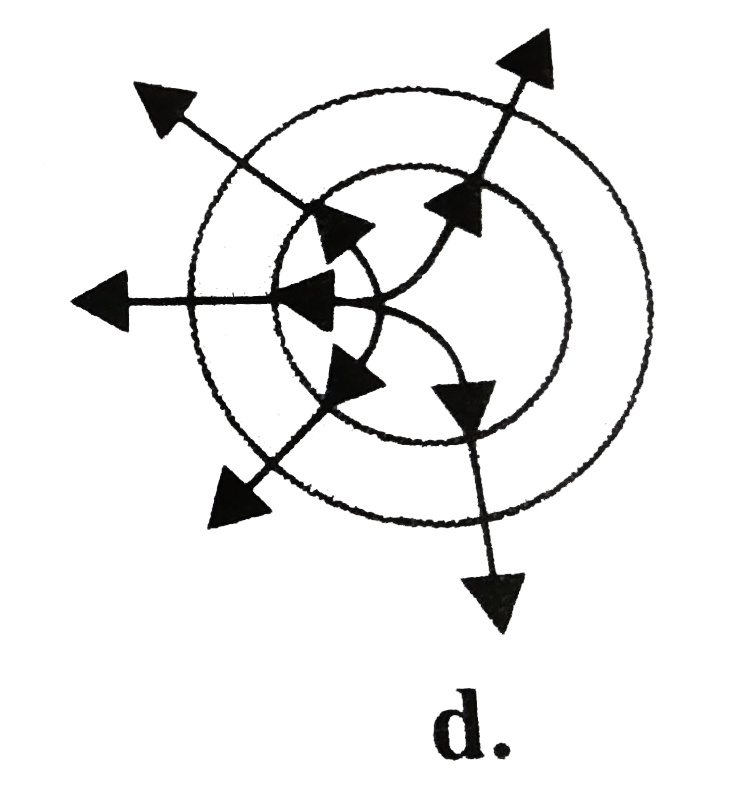
Electric field is perpendicular to the equipotential surface and is zero everywhere inside the metal.
Topper's Solved these Questions
- MISCELLANEOUS VOLUME 3BOOK - CENGAGE PHYSICSCHAPTER - MISCELLANEOUS VOLUME 3EXERCISE - Multiple Correct Answer type
109 Videos
- MISCELLANEOUS VOLUME 3BOOK - CENGAGE PHYSICSCHAPTER - MISCELLANEOUS VOLUME 3EXERCISE - Assertion and Reason Type
8 Videos
- MECHANICAL PROPERTIES OF SOLIDSBOOK - CENGAGE PHYSICSCHAPTER - MECHANICAL PROPERTIES OF SOLIDSEXERCISE - Question Bank
4 Videos
- MISCELLANEOUS VOLUME 5BOOK - CENGAGE PHYSICSCHAPTER - MISCELLANEOUS VOLUME 5EXERCISE - Integer
12 Videos
Similar Questions
Knowledge Check
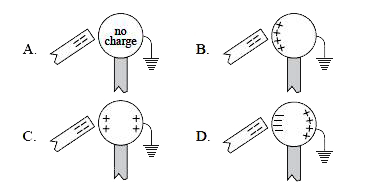
Which of the following diagrams correctly represents the counter pattern ?
A B
B C
C D
D
Which one of the following is correct?
Electrical lines of forcesAexist everywhereBexist in the immediate vicinity of positive chargeCexist in the immediate vicinity of negative chargeDare imaginaryWhich one of the following correctly represents an organism and its ecological niche?
AVallisneria and pondBDesert locust (Schistocerca) and the desertCPlant lice (aphids) and leafDVultures and dense forest
Which on one of the following correctly represents an organism and its ecological niche?
View SolutionA thin spherical shell of radius R has charge Q spread uniformly over its surface. Which of the following graphs most closely represents the electric field E(r) produced by the shell in the range 0≤r<∞, where r is the distance from the centre of the shell?
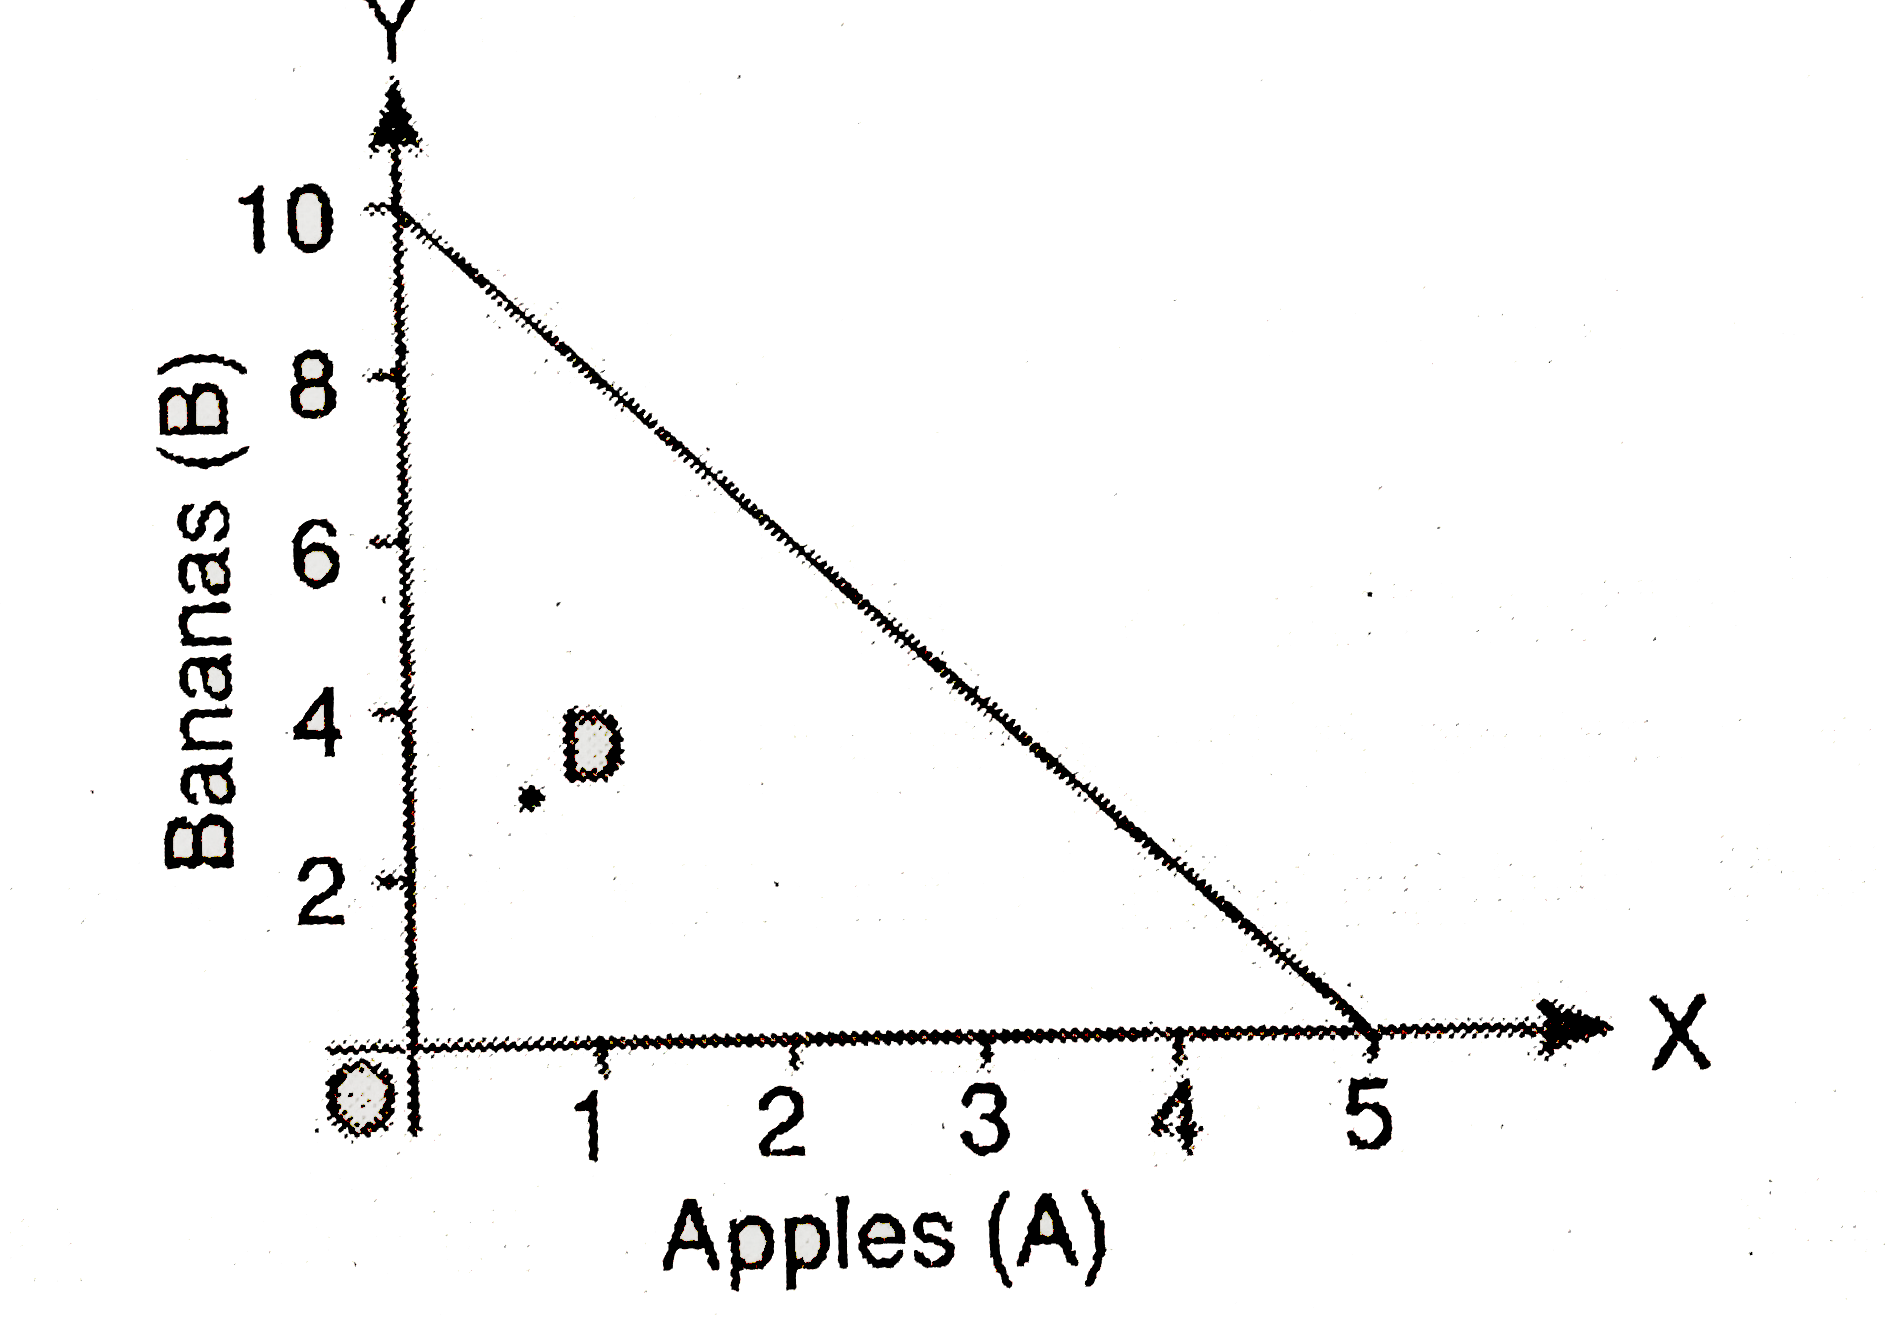
View SolutionIn the following diagram of budget line, point ''D'' represents :
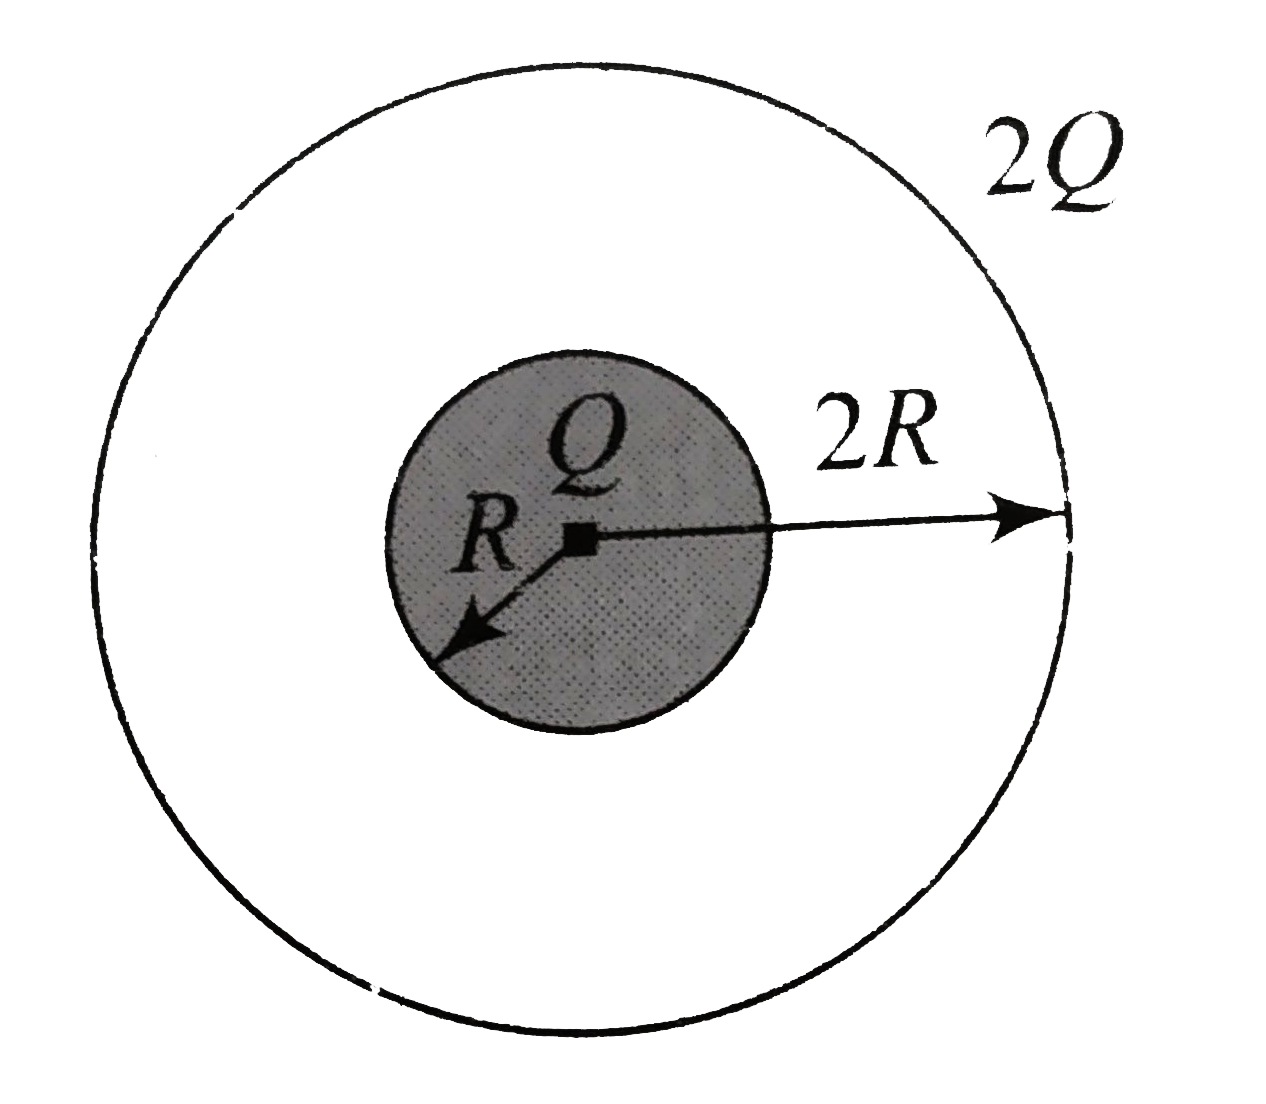
View SolutionA charge Q is uniformly distributed in a dielectric sphere of radius R (having dielectric constant unity). This dielectric sphere is enclosed by a concentric spherical shell of radius 2R and having uniformly distributed charge 2Q. Which of the following graph correctly represents variation of electric field with distance r from the common centre?
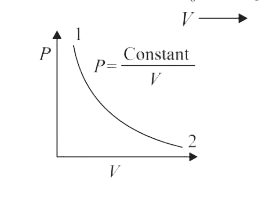
View SolutionFor the diagram given for an ideal gas, out of the following which one correctly represent the diagram?
View Solution

