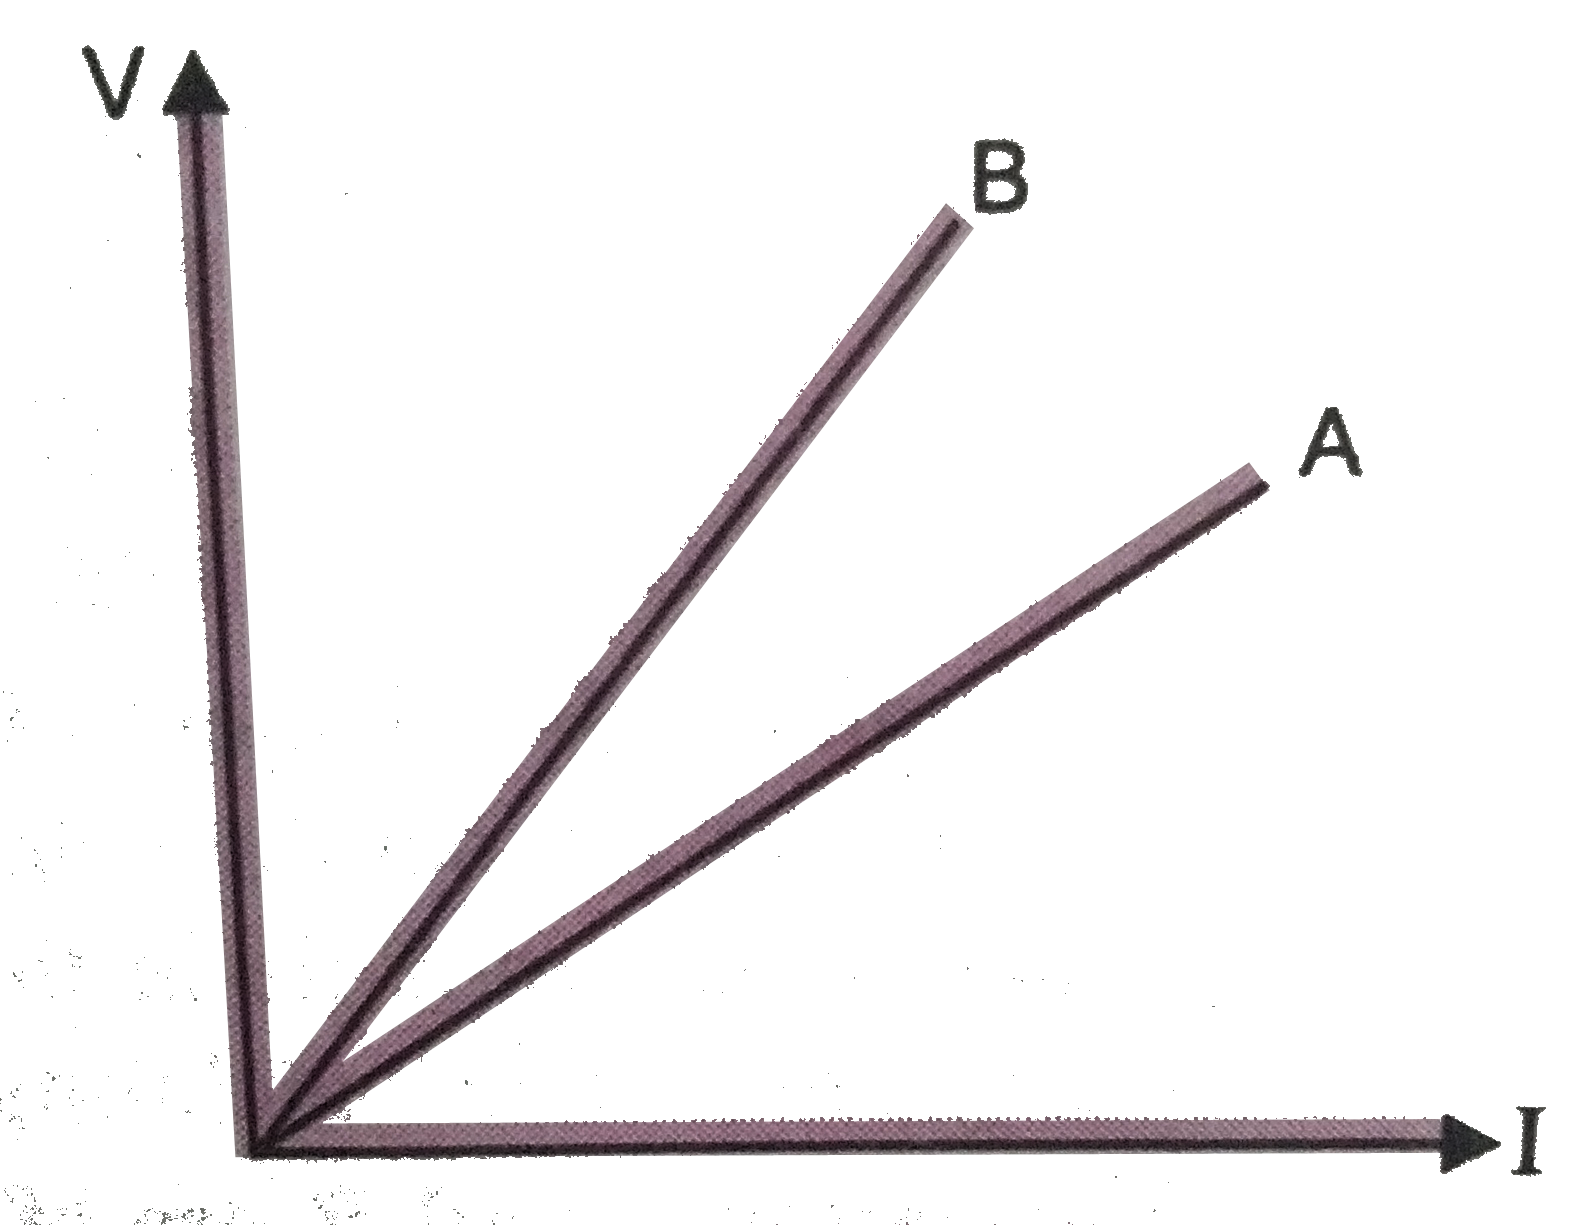
The V - I graphs for two resistors and their series combination are shown in Fig 5.23. Which one of these graphs represents the series combination of the two resistors? Given reason for your answer.
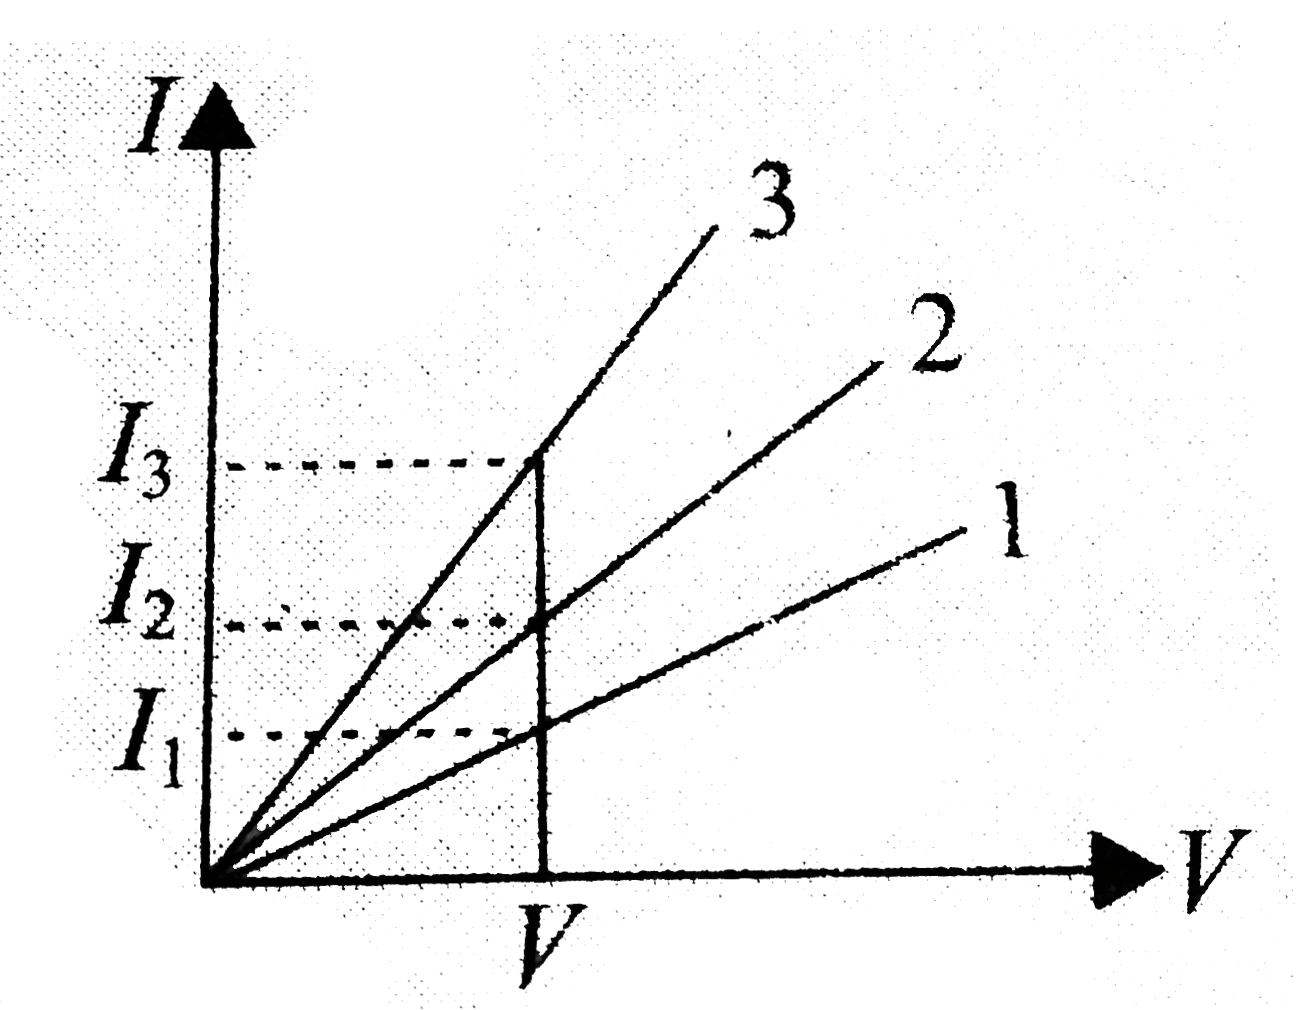
From Fig. 5.23,
R1=VI1,R2=VI2,R3=VI3
SinceI1<I2<I3,SoR1>R2>R3.
The resistance of the series combination, being the sum of the two resistances, is greater then each of the resistances.
Since R1>R2,R1>R3, graph 1 represents the series combination
of the two resistors.
Topper's Solved these Questions
- ELECTRIC CURRENT AND CIRCUITBook:CENGAGE PHYSICSChapter:ELECTRIC CURRENT AND CIRCUITExercise:Solved Examples
Explore 12 Videos
- ELECTRIC CURRENT AND CIRCUITBook:CENGAGE PHYSICSChapter:ELECTRIC CURRENT AND CIRCUITExercise:Exercise 5.1
Explore 28 Videos
- ELECTRIC CURRENT & CIRCUITSBook:CENGAGE PHYSICSChapter:ELECTRIC CURRENT & CIRCUITSExercise:Kirchhoff s law and simple circuits
Explore 15 Videos
- ELECTRIC FLUX AND GAUSS LAWBook:CENGAGE PHYSICSChapter:ELECTRIC FLUX AND GAUSS LAWExercise:MCQ s
Explore 38 Videos
Similar Questions
Knowledge Check
In the series combination of two or more than two resistances
Athe current through each resistance is sameBthe voltage through each resistance is sameCneither current nor voltage through each resistance is sameDboth current and voltage through each resistance are sameWhich of the shown graphs may represent the reactance of a series L-C combination?
A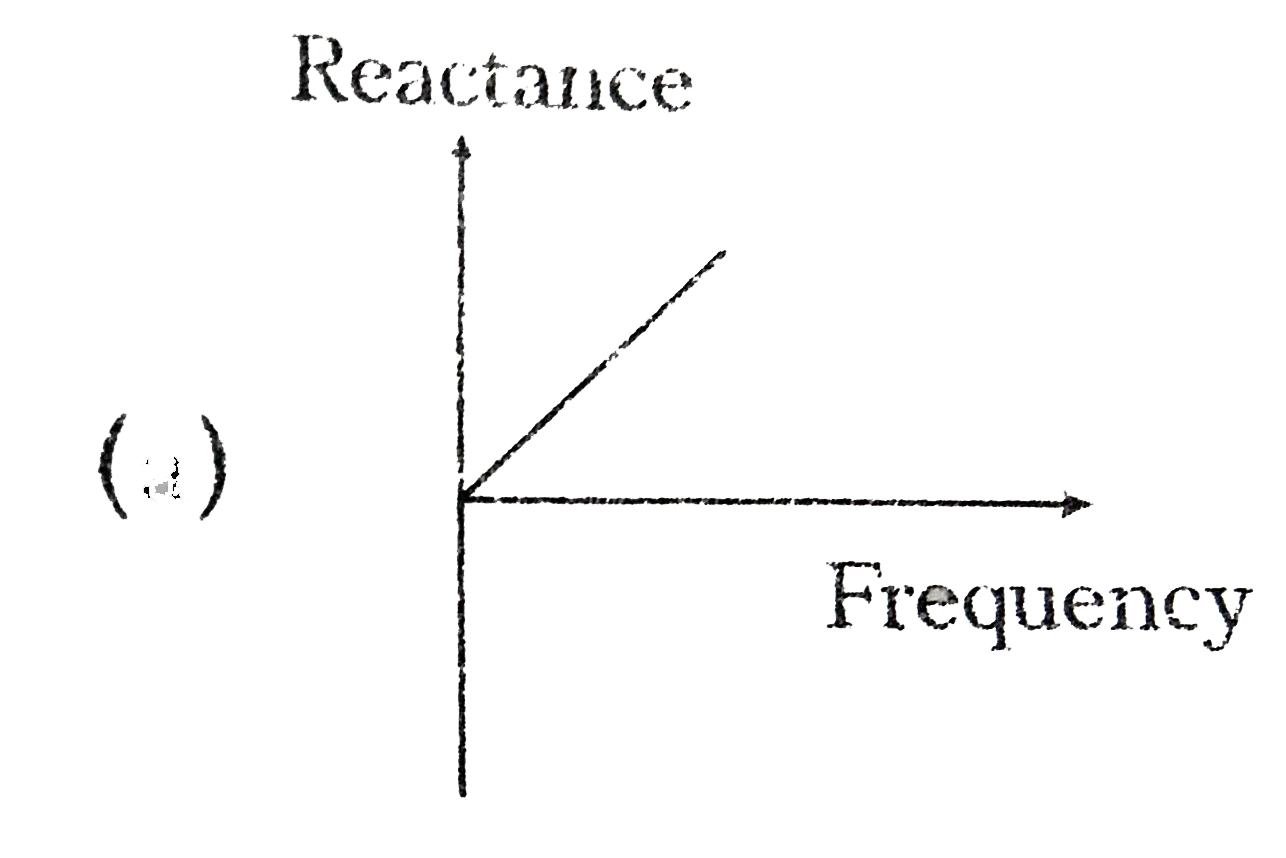 B
B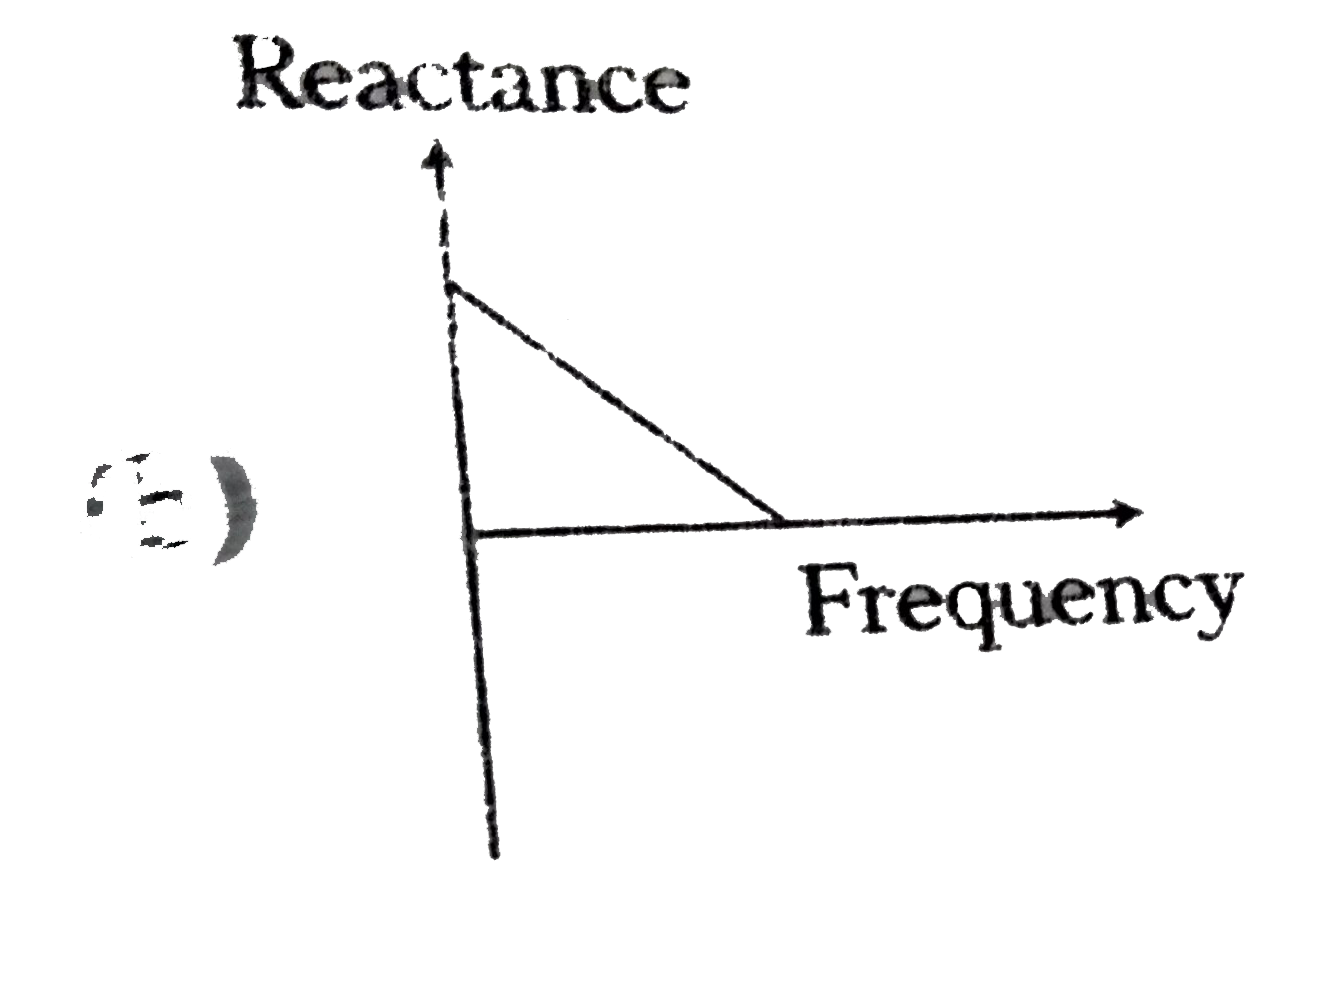 C
C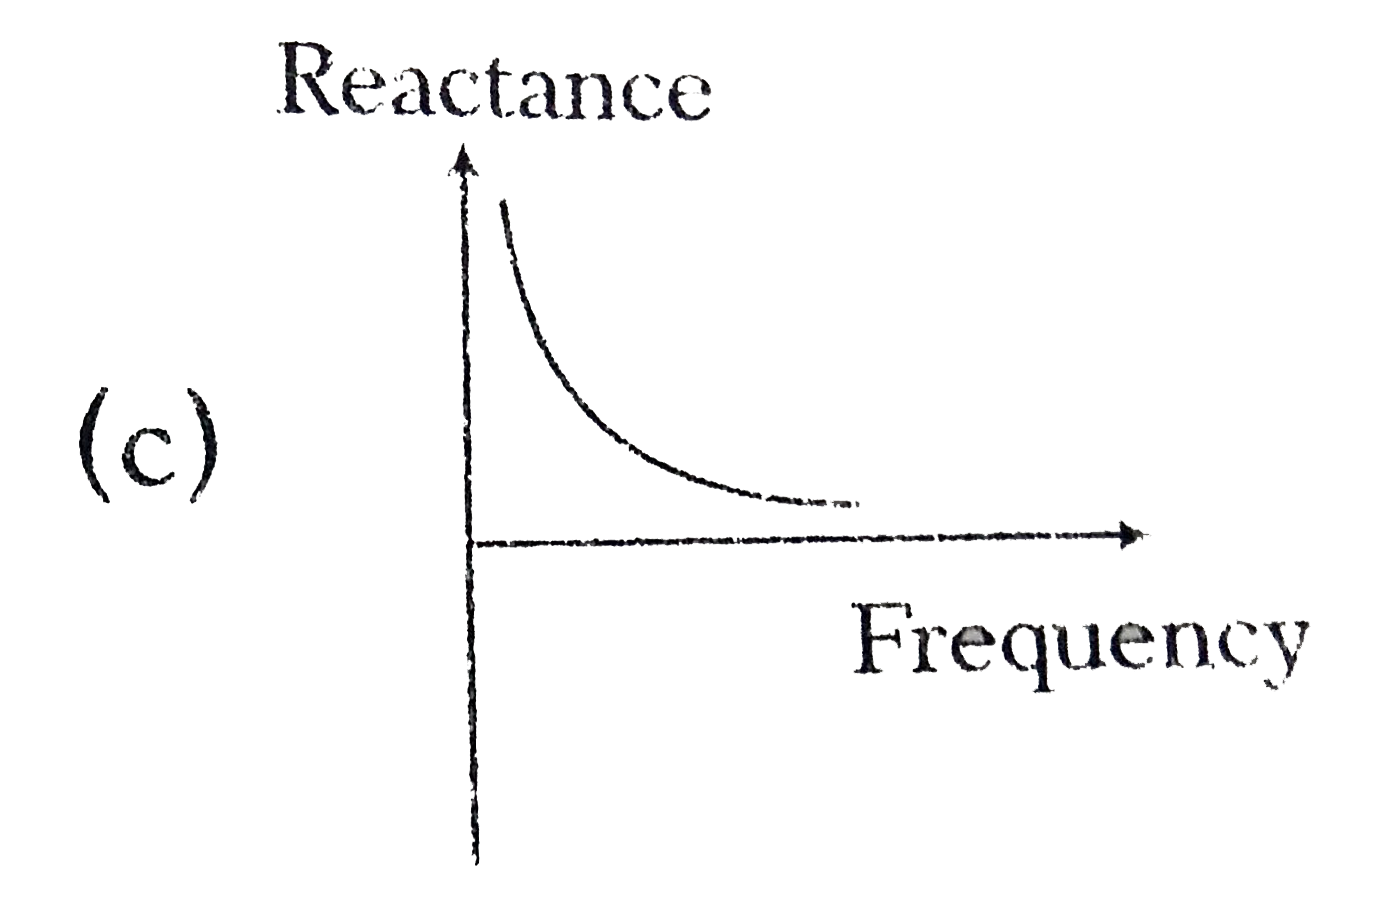 D
D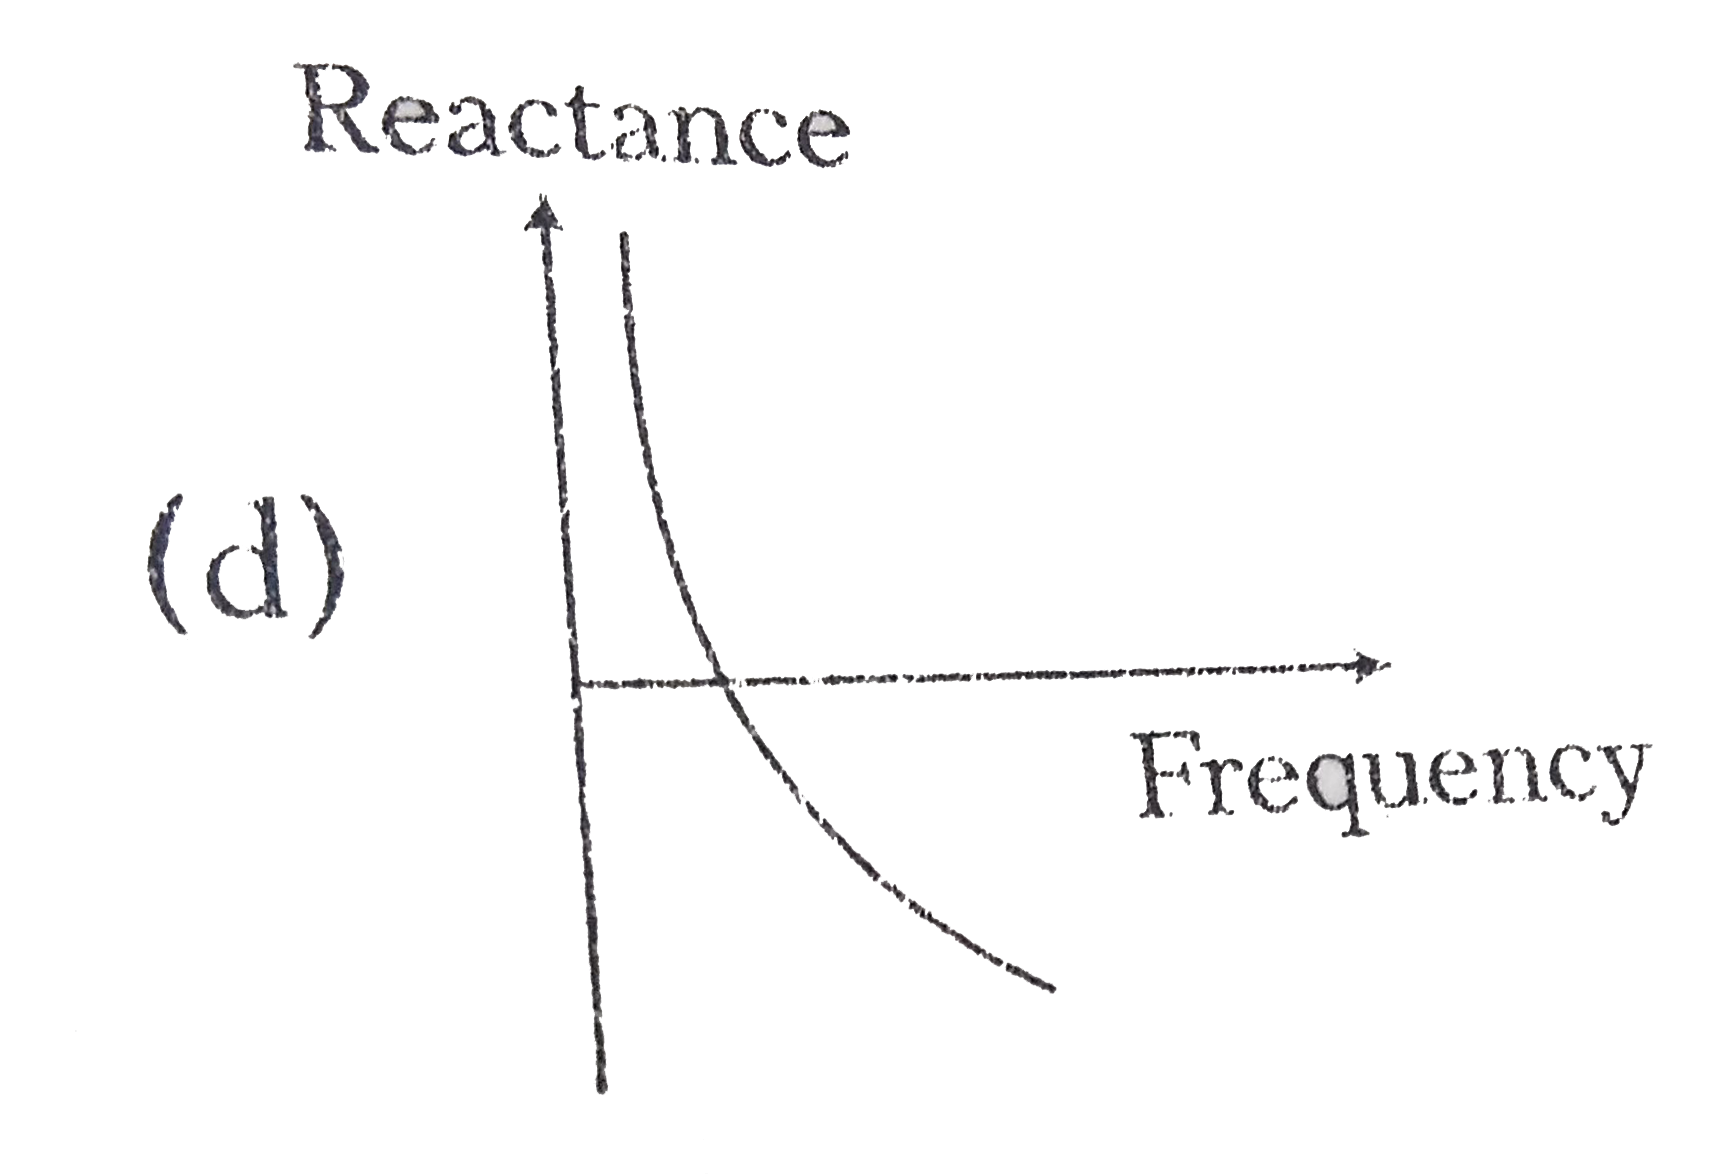
Which of the following is TRUE for a series combination of resistors?
AVoltage remains same onlBCurrent remains same onlCBoth current and voltage remains sameDNeither current nor voltage remains same
(a) Why does resistance increase in a series combination of resistors ?
(b) Why does resistance decrease in a parallel combination of resistors ?
View SolutionDiscuss series and parallel combinations of resistors with their salient features.
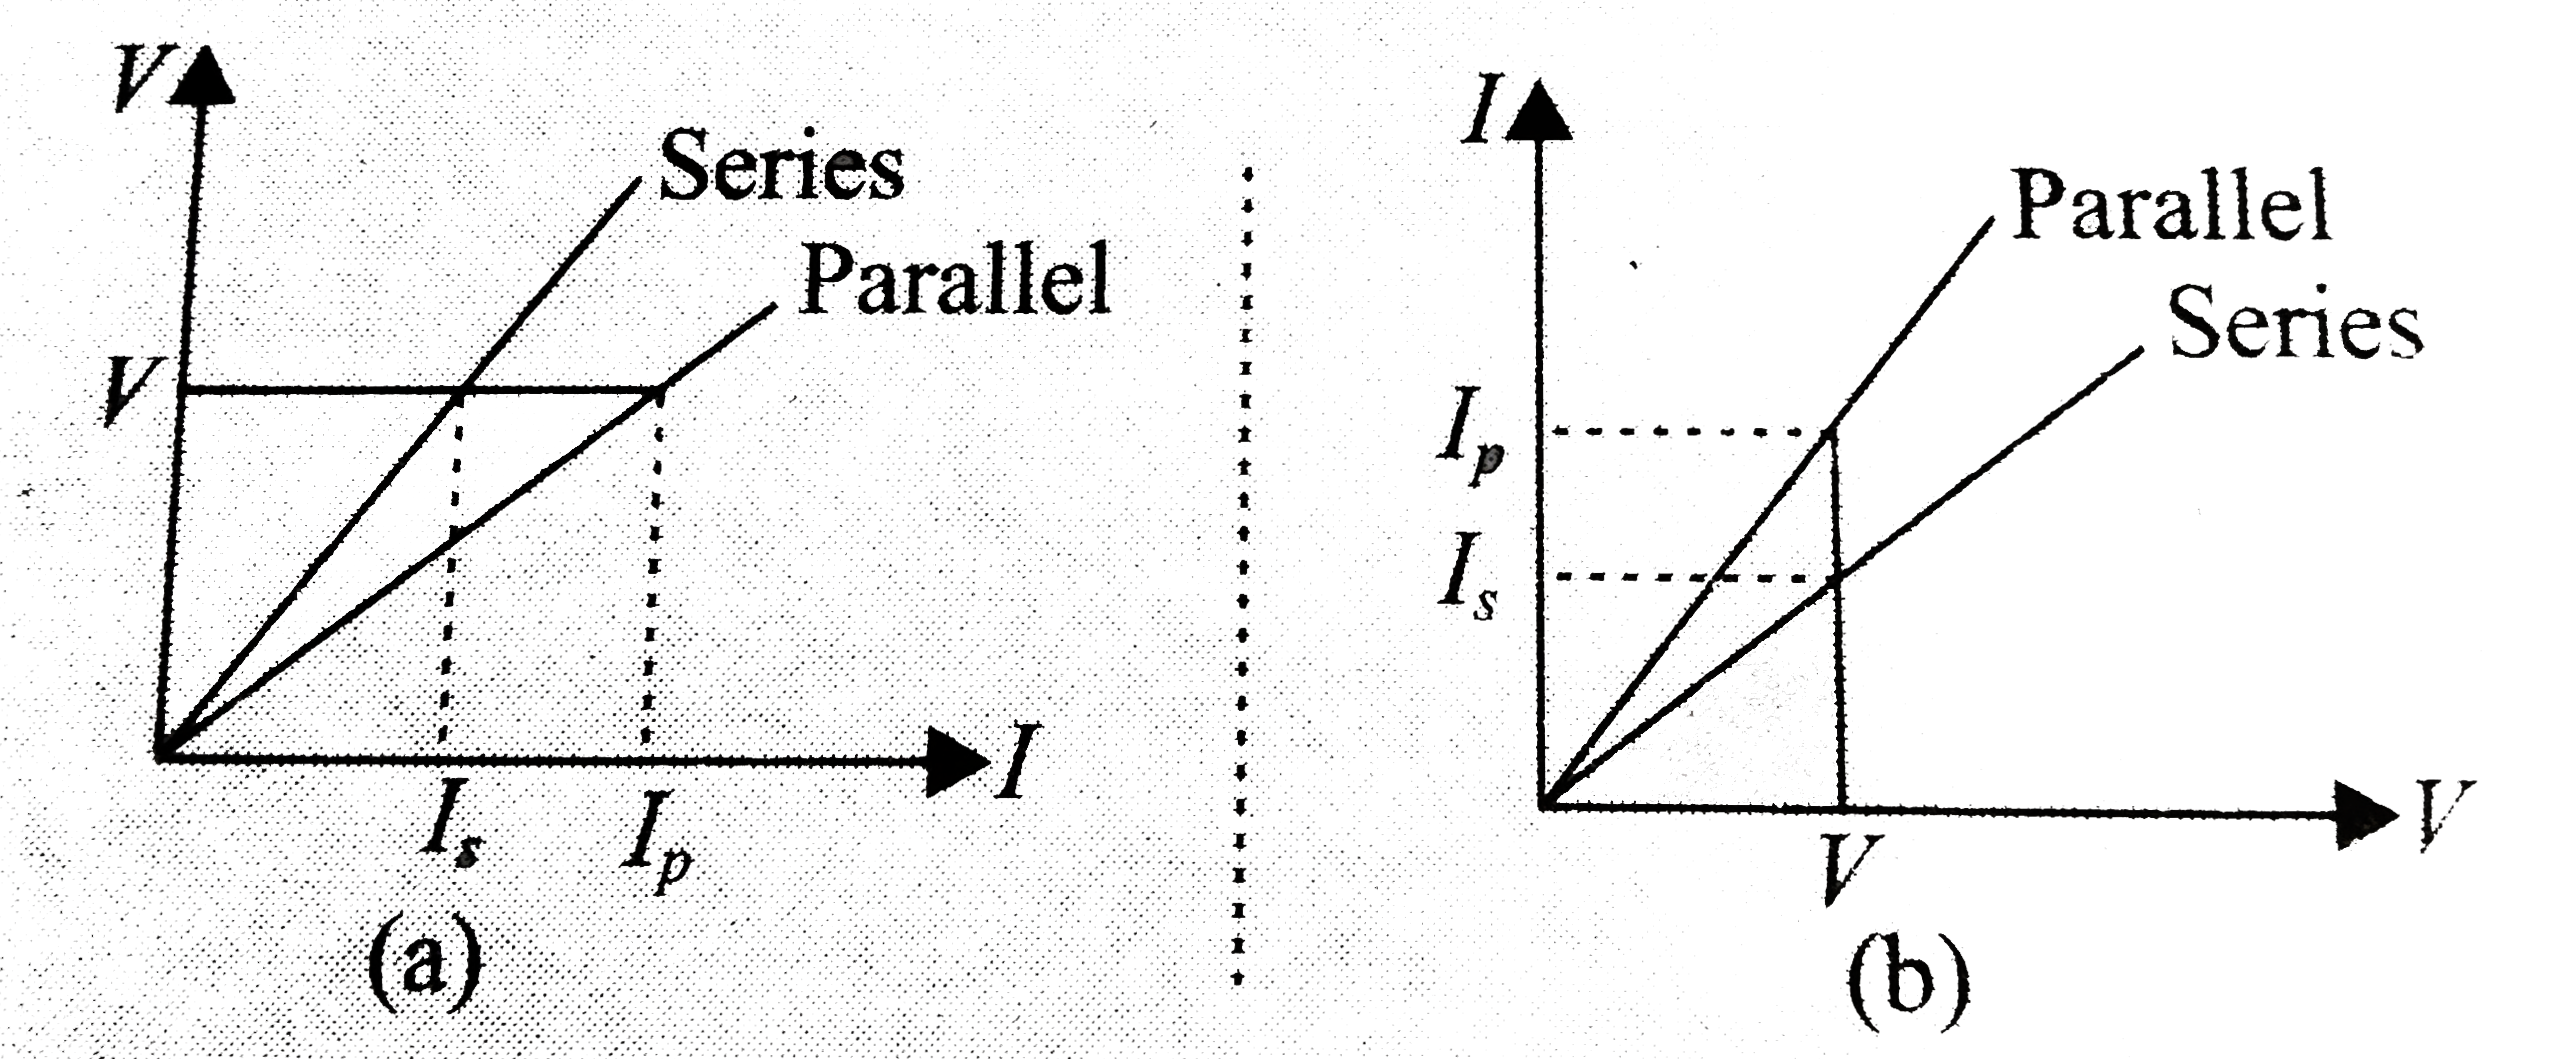
View SolutionTwo students perform experiments on series and parallel combinations of two given resistors R1andR1 and plot the following V -1 graphs [Fig. 5.24.]. Which of the graphs is/are correctly labeled in terms of the words 'series' and 'parallel'? Justify your answer.
View SolutionCombination of Resistors|Series Combination|Parallel Combination
View SolutionDraw a circuit diagram of an electric circuit containing a cell, a key, an ammeter, a resistance of 2Ω in series with a combination of two resistors (4Ω each) in parallel and a voltmeter across the parallel combination. Will the potential difference across the 2Ω resistor be the same as that across the parallel combination of 4Ω resistors ? Give reason.
View Solution


 .
.