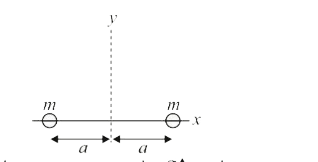
Two point charge ±q are placed on the axis at x=−a and x=±a, as shown in fig.
(i) Plot the variation of E along the x-axis.
(ii) Plot the variation of E along the y-axis.
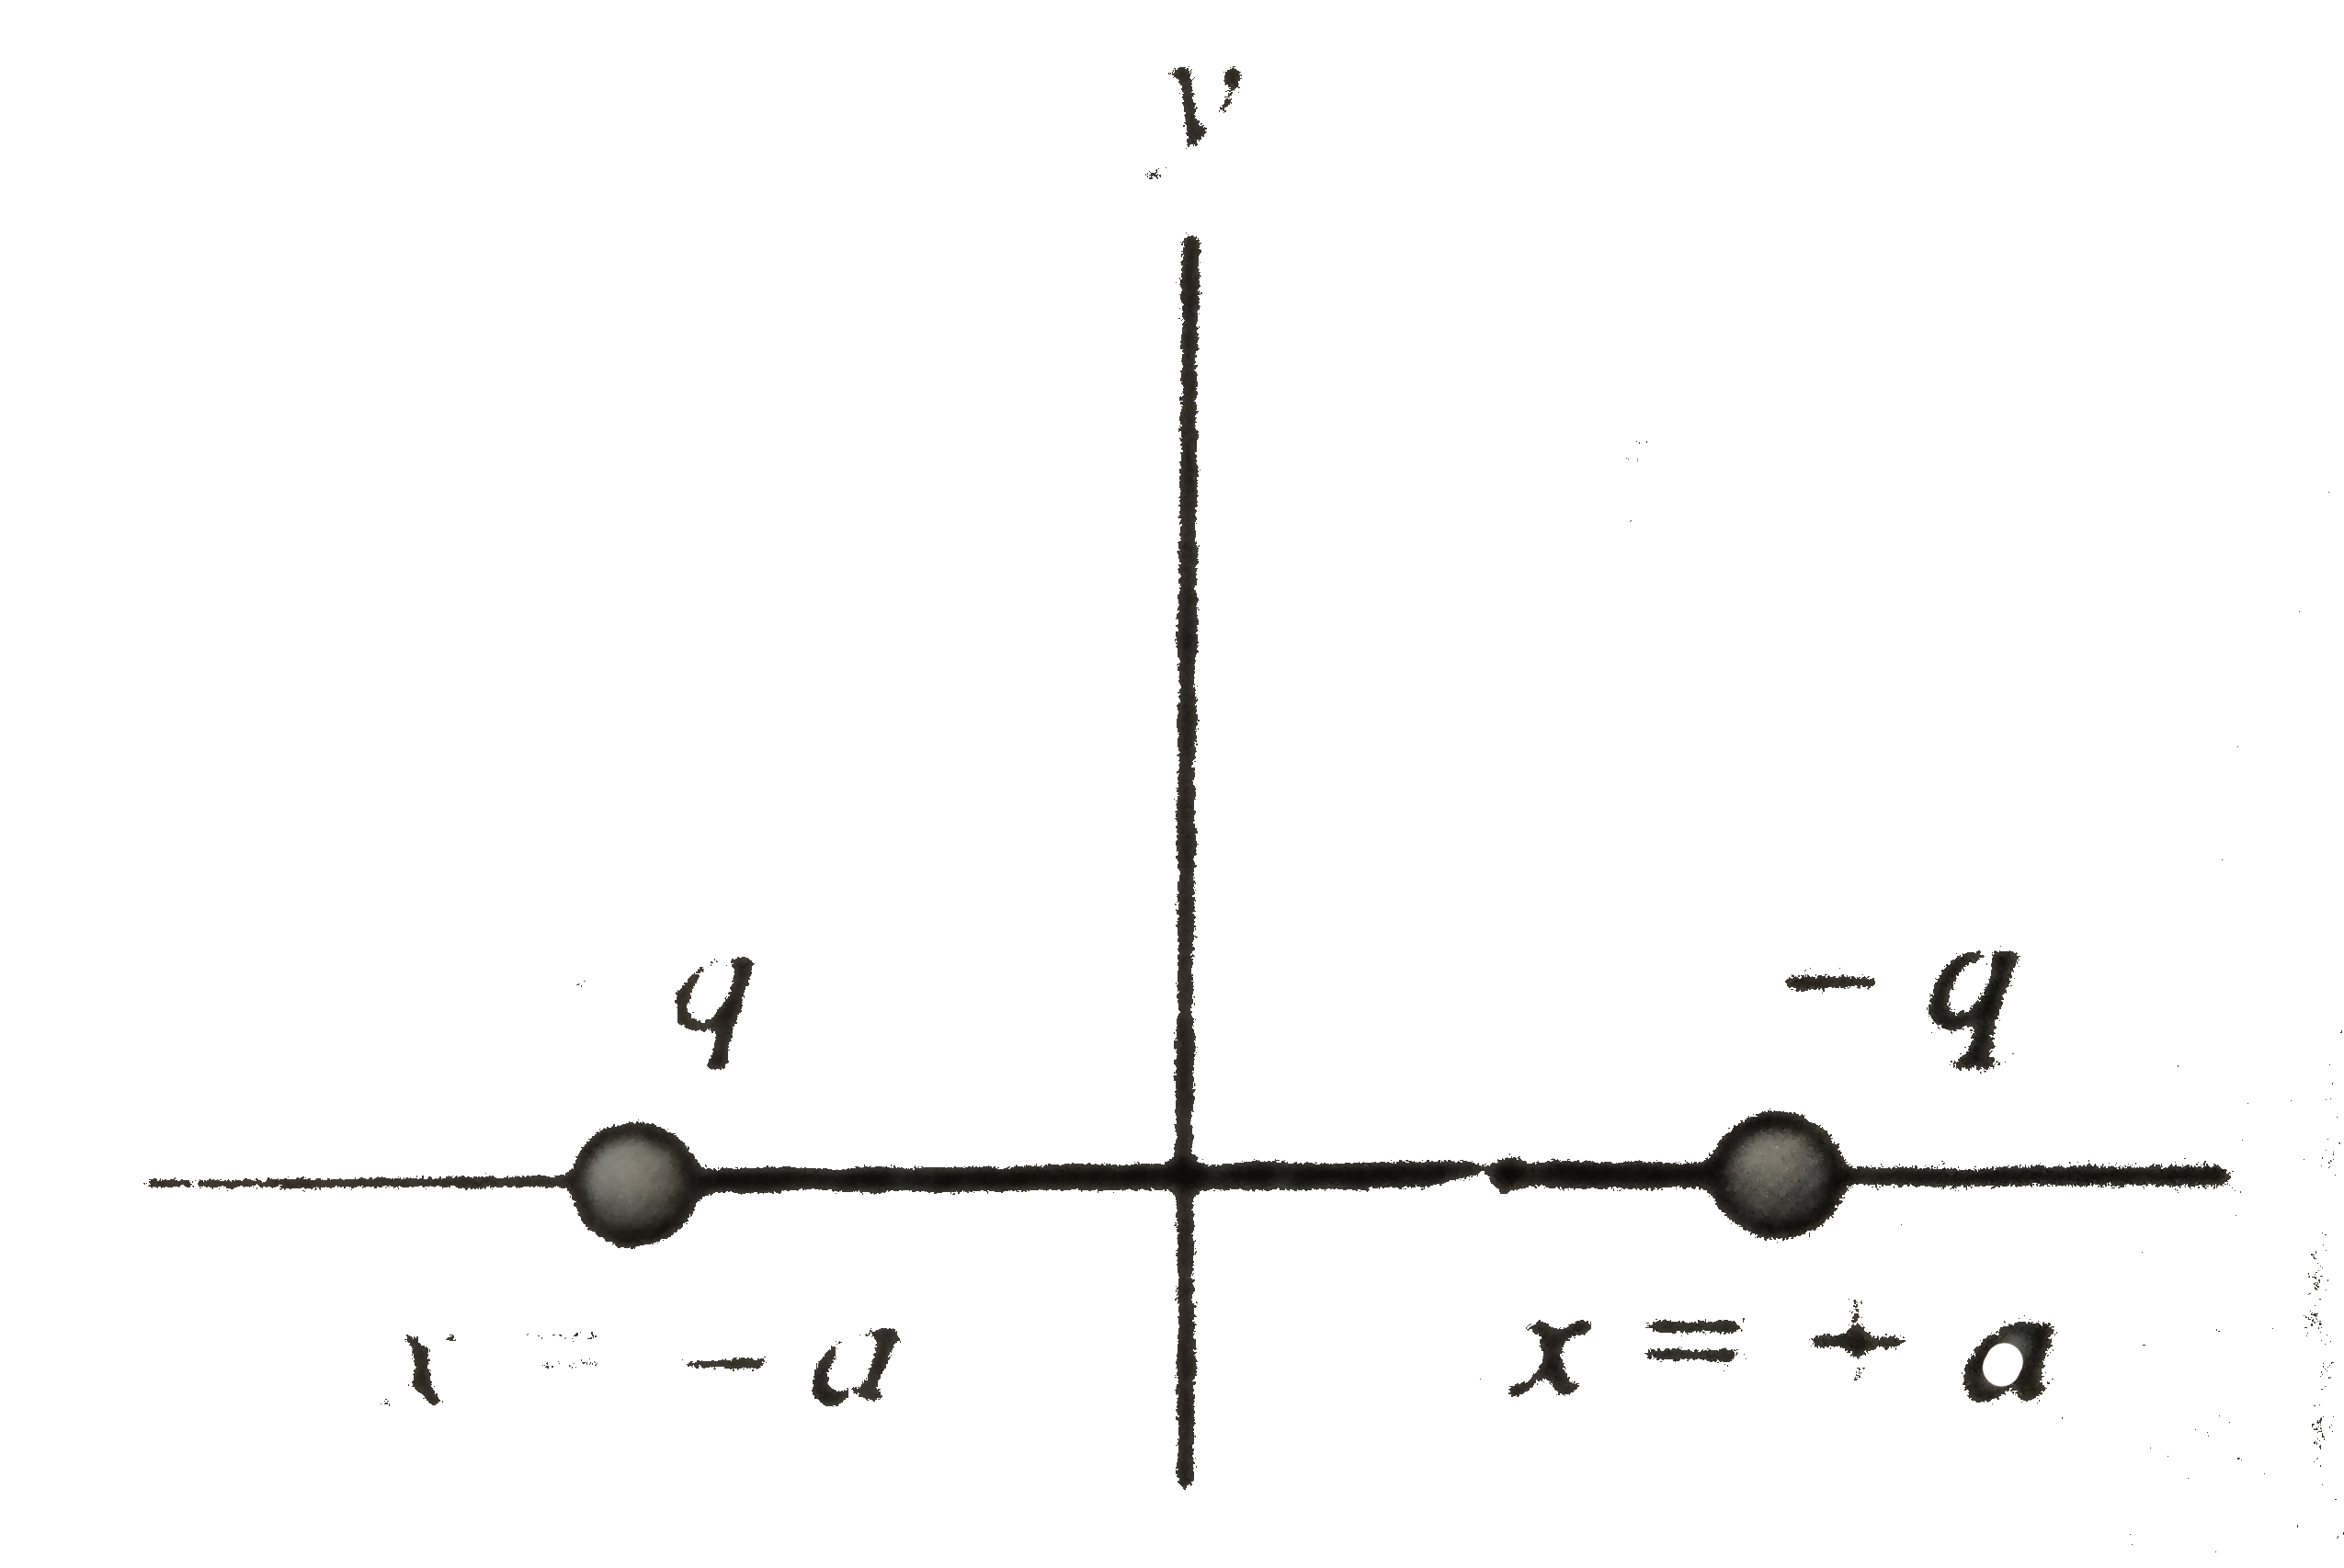
We can divide the x-axis into three region:
Region I (left of the charges): The field due to the left charge dominates and acts towards-x direction.
Region II(between the charges): From −a<x<0, the field of left charge dominater and acts towads.+x direction. At x=0,
resulant electric field is zero. from 0<x<a, the field of right charge dominaters and acts towards +x direction
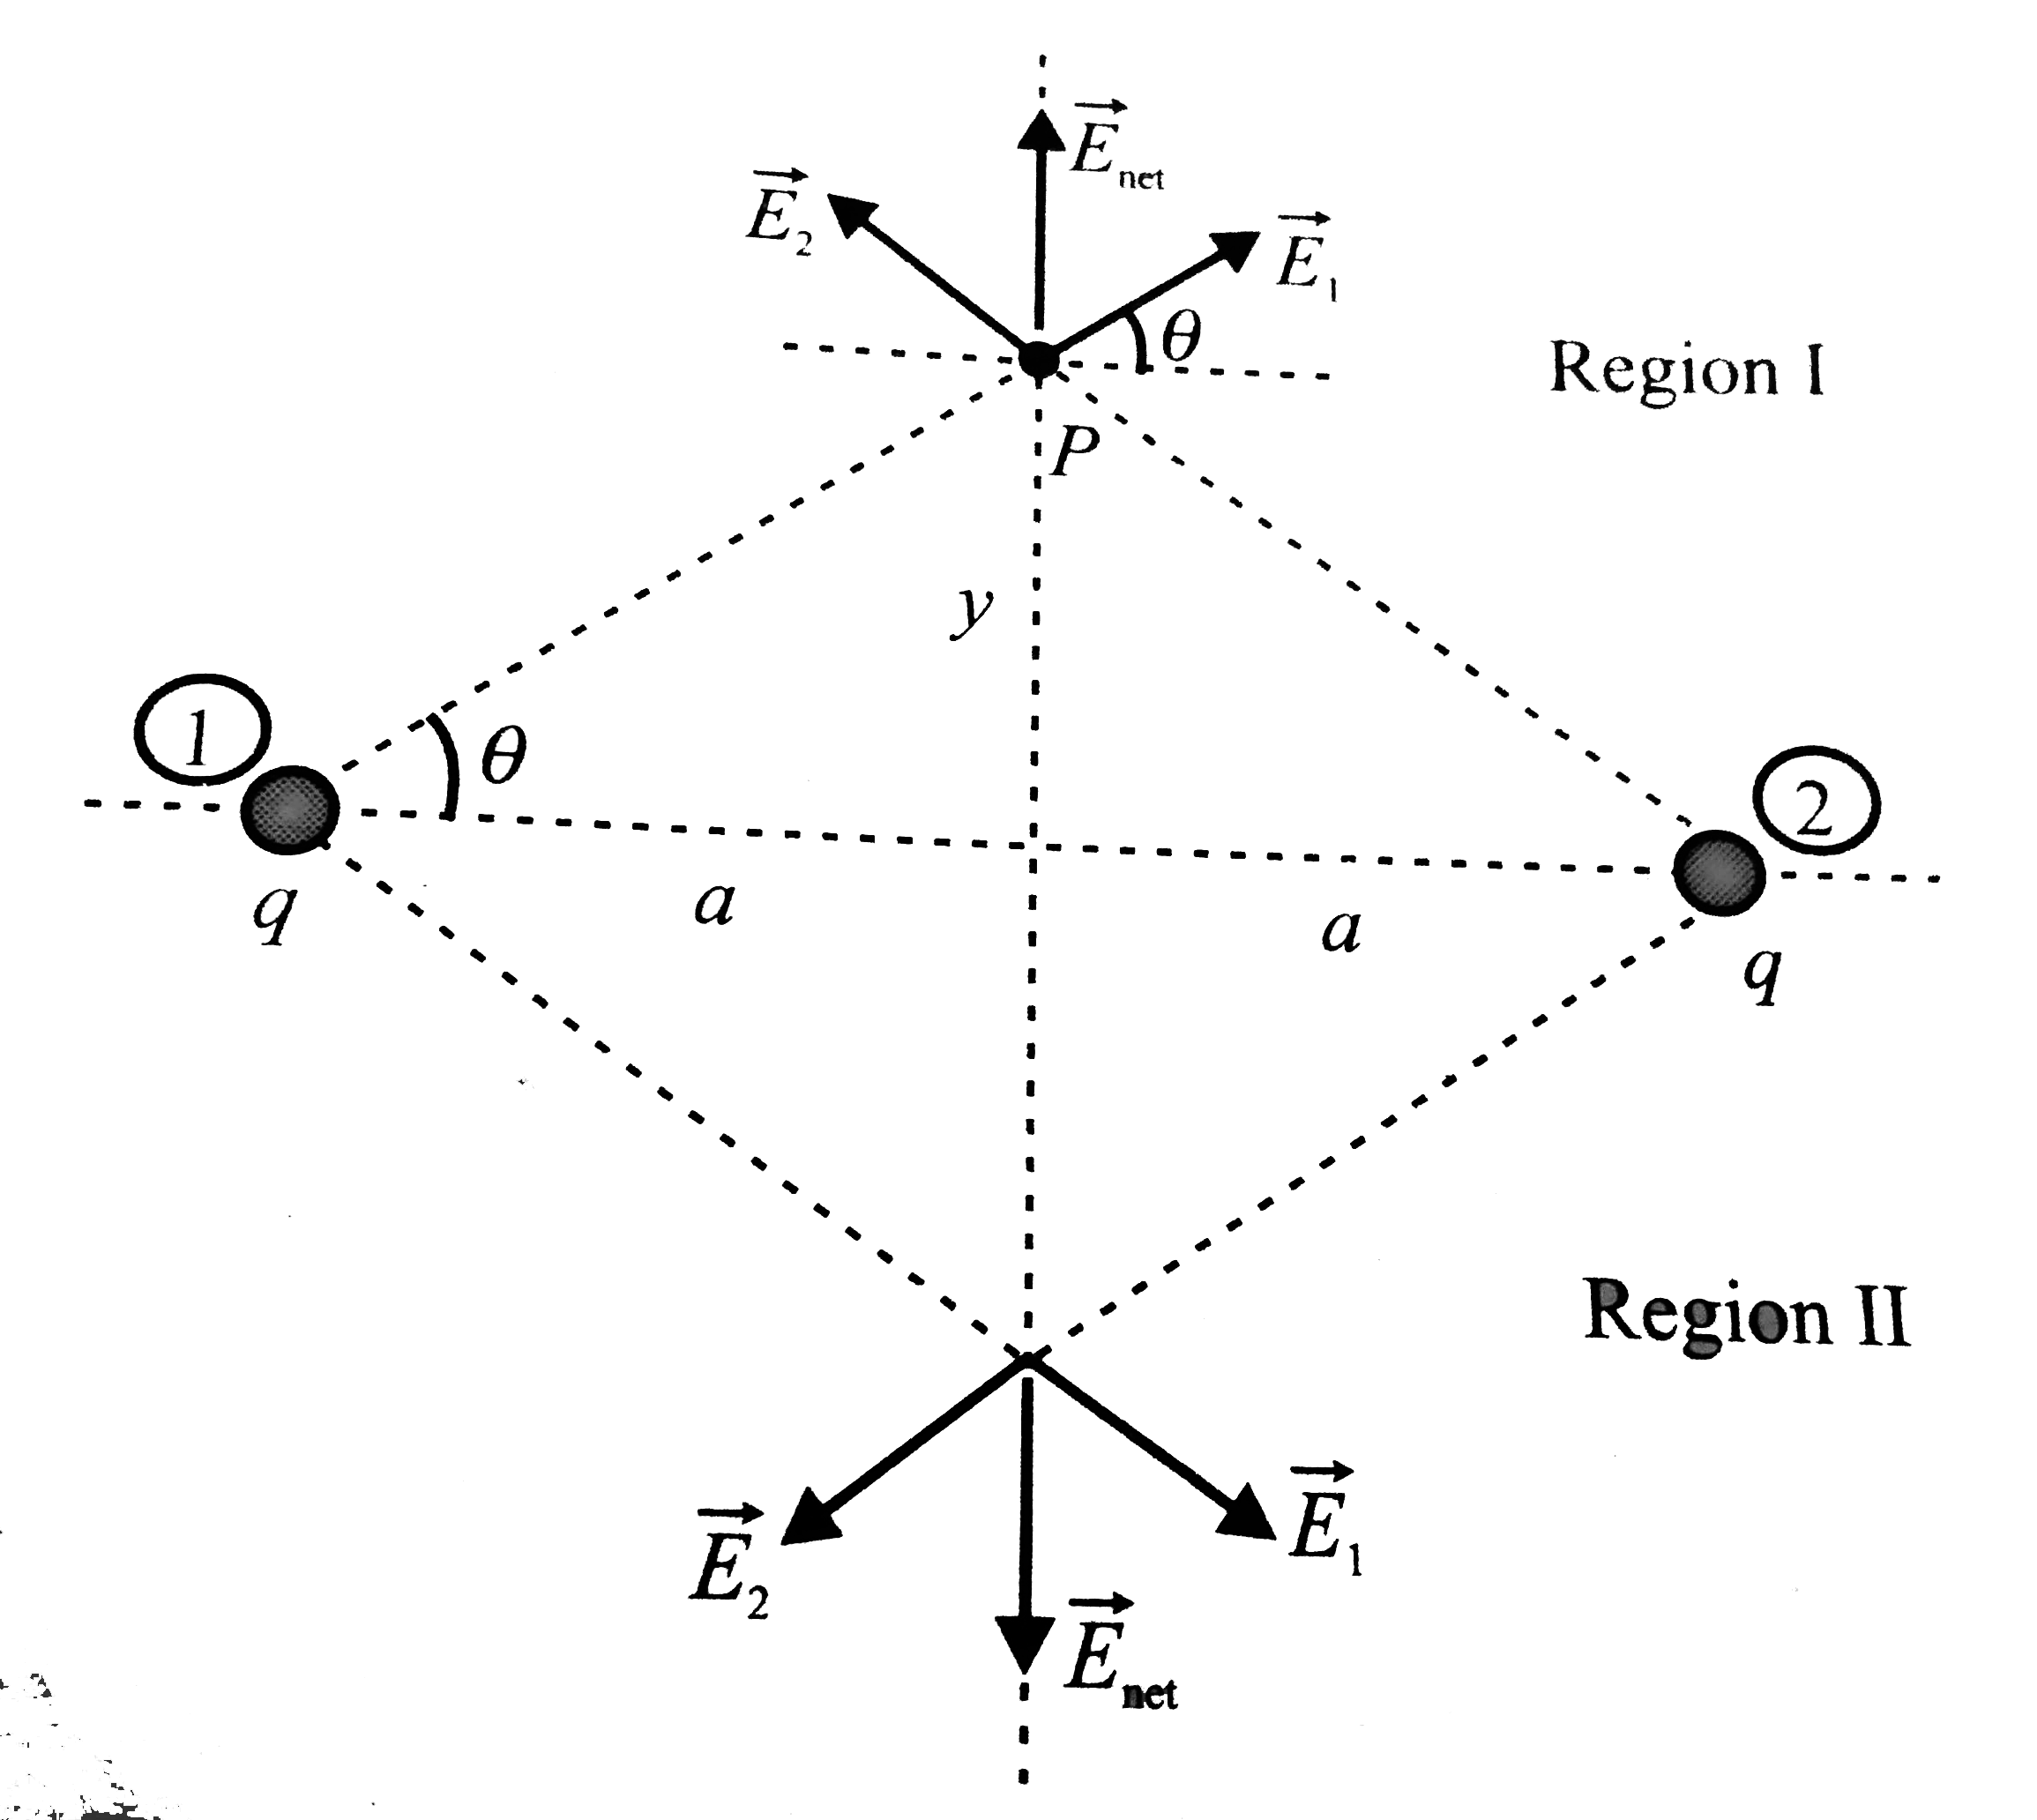
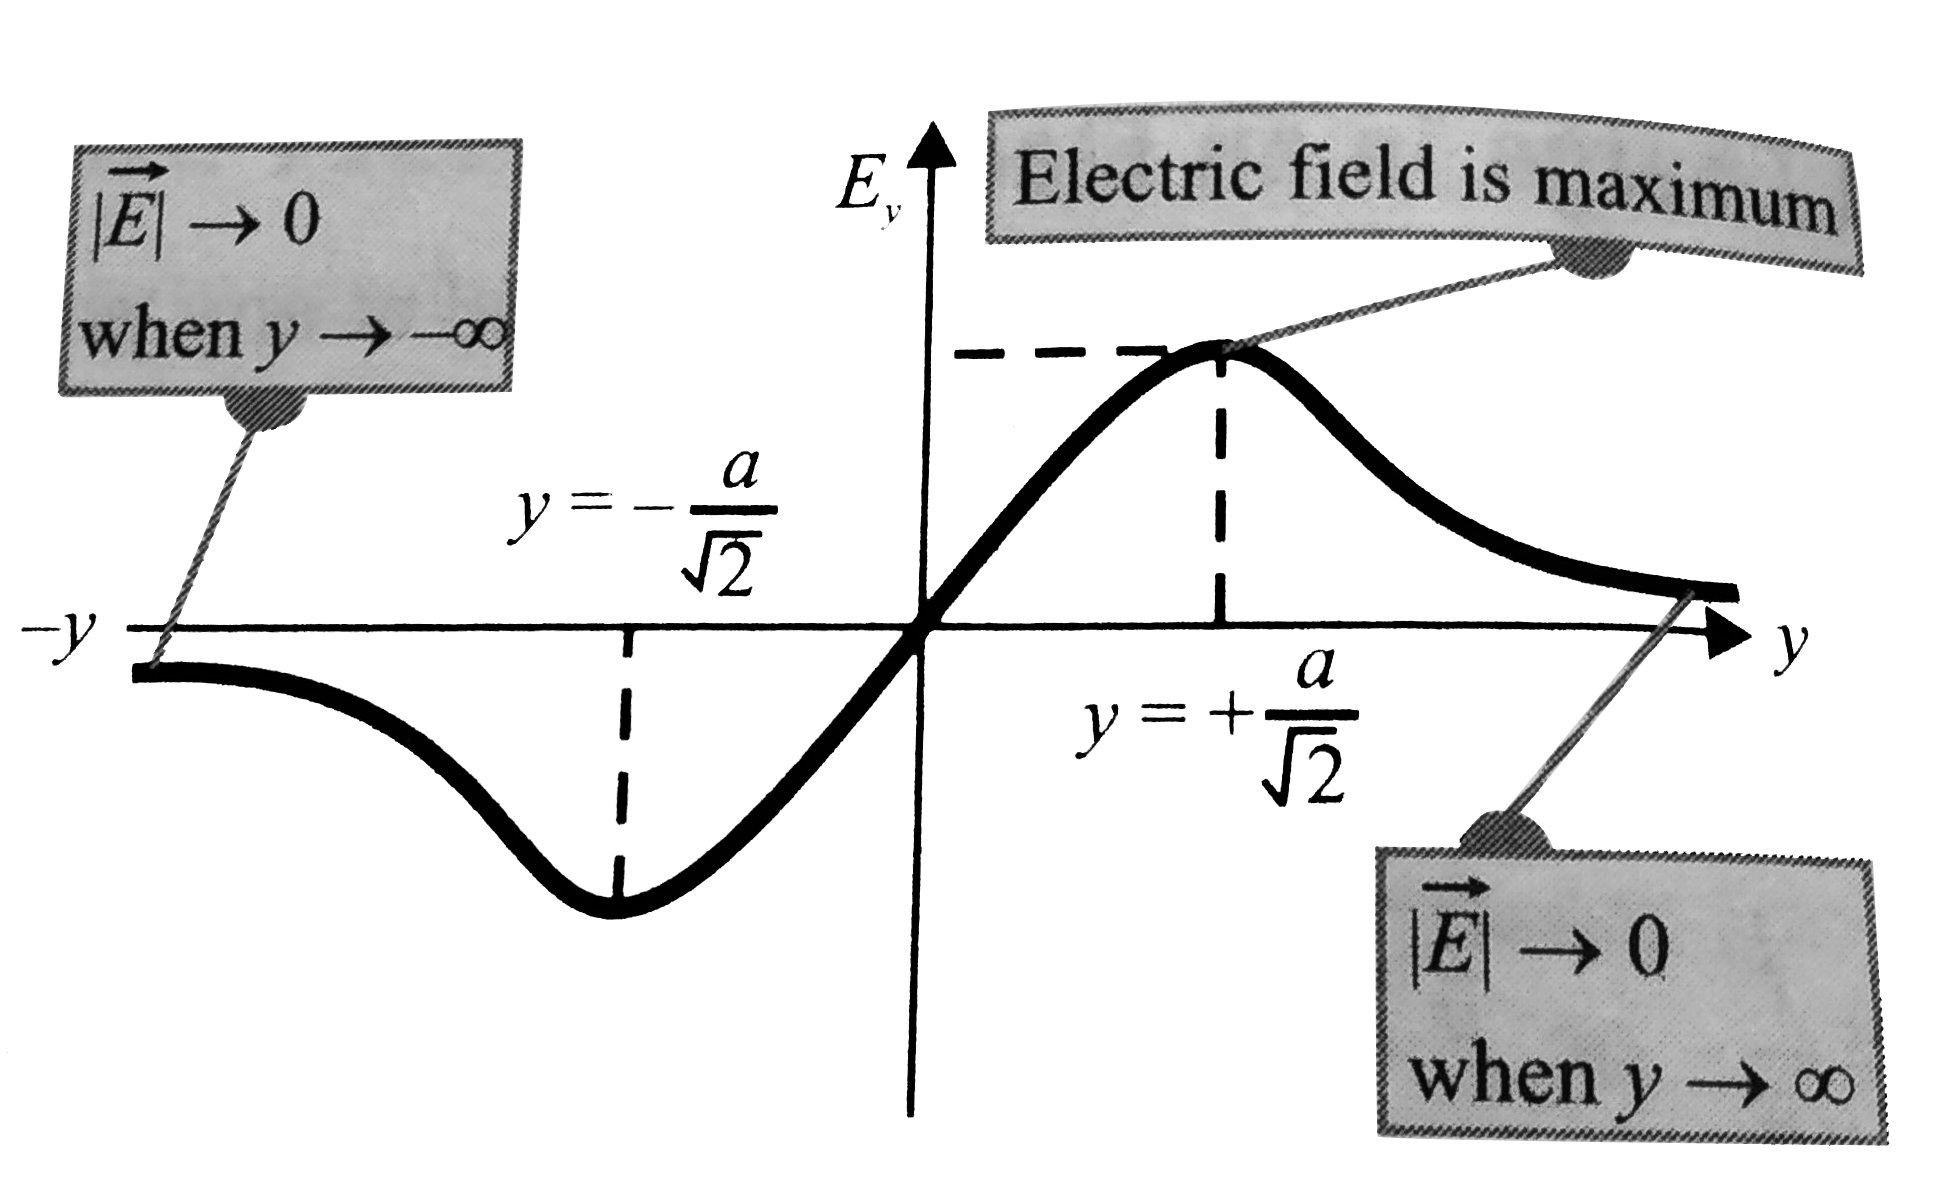
Variation of →E in the y-axis: we can divide the y-axis in two regions:
Resion I (above y-axis): Electric field is along +y direction.

Resion II (below y-axis ): Electric field is along y direction. Net electric field at P at a distance y from origin is
Enet=|E1|sinθ+|E2|sinθ=2|E1|sinθ as ∣∣→E1∣∣=∣∣→E2∣∣
=214πε0q(a2+y2)y(a2+y2)1/2
Hence, Enet=14πε0qy(a2+y2)3/2
For maximum or minimum value of Enet
dEnetdy=0=q2πε0[y(32)(a2+y2)−5/2(2y)+(a2+y2)−3/2(1)]
or, y=±a√2
Topper's Solved these Questions
- COULOMB LAW AND ELECTRIC FIELDBOOK - CENGAGE PHYSICSCHAPTER - COULOMB LAW AND ELECTRIC FIELDEXERCISE - Solved examples
10 Videos
- COULOMB LAW AND ELECTRIC FIELDBOOK - CENGAGE PHYSICSCHAPTER - COULOMB LAW AND ELECTRIC FIELDEXERCISE - Exercises
58 Videos
- COMMUNICATION SYSTEMBOOK - CENGAGE PHYSICSCHAPTER - COMMUNICATION SYSTEMEXERCISE - QUESTION BANK
19 Videos
- Current ElectricityBOOK - CENGAGE PHYSICSCHAPTER - Current ElectricityEXERCISE - QUESTION BANK
40 Videos
Similar Questions
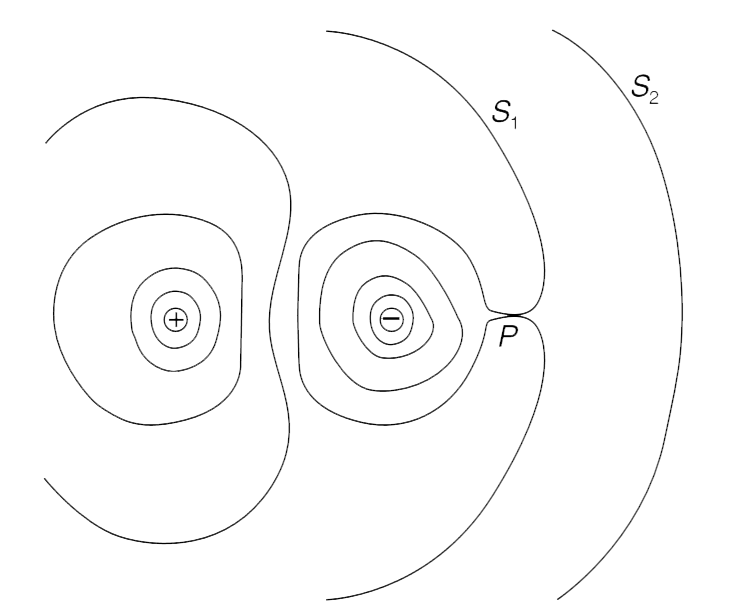
Three point charge have been placed along the x axis at points A, B and C. Distance AB = BC. The field lines generated by the system is shown in figure. (a) Plot the variation of electric potential along x axis. Show potential on y axis of your graph. (b) Plot the variation of electric potential along y axis with B as origin. Shows potential on x axis in your graph.
View SolutionTwo identical positive charges Q each are placed on the x axis at point (-a,0) and (a,0) A point charge of magnitude q is placed at the origin. For small displacement along x axis, the charge q executes simple harmonic motion if it is poitive and its time period is T1. if the charge q is negative, it perform oscillations when displaced along y axis. in this case the time period of small oscillations is T2. find T1T2
View Solution
Knowledge Check
Three charges are placed along x-axis at x = - a x = 0 and x = a as shown in the figure. The potential energy of the system is
 A−(14πε0)q2aB−(14πε0)3q22aC+(14πε0)q2aD+(14πε0)3q22a
In the figure, two point charges +qand−q are placed on the x-axis at (+a,0)and(−a,0) respectively. A tiny dipole of dipolem moment (p) is kept at the origin along the y-axis. The torque on the dipole equals
 AzeroBqp2πε0a2Cqp4πε0a2Dqpπε0a2
Two identical positive charges are placed at x=−a and x=a. The correct variation of potential V along the x-axis is given by
A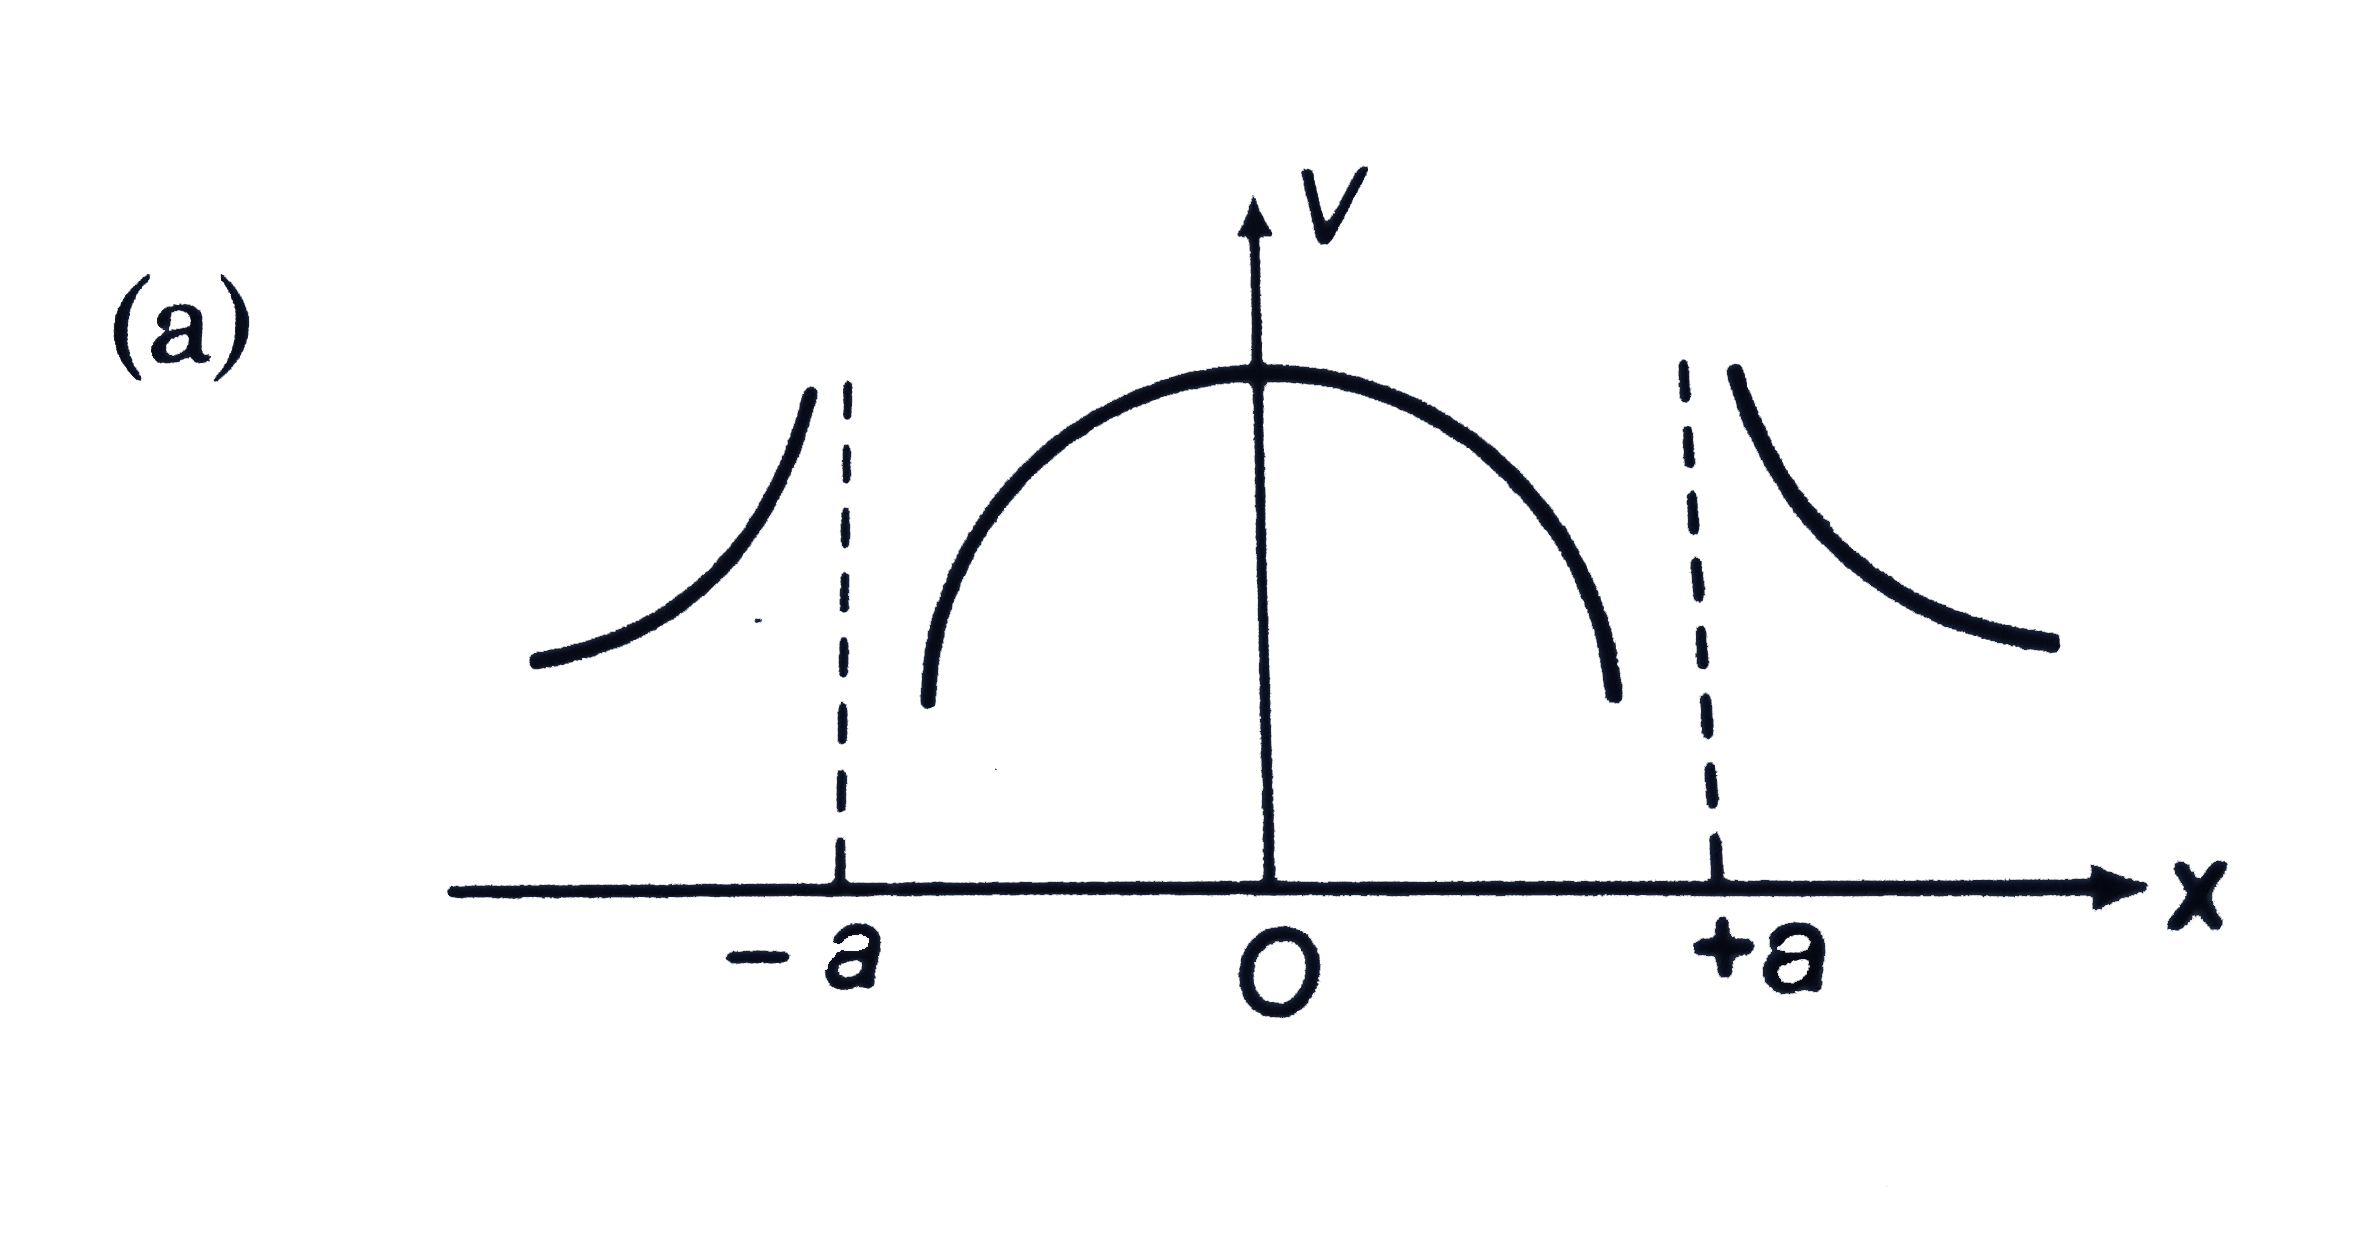 B
B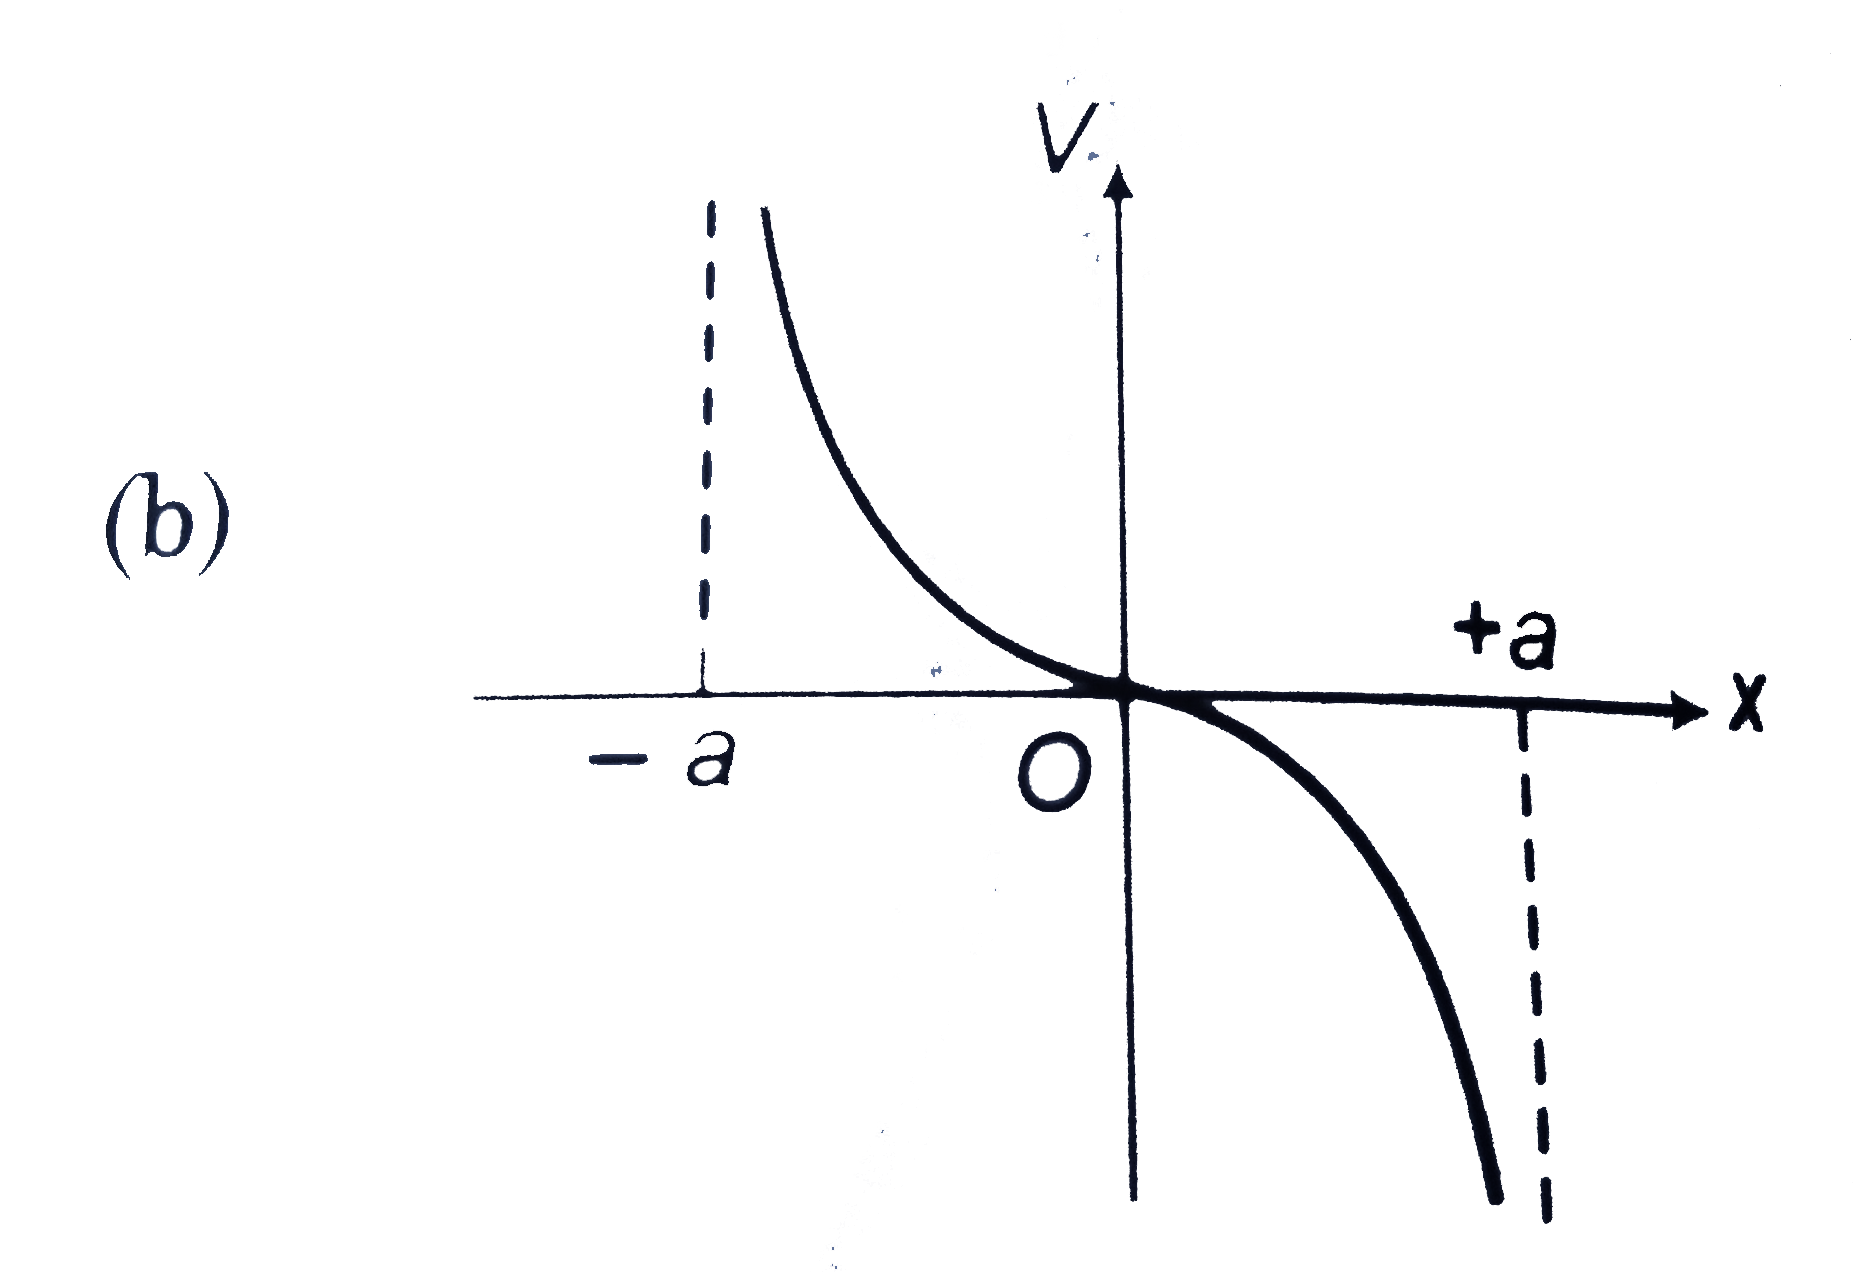 C
C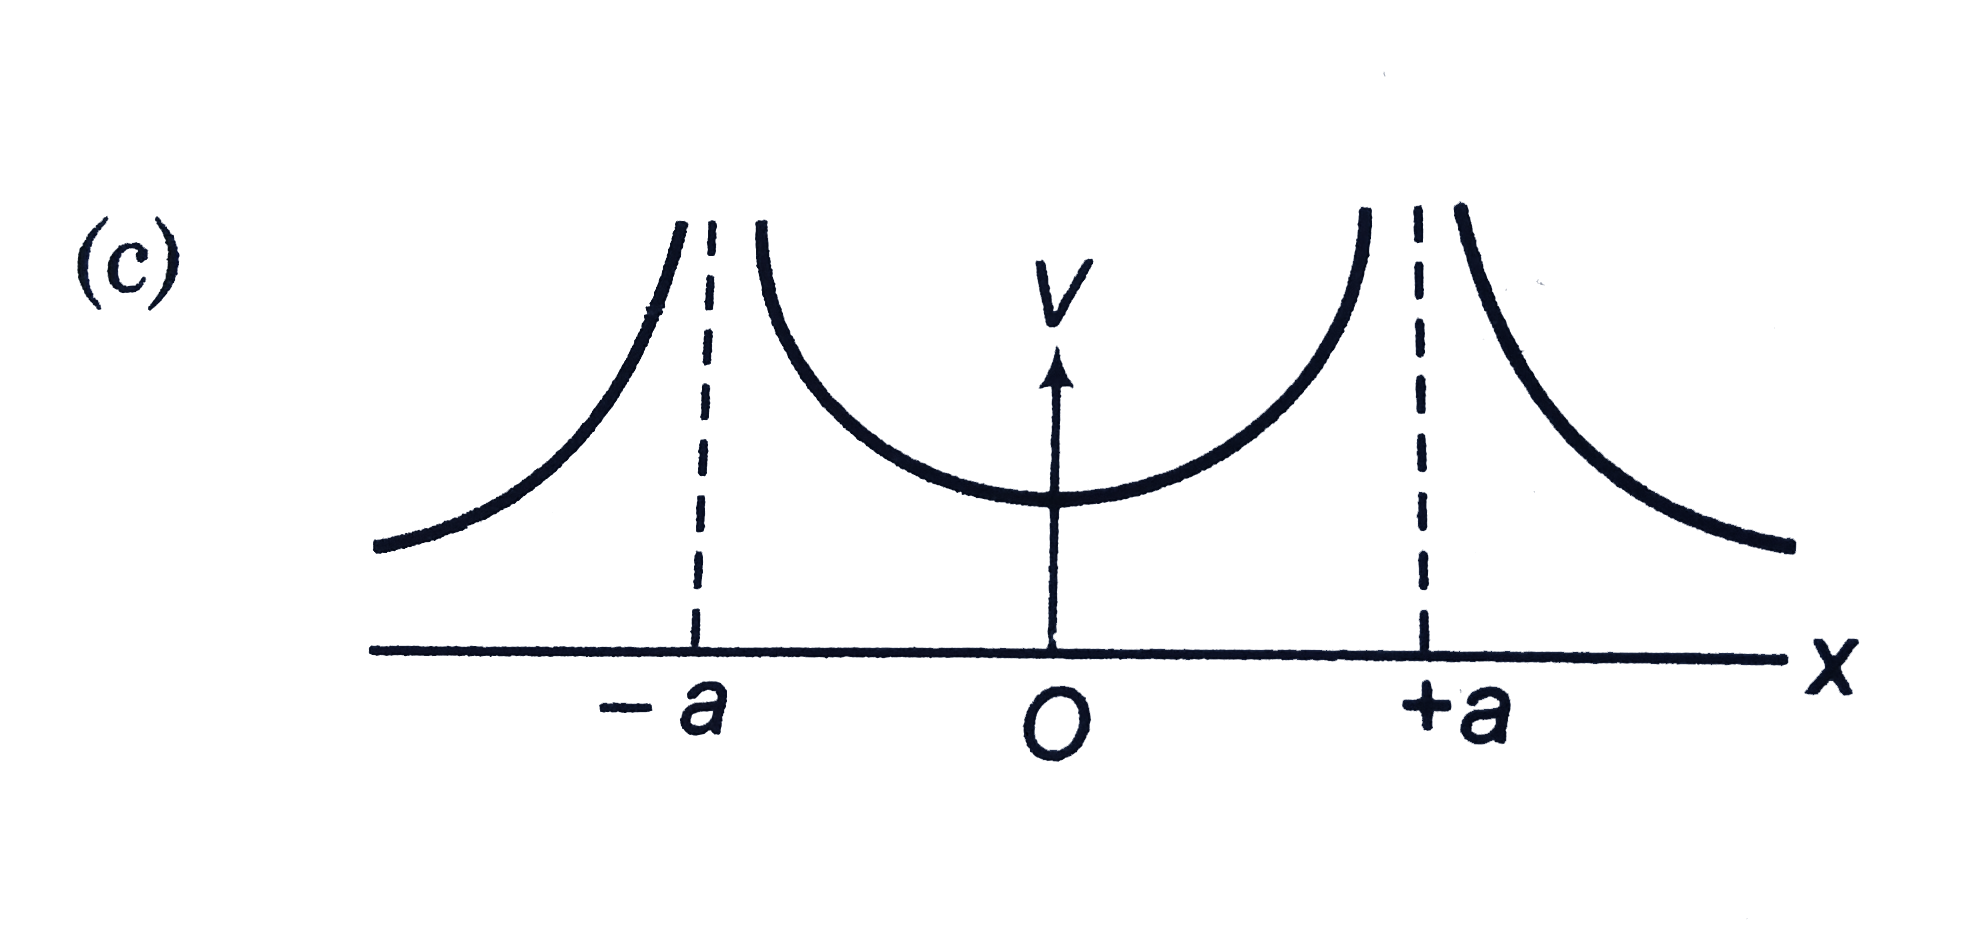 D
D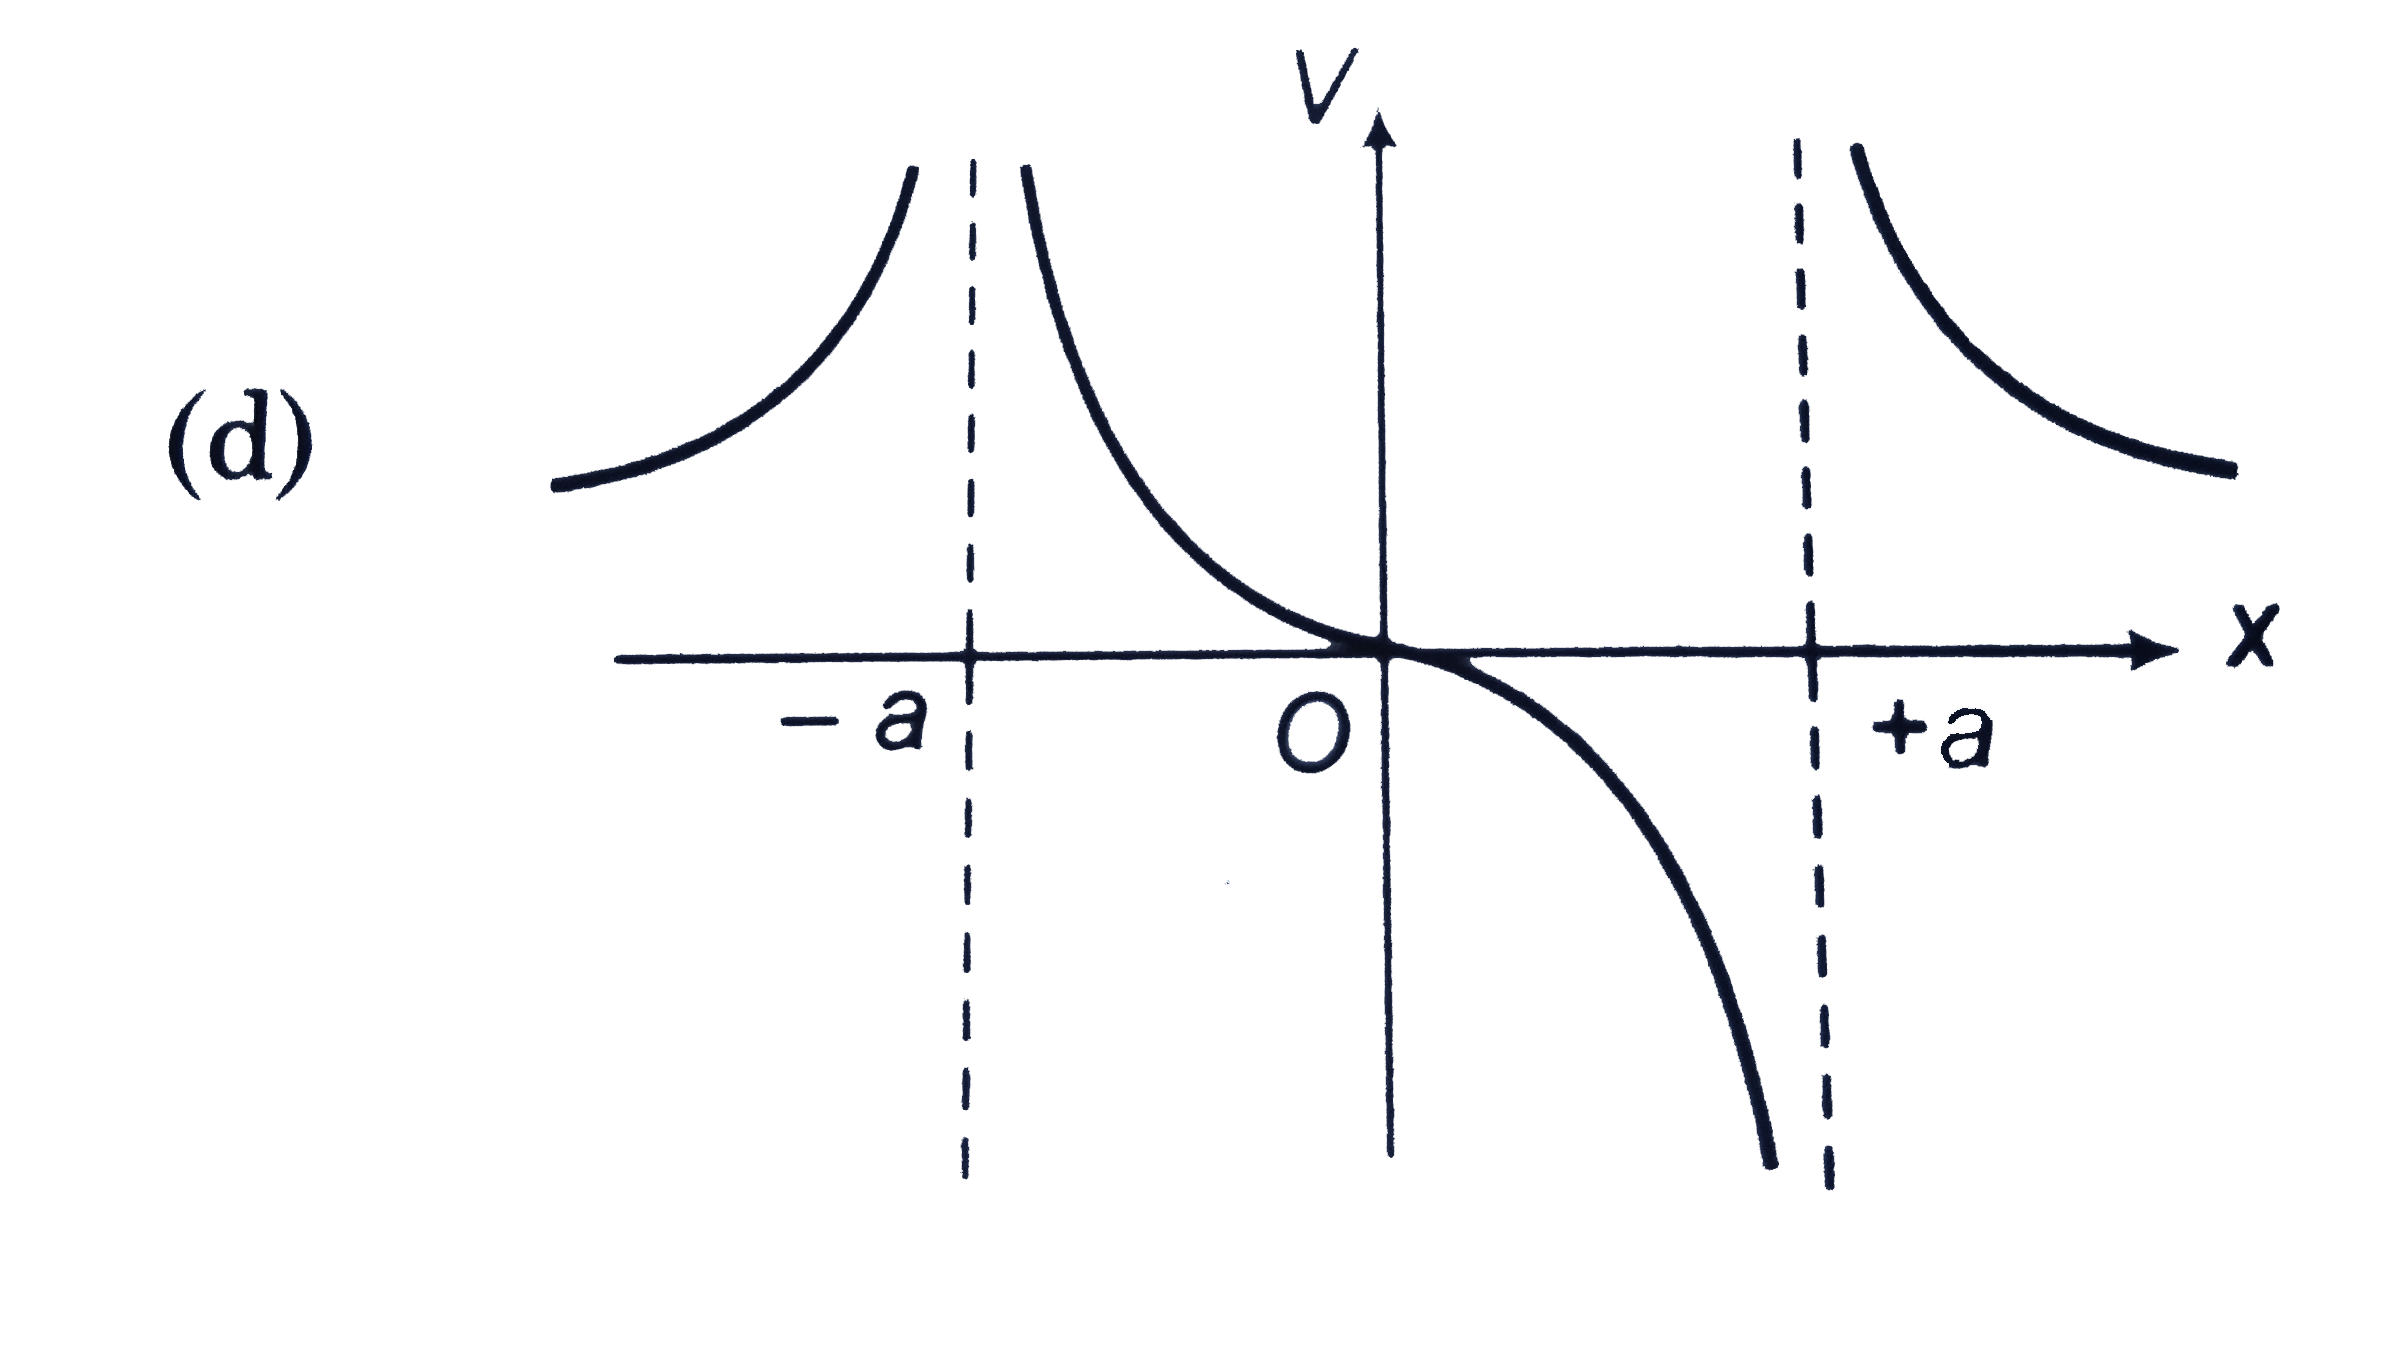
A graph is plotted taking ∘––C along the Y - axis and of along the X - axis .It is a /an
View SolutionTwo identical spherical balls, each of mass m, are placed as shown in figure. Plot the variation of g(gravitation intensity) along the x-axis due to both the masses.
View SolutionTwo point charges are located on the x - axis : q1=−e at x=0 and q2=+e at x=a and q3=+e at x=2a.
The total potential energy of the system of three charges.
View SolutionA graph is plotted taking .∘C along the Y-axis and .∘F along the X-axis. It is a/an
View SolutionTwo point charges (Q each are placed at (0,y) and (0-y) A point charge q of the sme polarity can move along the x-axis. Then
View Solution
