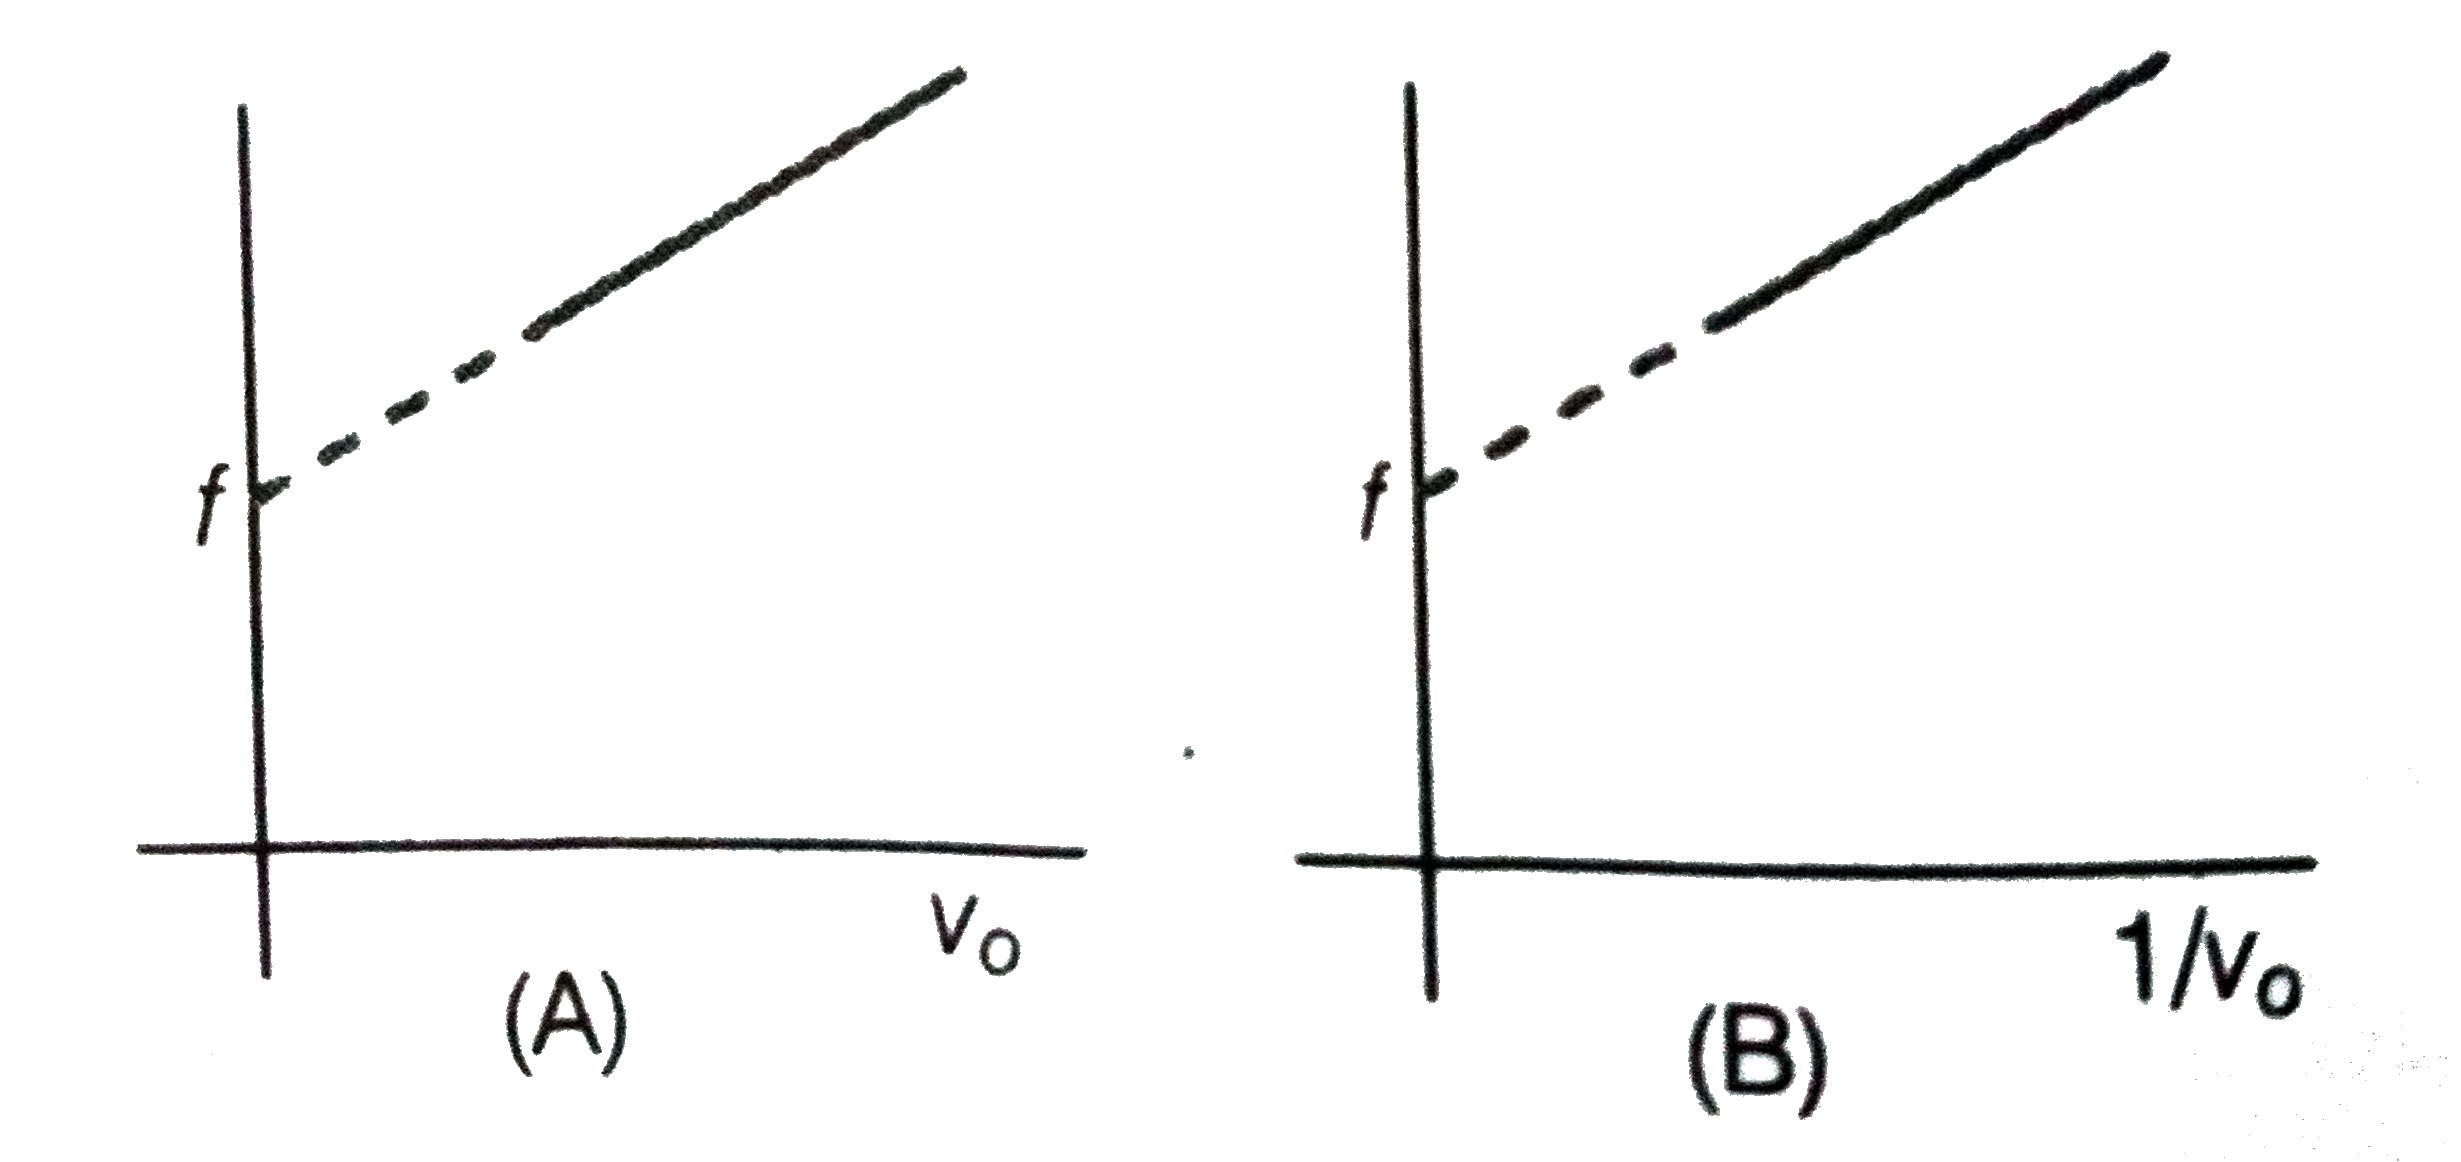
A source of sound emits sound waves at frequency f0. It is moving towards an observer with fixed speed vs (vs<v, where v is the speed of sound in air). If the observer were to move towards the source with sped v0, one of the following two graphs (A and B) wil given the correct variation of the frequency f heard by the observer as v0 is changed. The variation of f with v0 is given correctly by

graph A with slope =f0(v+vs)
graph B with slope =f0(v−vs)
graph A with slope =f0(v−vs)
graph B with slope =f0(v+vs)
The correct Answer is:C
According to Doppler's effect, the apparent frequency of sound when both source and observer are moving towards each other
i.e. f=[v+vov−vs]f0⇒f=(vv−vs)f0+(vov−vs)fo
⇒f=(f0v−vs)vo+(f0v−vs)v
As, y=mx+c which is the equation of straight line making an intercept c on y-axis.
So, the slope of the graph =f0v−vs and intercept =vf0v−vs
This condition is represented in graph (A) plotted between F and vo.
Hence, option (c) is correct.
Topper's Solved these Questions
- WAVE MOTIONBook:MHTCET PREVIOUS YEAR PAPERS AND PRACTICE PAPERSChapter:WAVE MOTIONExercise:Exercise 2
Explore 30 Videos
- WAVE MOTIONBook:MHTCET PREVIOUS YEAR PAPERS AND PRACTICE PAPERSChapter:WAVE MOTIONExercise:MHT CET CORNER
Explore 23 Videos
- WAVE MOTIONBook:MHTCET PREVIOUS YEAR PAPERS AND PRACTICE PAPERSChapter:WAVE MOTIONExercise:MHT CET CORNER
Explore 23 Videos
- SURFACE TENSION Book:MHTCET PREVIOUS YEAR PAPERS AND PRACTICE PAPERSChapter:SURFACE TENSION Exercise:MHT CET Corner
Explore 15 Videos
- WAVE THEORY OF LIGHT Book:MHTCET PREVIOUS YEAR PAPERS AND PRACTICE PAPERSChapter:WAVE THEORY OF LIGHT Exercise:MHT CET CORNER
Explore 4 Videos
Similar Questions
A source of sound emits sound waves at frequency f0. It is moving towards an observer with fixed speed vs(vs<v where v is the speed in air). If the observer were to move towards the source with speed v0 one of the following two graphs (A and B) will give the correct variation of the frequency f heard by the observer as v0 is changed,
_E01_169_Q01.png)
The variation of f with v0 is given correctly by :-
View SolutionA source emitting sound of frequency 1000 Hz is moving towards an observer at speed vs=0.90v, (where v is the velocity of sound). What frequency III will be heard by the observer ?
View Solution
Knowledge Check
A source of sound emits sound waves at frequency f0. It is moving towards an observer with fixed speed vs(vs<v where v is the speed in air). If the observer were to move towards the source with speed v0 one of the following two graphs (A and B) will give the correct variation of the frequency f heard by the observer as v0 is changed,
_E01_169_Q01.png)
The variation of f with v0 is given correctly by :-Agraph A with slope =f0(v+vs)Bgraph B with slope =f0(v−vs)Cgraph B with slope =f0(v+vs)Dgraph A with slope =f0(v−vs)A source of sound produces waves of wave length 48cm. This source is moving towards north with speed V/4 where V is speed of sound. The apparent wavelength of the waves to an observer standing south of the moving source will be
A48cmB60cmC72cmD96cm
A source emitting sound of frequency 1000 Hz is moving towards an observer at speed vs=0.90v,(where v is the velocity of sound) . What frequency will be heard by the observer ?
View SolutionA source of sound of frequency 500 Hz is moving towards an observer with velocity 30 m/s . The speed of sound is 330 m/s . the frequency heard by the observer will be
View SolutionA source of sound of frequency 500 Hz is moving towards an observer with velocity 30 m/s . The speed of sound is 330 m/s . the frequency heard by the observer will be
View SolutionA source of sound emitting a note of frequency 200 Hz moves towards an observer with a velocity v equal to the velocity of sound. If the observer also moves away from the source with the same velocity v, the apparent frequency heard by the observer is
View SolutionA source of sound emitting a note of frequency 200 Hz moves towards an observer with a velocity v equal to the velocity of sound. If the observer also moves away from the source with the same velocity v, the apparent frequency heard by the observer is
View SolutionA source of sound of frequency n is moving towards a stationary observer with a speed S. If the speed of sound in air is V and the frequency heard by the observer is n1 ,the value of n1/n is
View Solution

