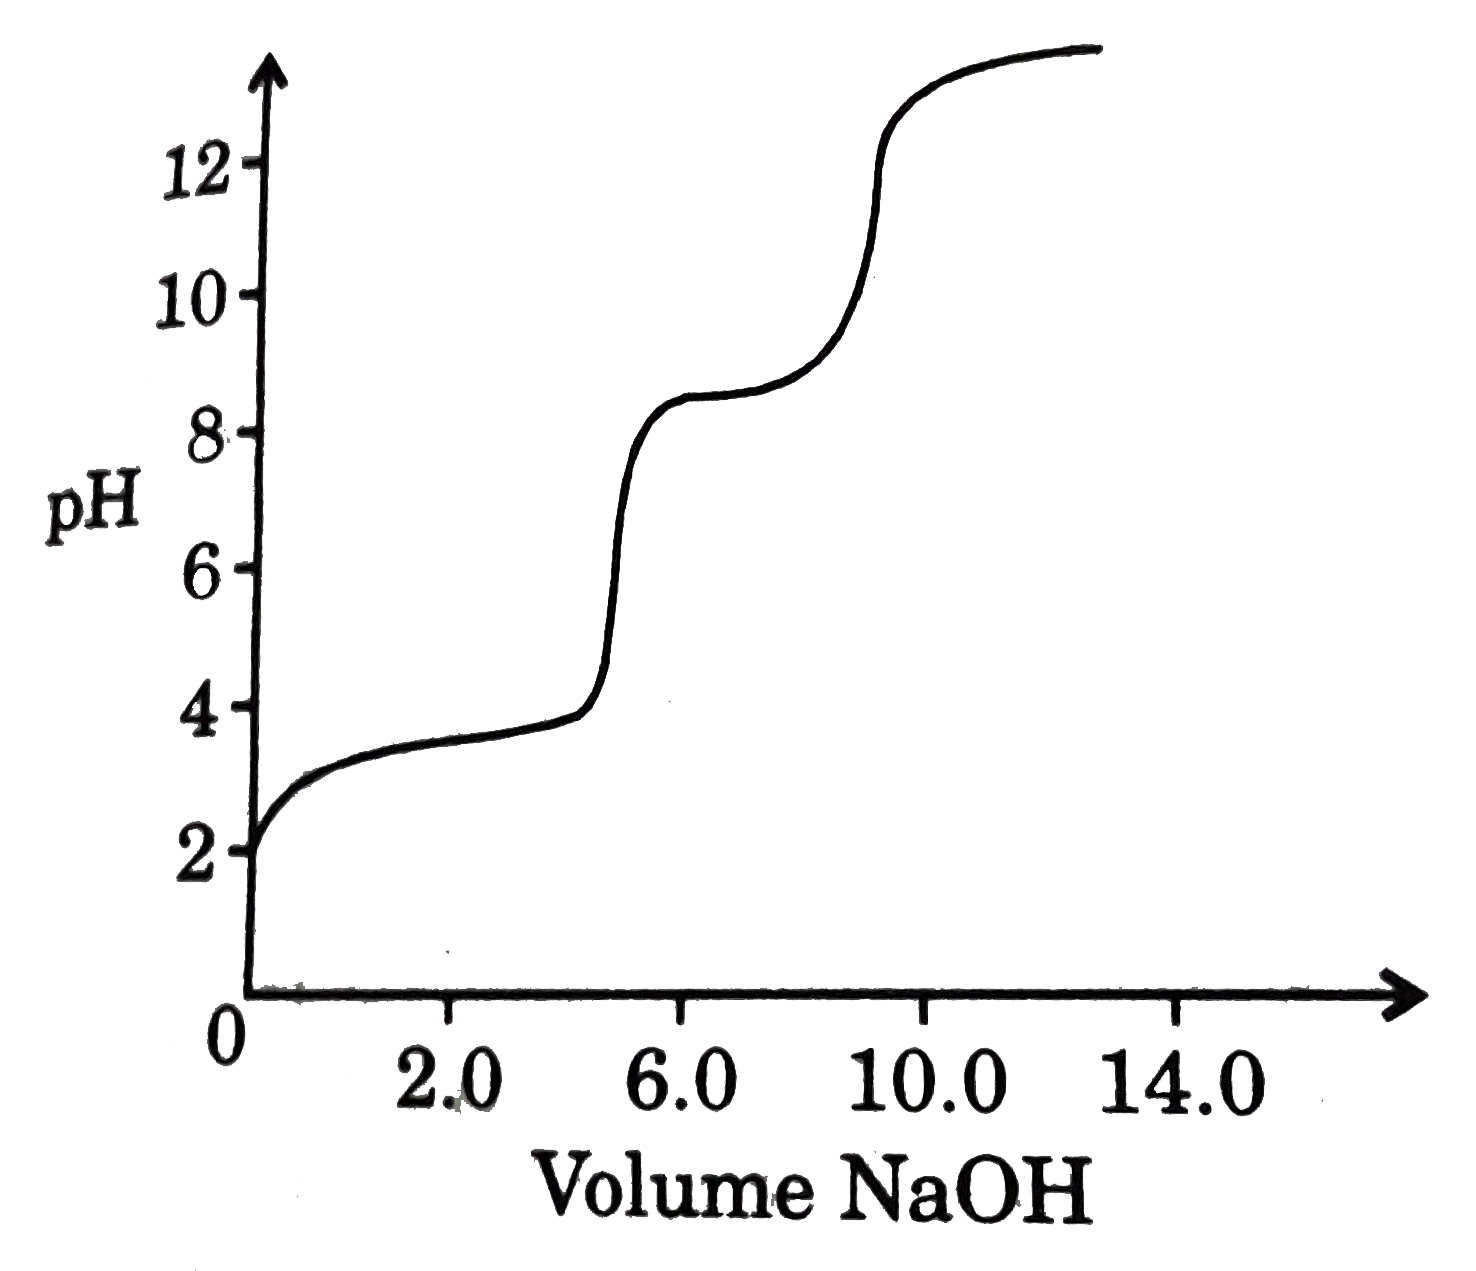
Which curve in figure represents the curve of ideal gas ?
A
B only
B
C and D only
C
E and F only
D
A and B only
Video Solution
Text Solution
The correct Answer is:A
For ideal gas PV = constant at all pressures
|
Topper's Solved these Questions
- STATES OF MATTER BOOK - NCERT FINGERTIPSCHAPTER - STATES OF MATTER EXERCISE - NCERT (EXEMPLAR PROBLEMS)
2 Videos
- STATES OF MATTER BOOK - NCERT FINGERTIPSCHAPTER - STATES OF MATTER EXERCISE - Assertion And Reason
15 Videos
- STATES OF MATTER BOOK - NCERT FINGERTIPSCHAPTER - STATES OF MATTER EXERCISE - Higher Order Thinking Skills
8 Videos
- SOME BASIC CONCEPTS OF CHEMISTRY BOOK - NCERT FINGERTIPSCHAPTER - SOME BASIC CONCEPTS OF CHEMISTRY EXERCISE - Assertion And Reason
10 Videos
- STRUCTURE OF ATOM BOOK - NCERT FINGERTIPSCHAPTER - STRUCTURE OF ATOM EXERCISE - Assertion And Reason
15 Videos
Similar Questions
Knowledge Check
Given curve represents
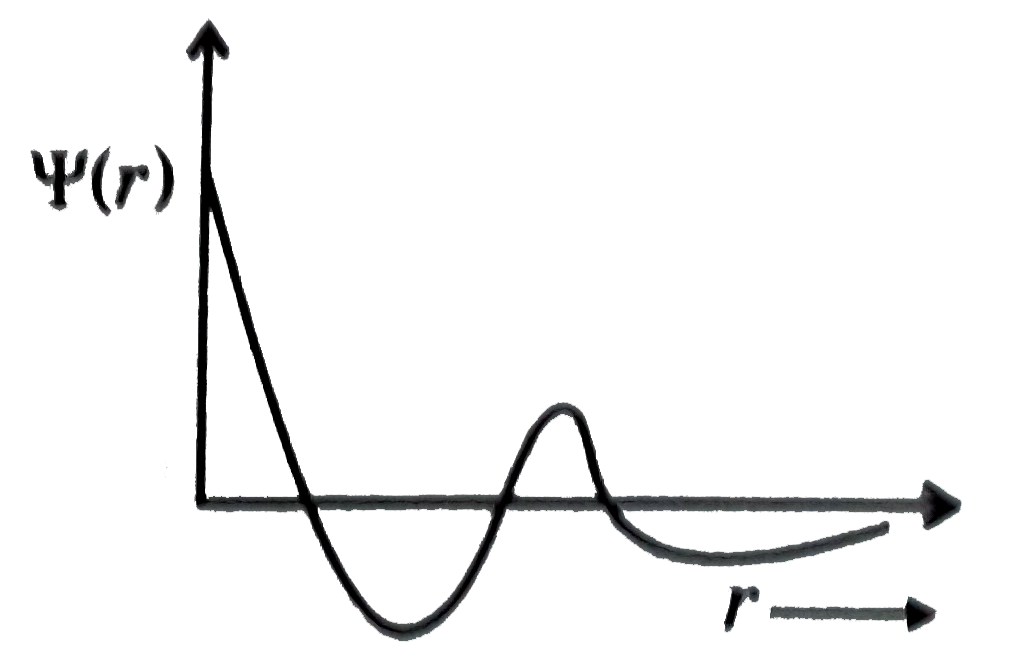 A3s orbitalB4s orbitalC2s orbitalD2s orbital
Which curve in the following graph represents the curve of ideal gas ?
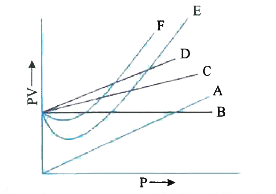 AB onlyBC and D onlyCE and F onlyDA and B only
Which of the following curves represents the chemical adsorption ?
A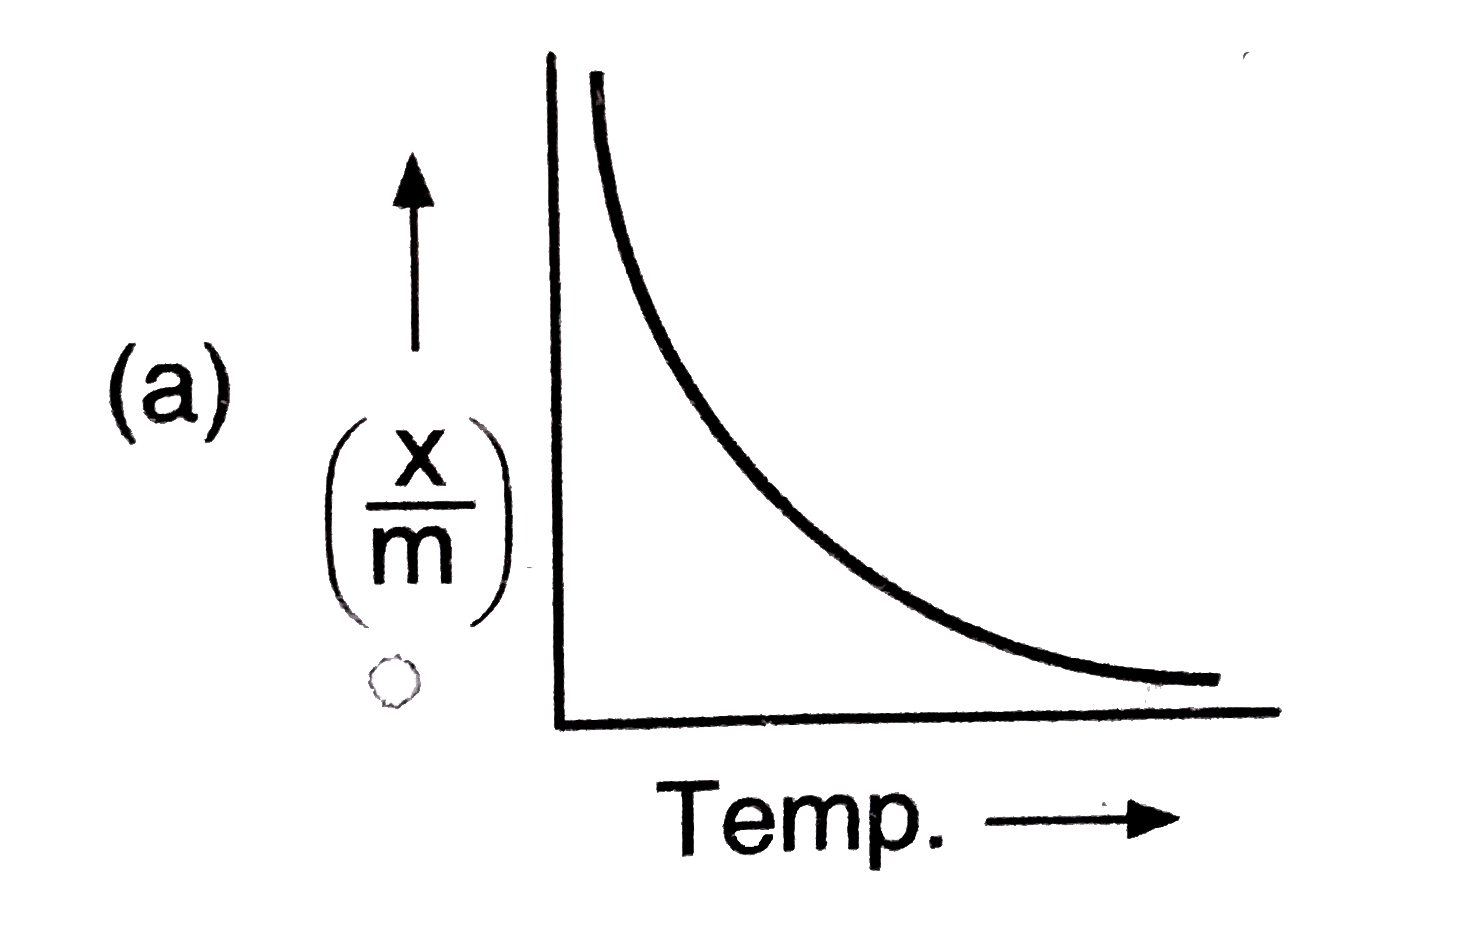 B
B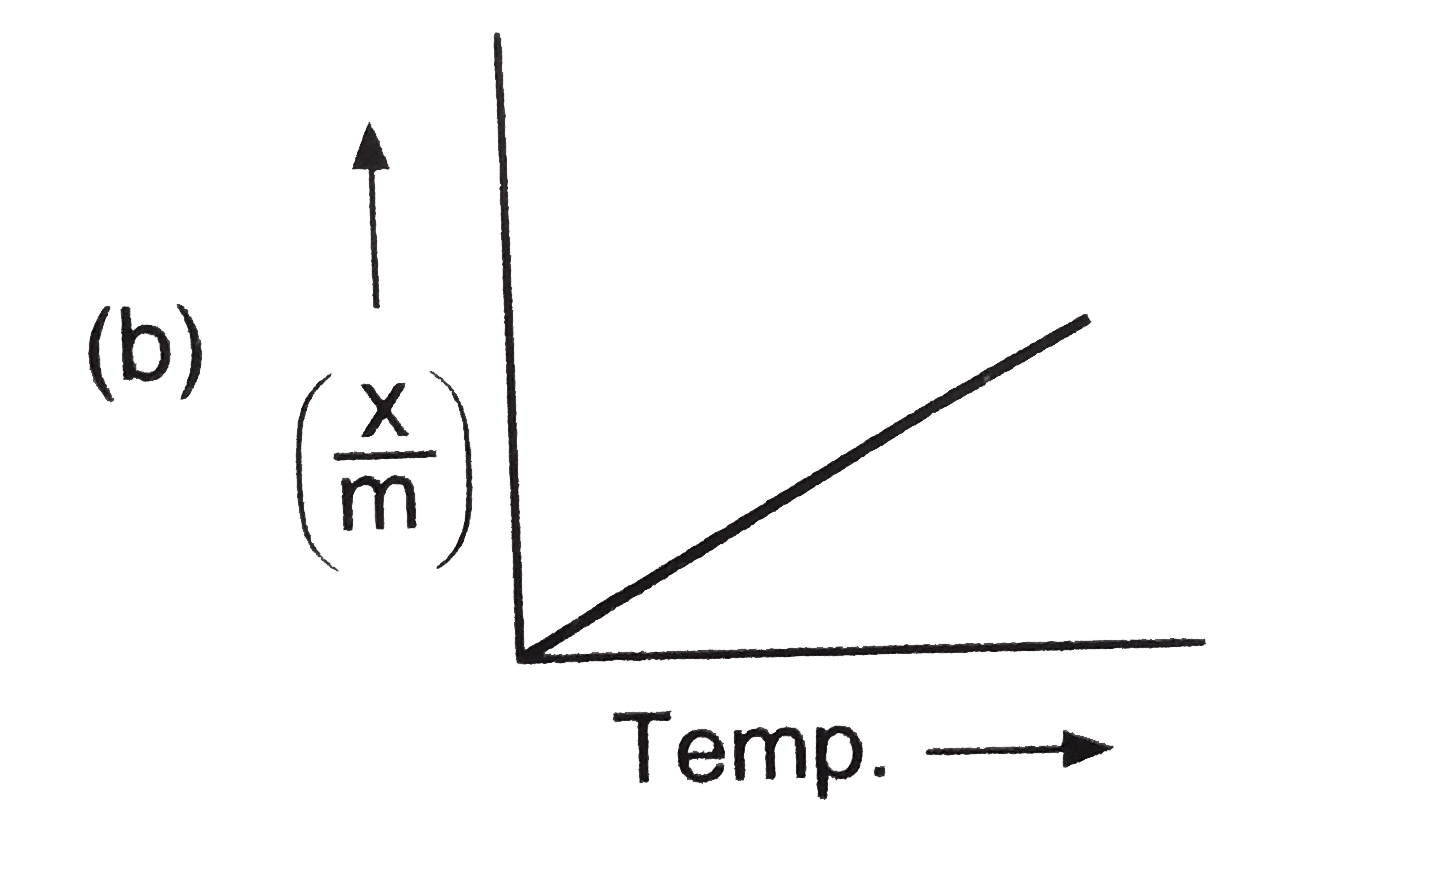 C
C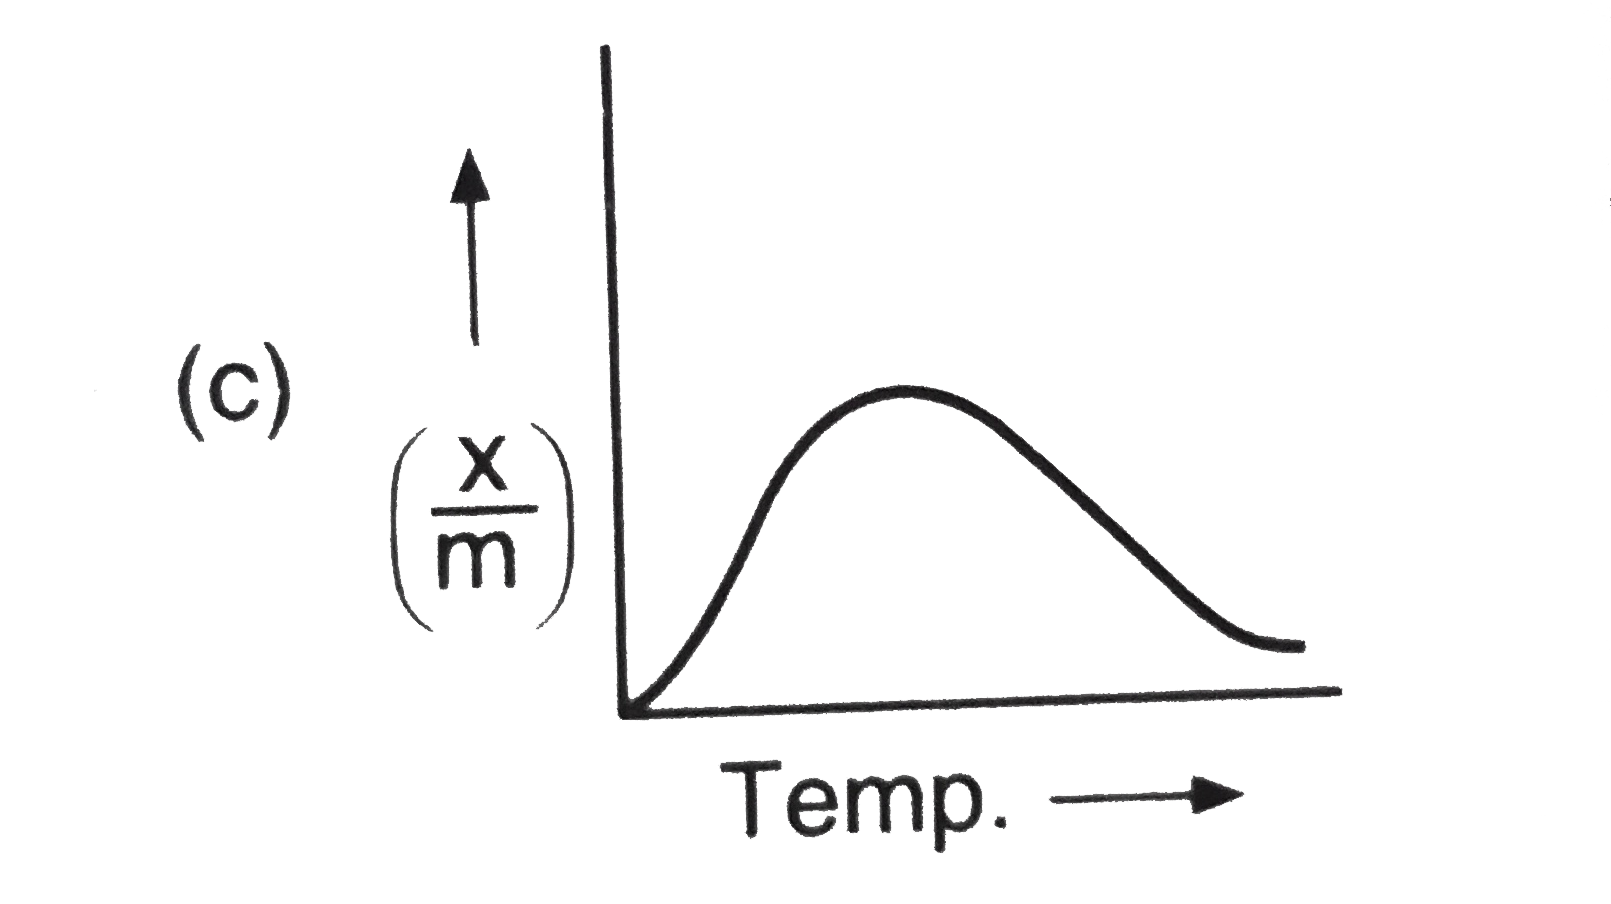 D
D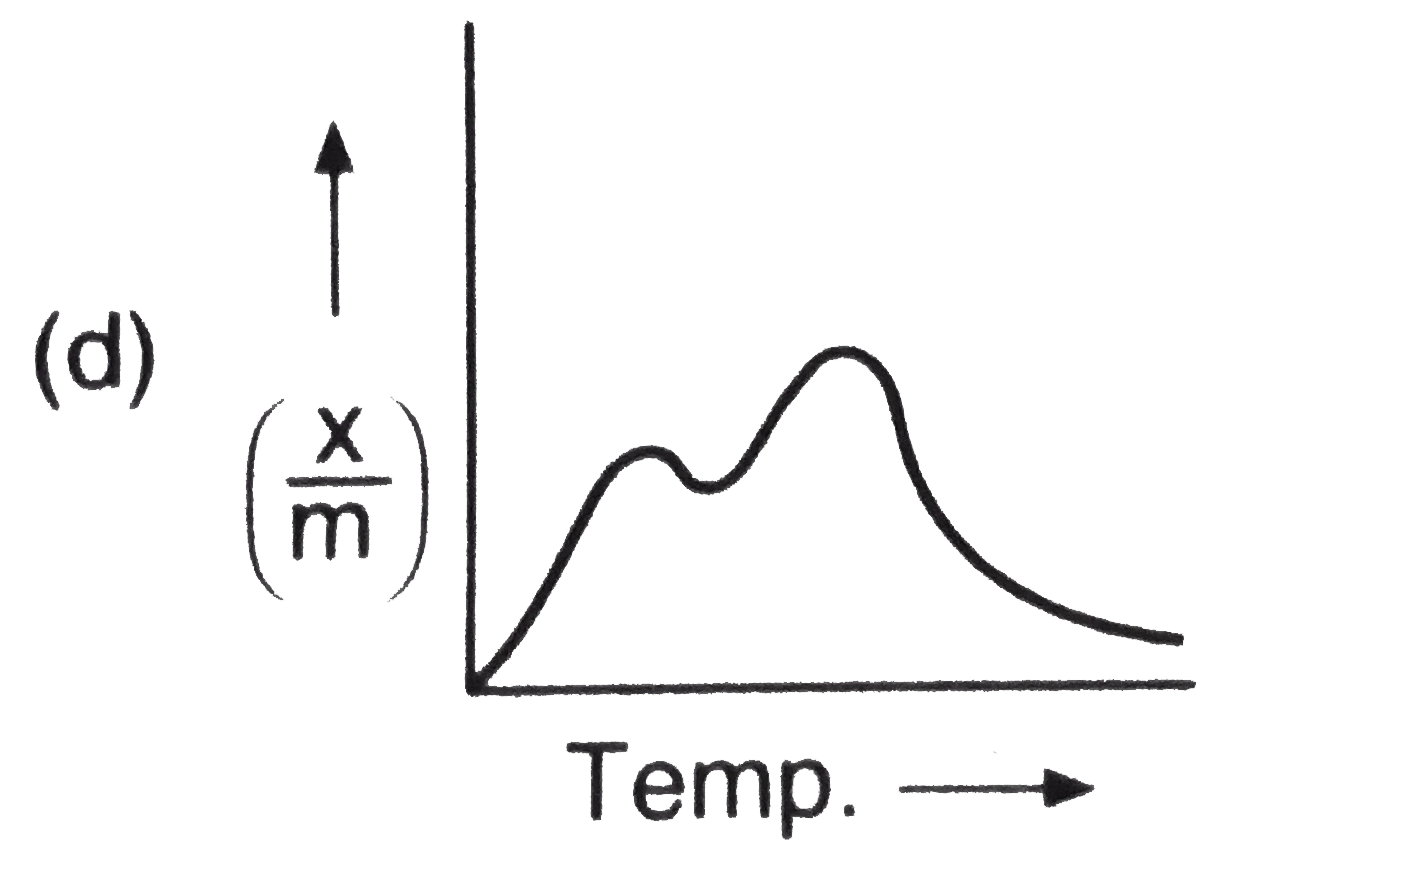
Which of the following graphs represent the behaviour of an ideal gas ?
View Solution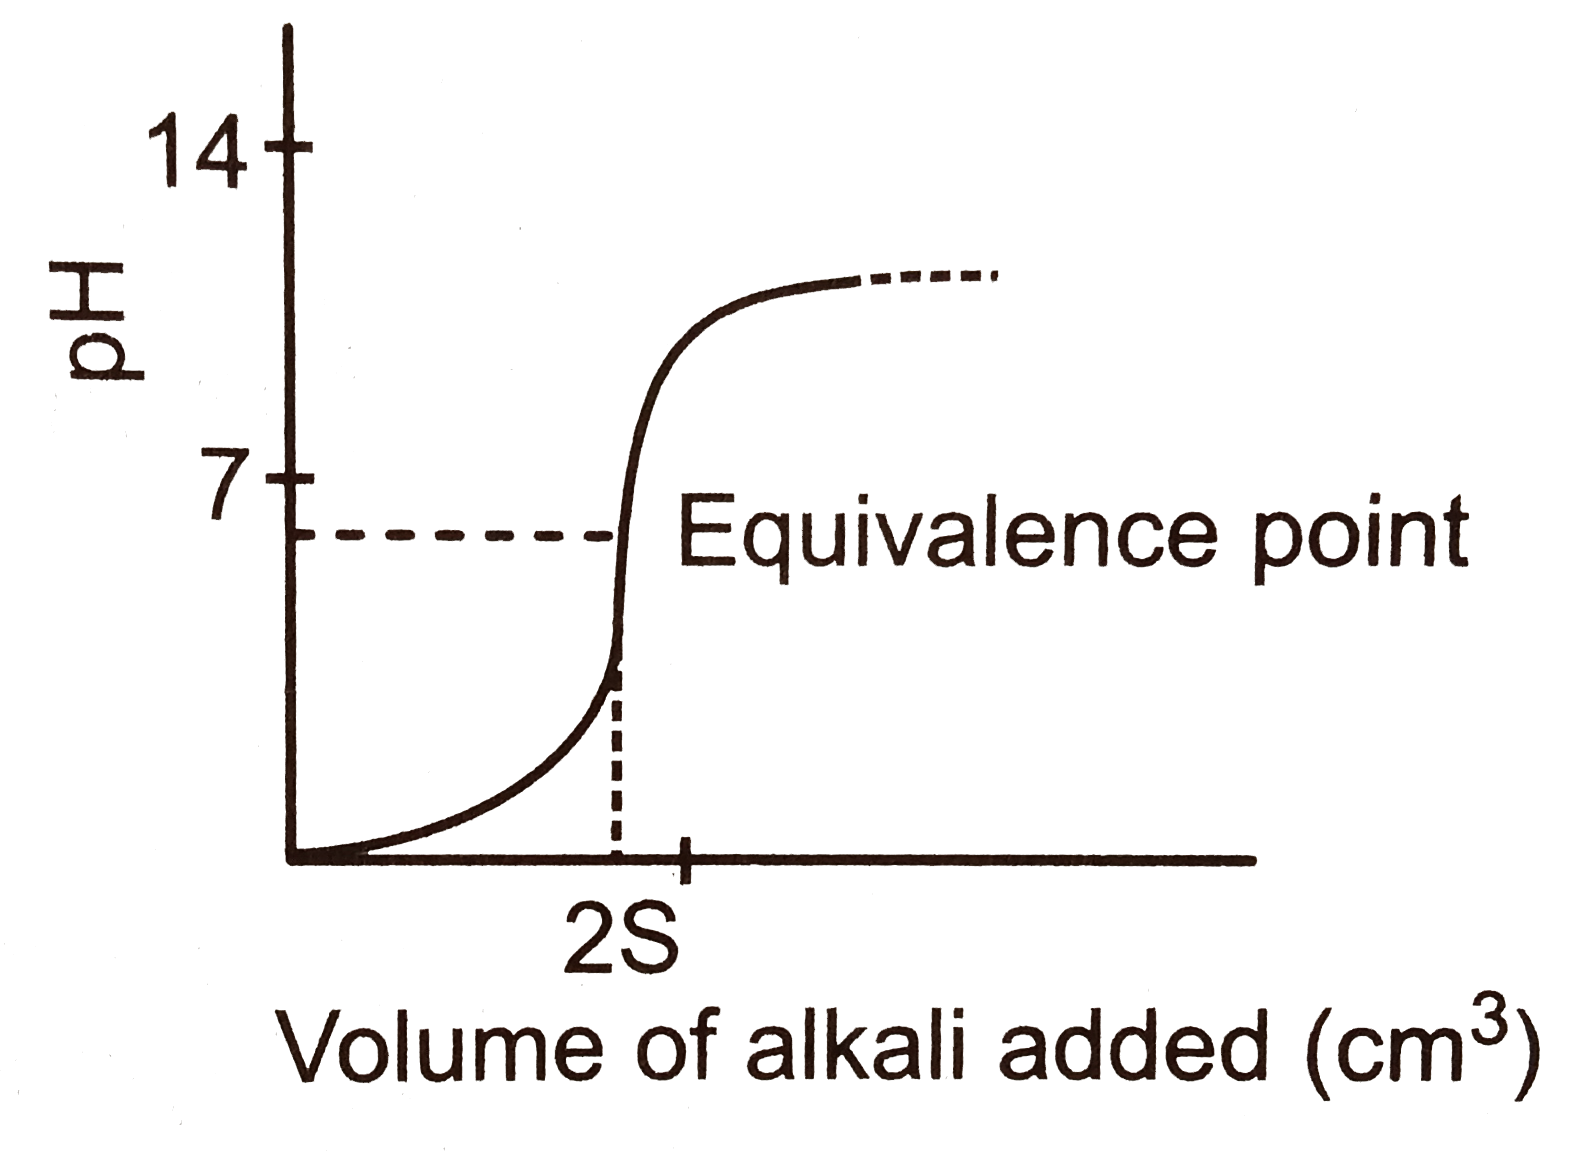
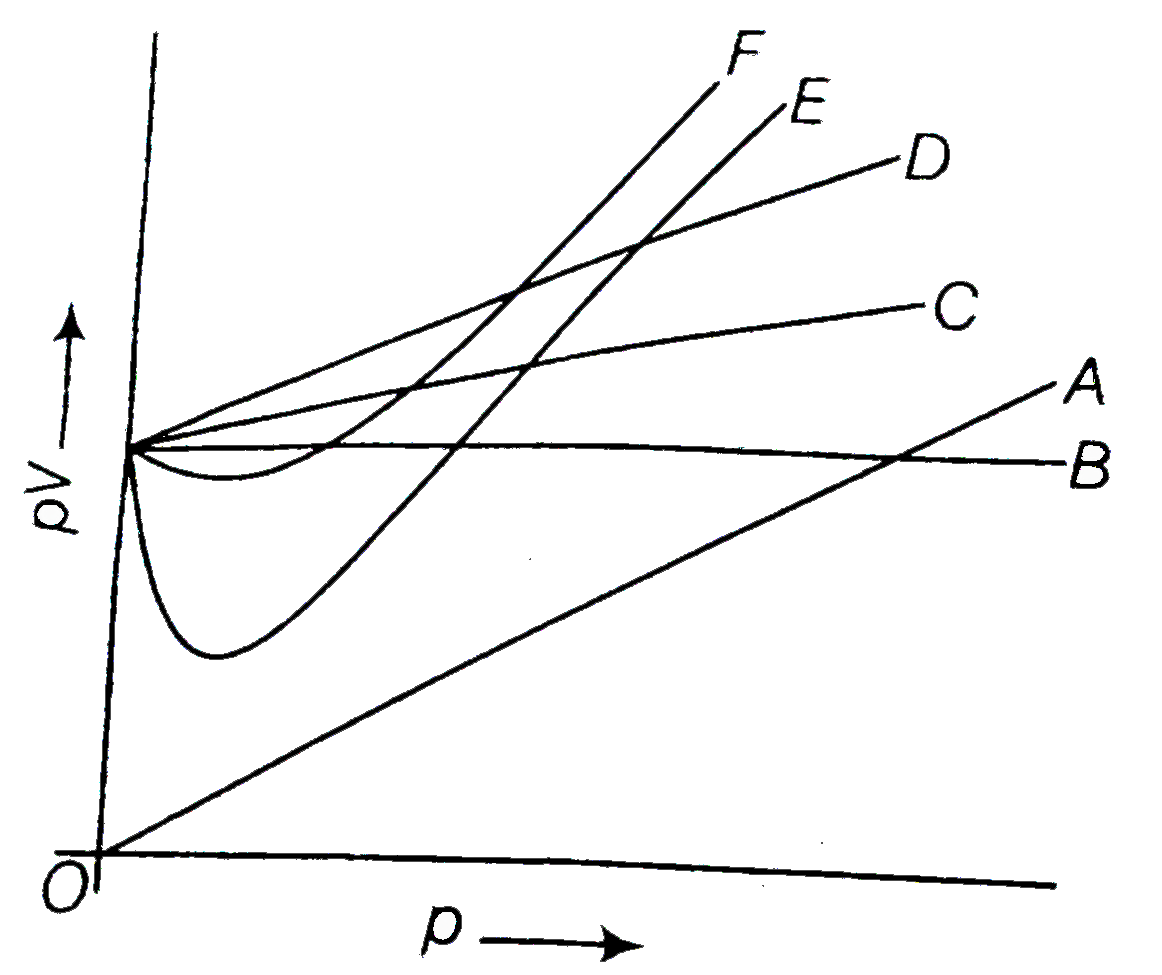
The graph represents the titration curve for :
View SolutionWhich curve does not represent Boyle’s law
View SolutionWhich of the following curves represents the Henry's law ?
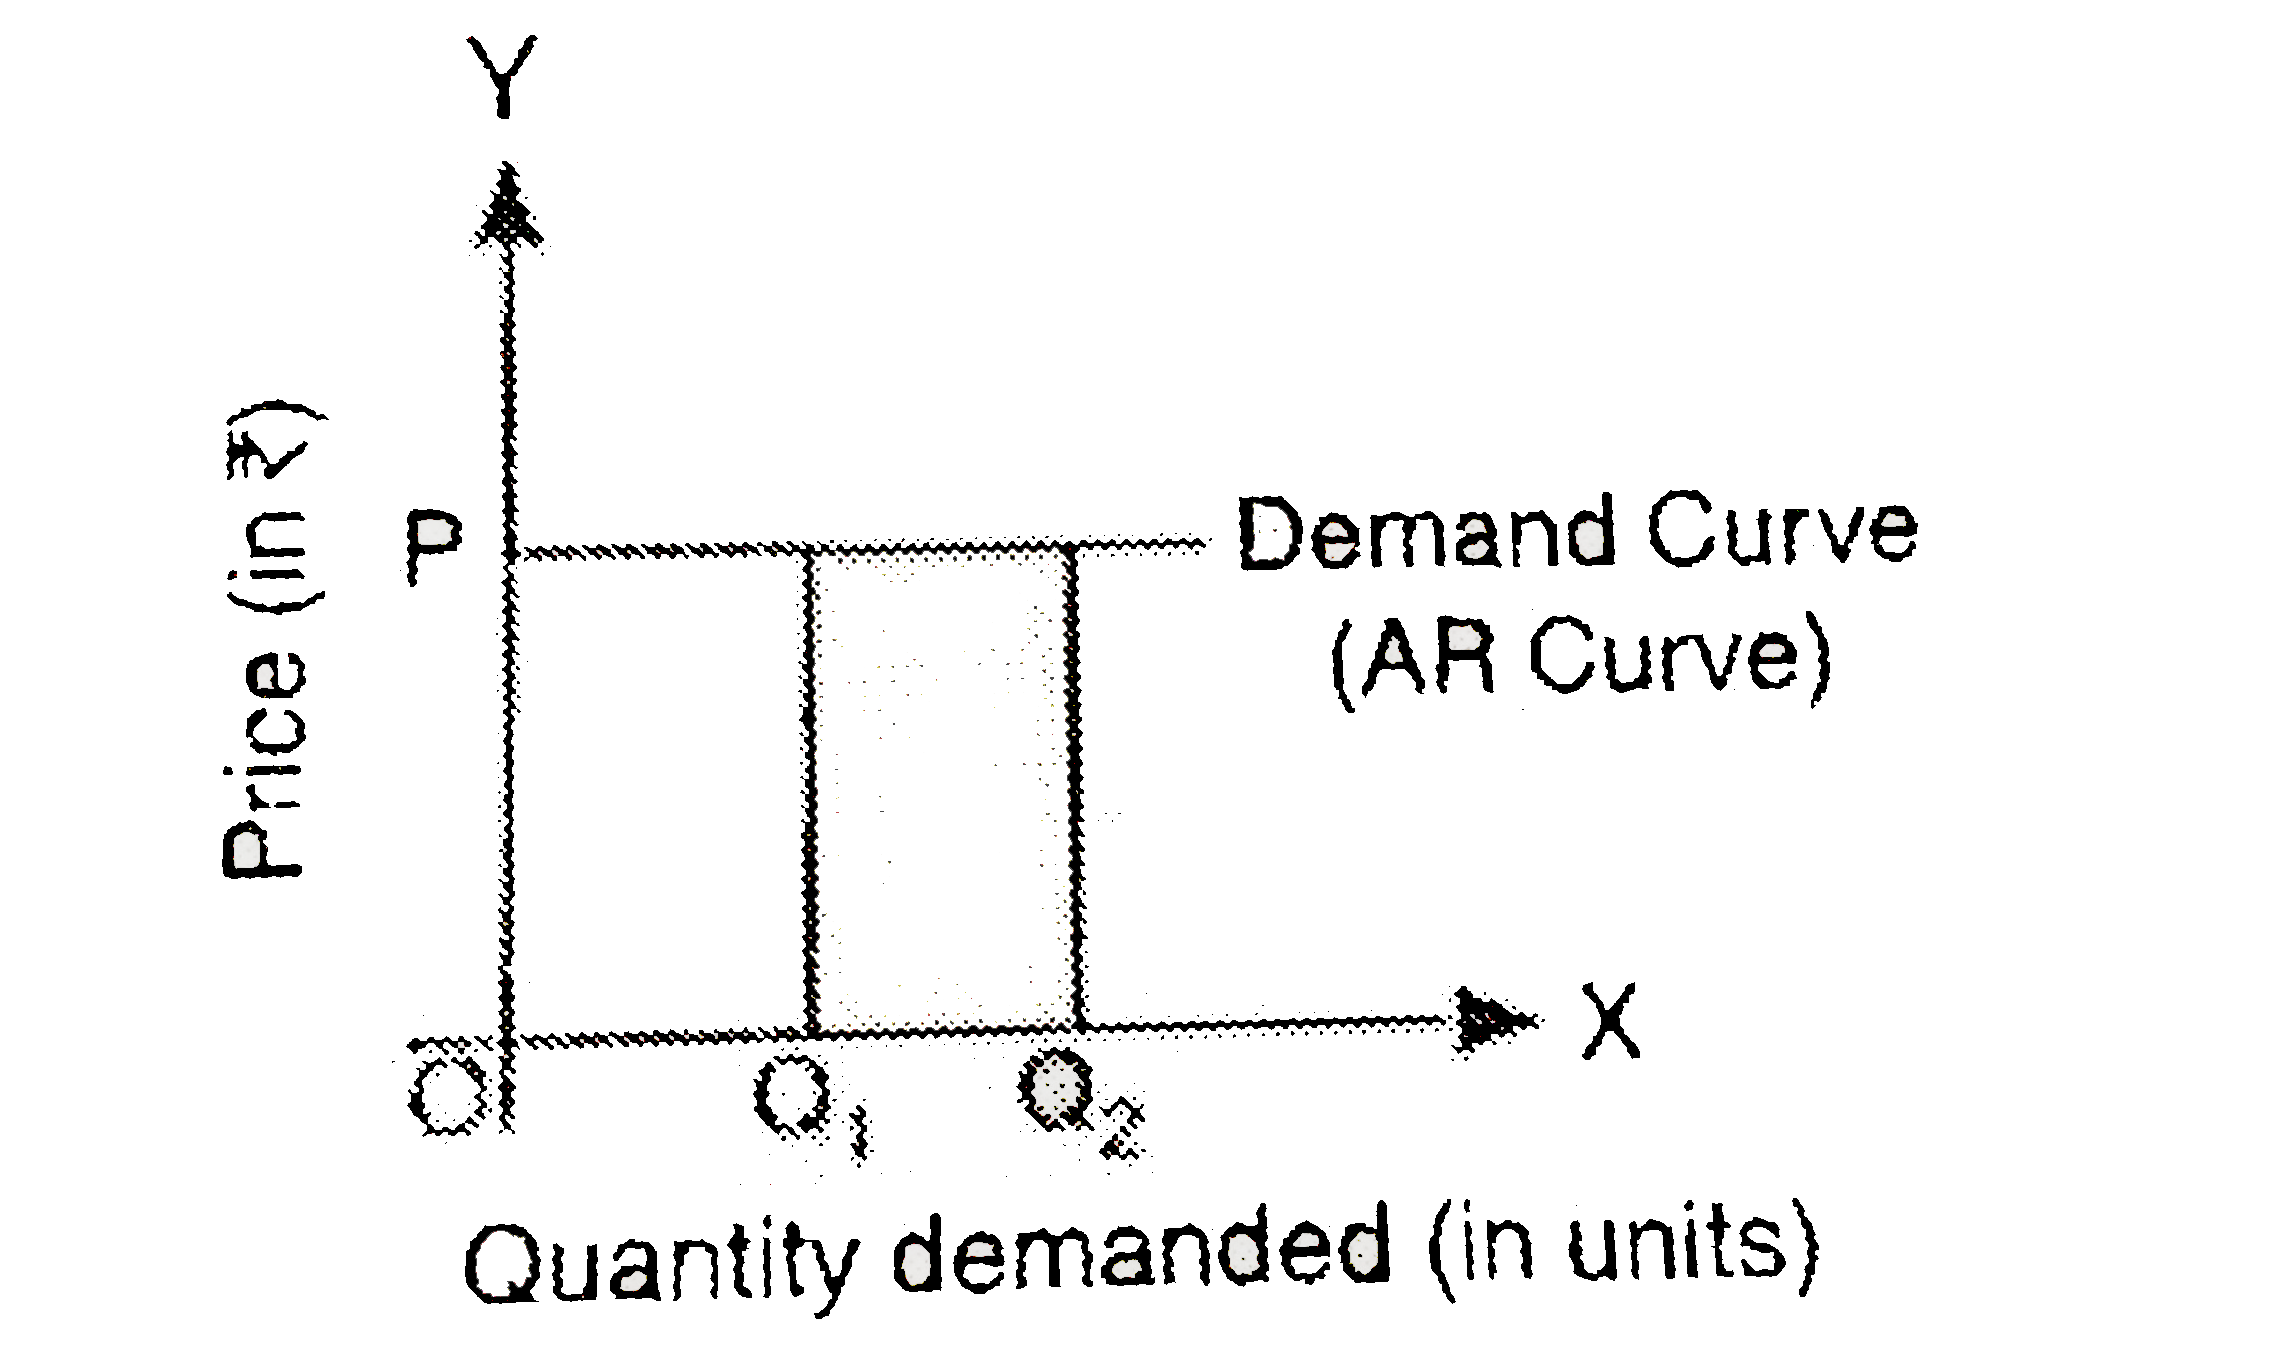
View SolutionThe following diagram represents the demand curve of:
View Solution

