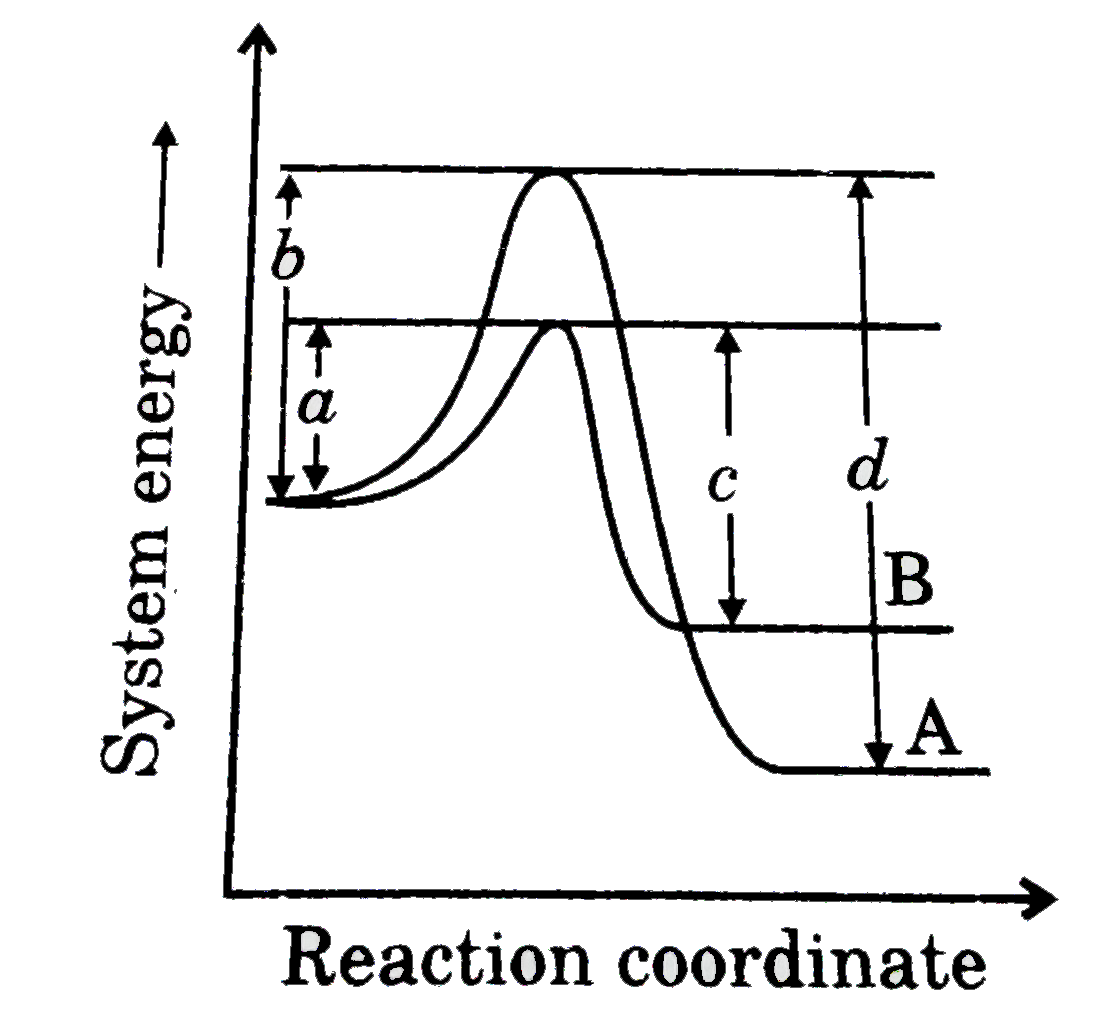
The variation of decay rate of two radioactive samples A and B with time is shown in fig.
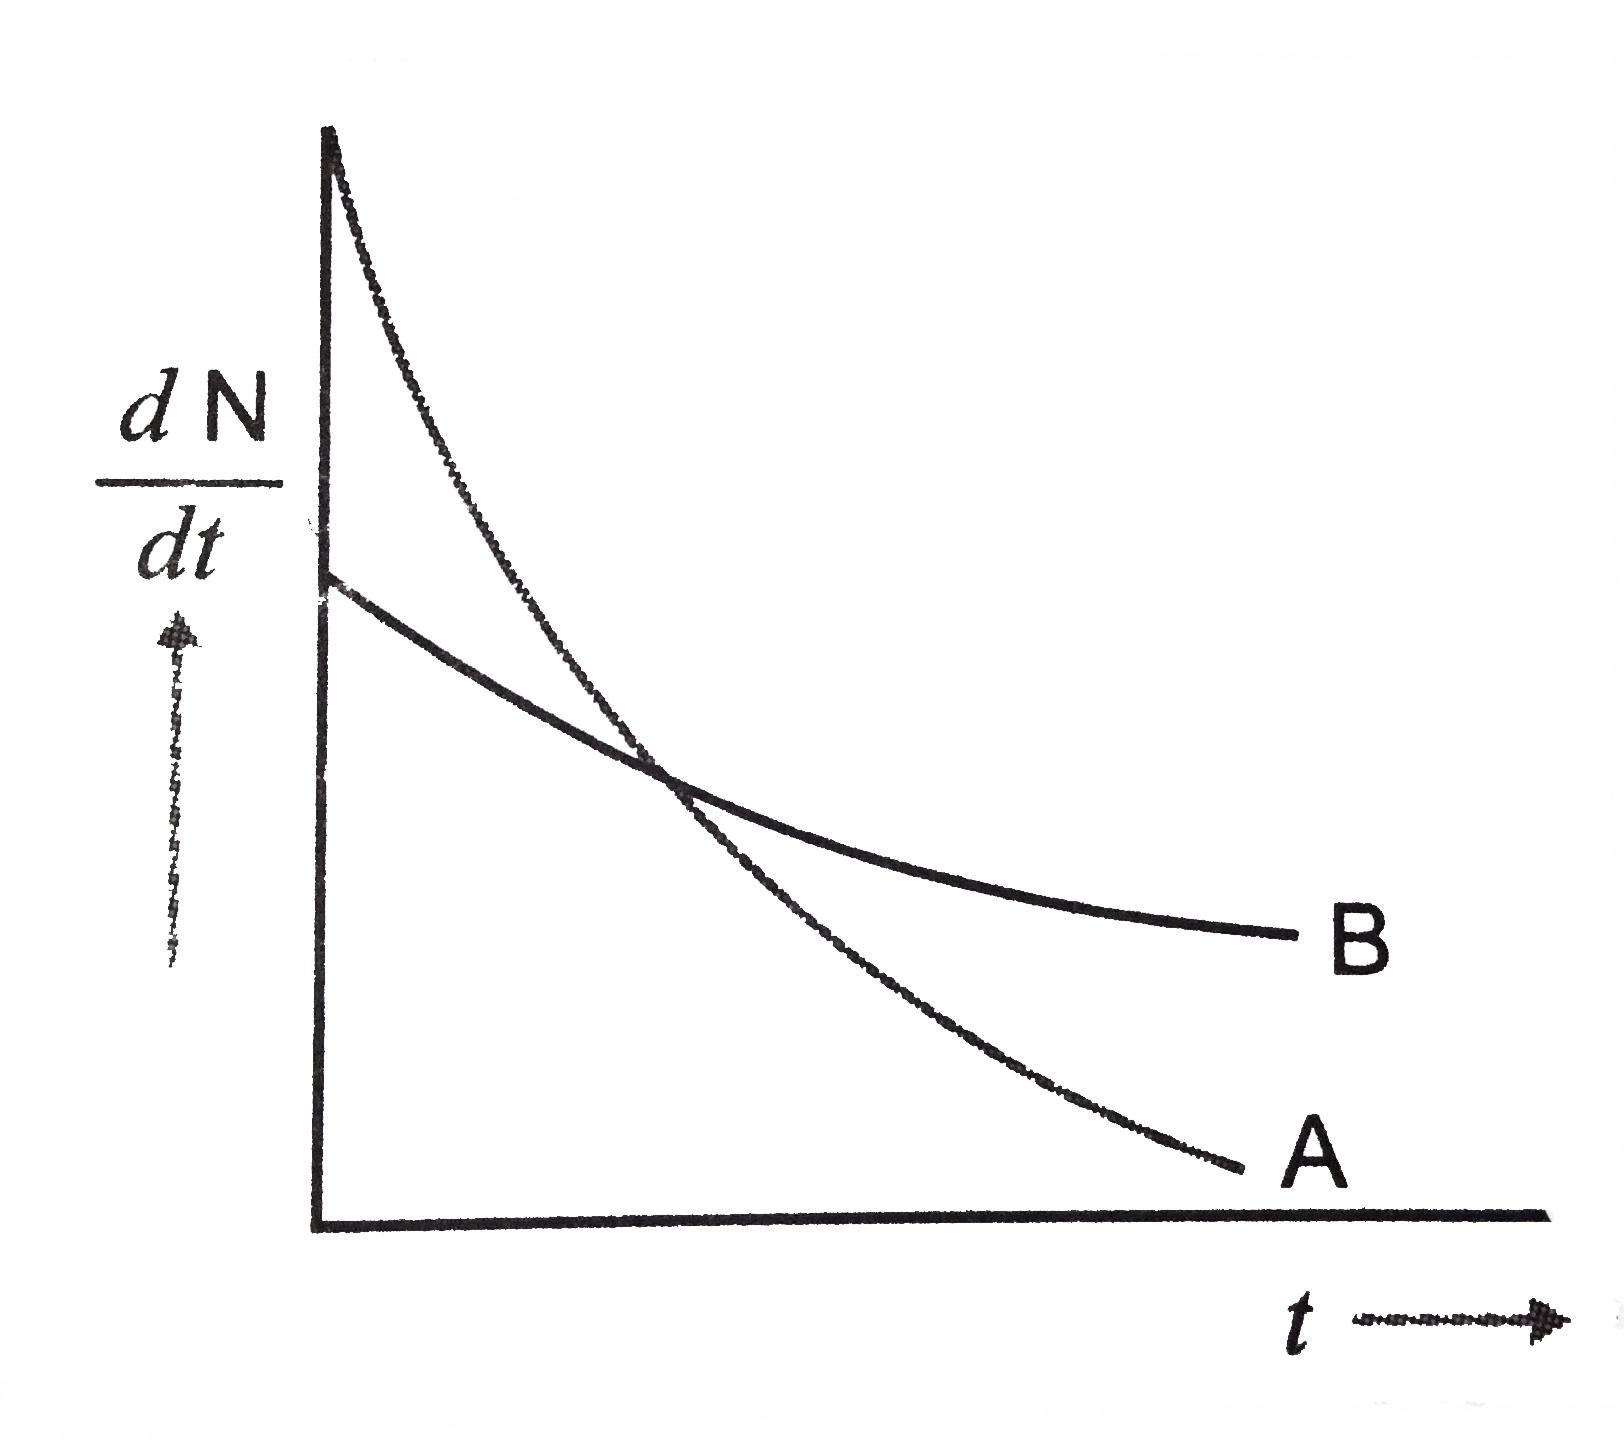
Which of the following statements are true?
Decay constant of A is greater than that of B, hence A always decays faster than B.
Decay constant of A is greater than that of B, but it does not always decays faster than B.
Decay constant of B is smaller than that of A but still its decay rate becomes equal to that of A at a later instant.
Both (b) and (c )
The correct Answer is:D
Step by step video & image solution for The variation of decay rate of two radioactive samples A and B with time is shown in fig. Which of the following statements are true? by Physics experts to help you in doubts & scoring excellent marks in Class 12 exams.
Updated on:21/07/2023Topper's Solved these Questions
- NUCLEIBook:NCERT FINGERTIPSChapter:NUCLEIExercise:Nuclear Energy
Explore 10 Videos
- NUCLEIBook:NCERT FINGERTIPSChapter:NUCLEIExercise:Higher Order Thinking Skills
Explore 8 Videos
- NUCLEIBook:NCERT FINGERTIPSChapter:NUCLEIExercise:Mass Energy And Nuclear Binding Energy
Explore 9 Videos
- MOVING CHARGES AND MAGNETISM Book:NCERT FINGERTIPSChapter:MOVING CHARGES AND MAGNETISM Exercise:Assertion And Reason
Explore 15 Videos
- PRACTICE PAPPERBook:NCERT FINGERTIPSChapter:PRACTICE PAPPERExercise:Practice Paper 3
Explore 50 Videos
Similar Questions
Knowledge Check
For the circuit shown in Fig. Which of the following statements are correct?
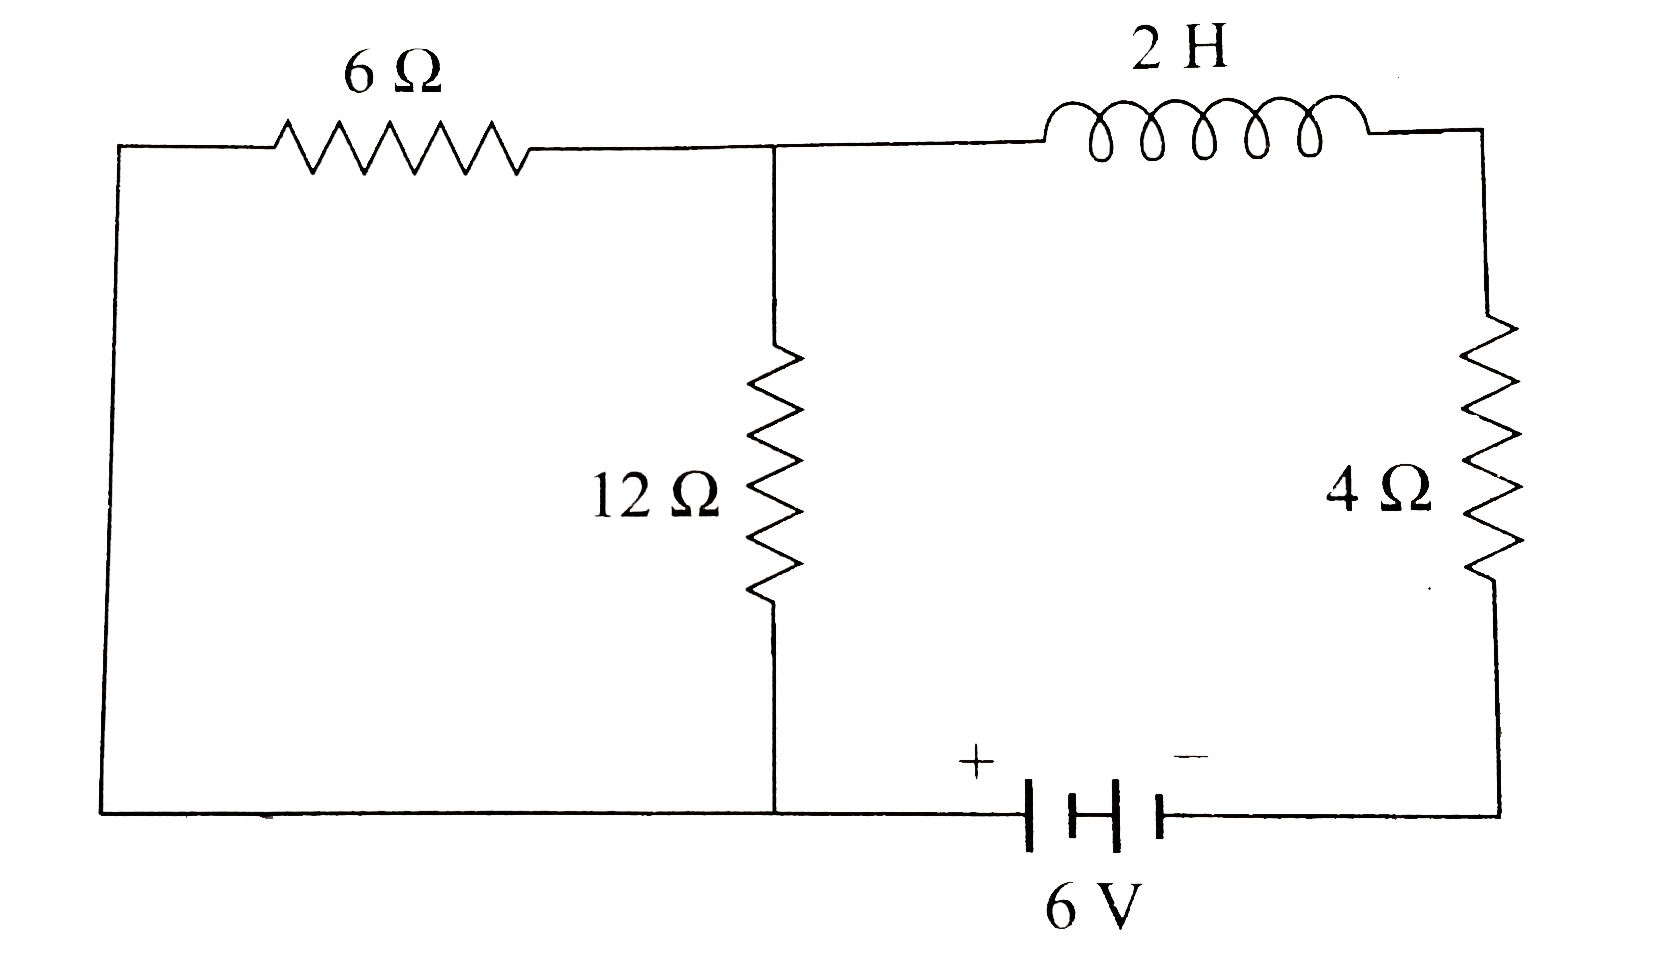 AIts time constant is 0.25 sBIn steady sate, current through inductance will be equal to zeroCIn steady state, current through the battery will be equal to 0.75 ADNone ot the above.
For the circuit shown, which of the following statements is true
 AS1 closed, V1=15V,V2=20VBWith S3, closed V,1=V2=25VCWith S1andS2, closed, V,1=V2=0DWith S1andS3closed, V1=30V:V2=20V
The rate of decay (R) of nuclei in a radioactive sample is plotted against time (t). Which of the following best represents the resulting curve ?
A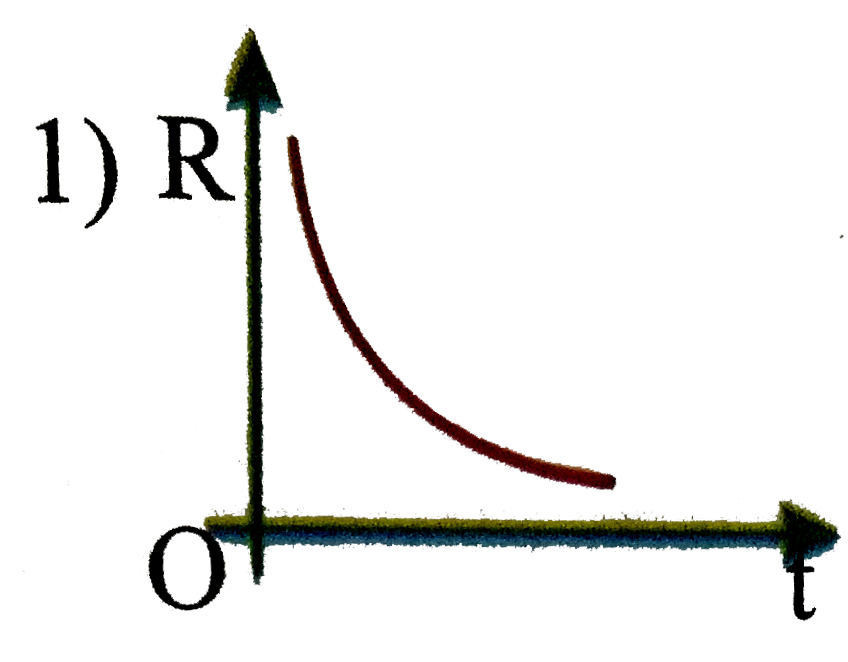 B
B C
C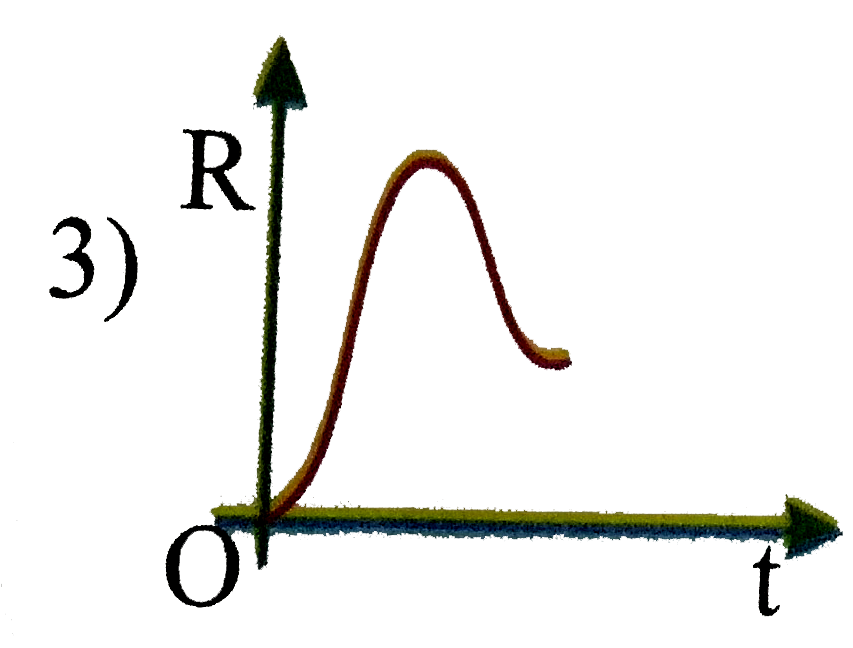 D
D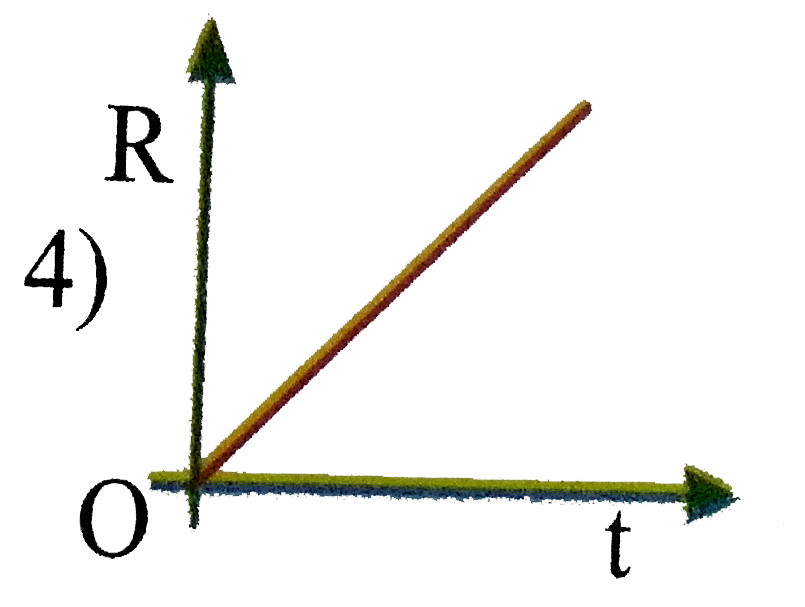
Which of the following statements about radioactivity is are true?
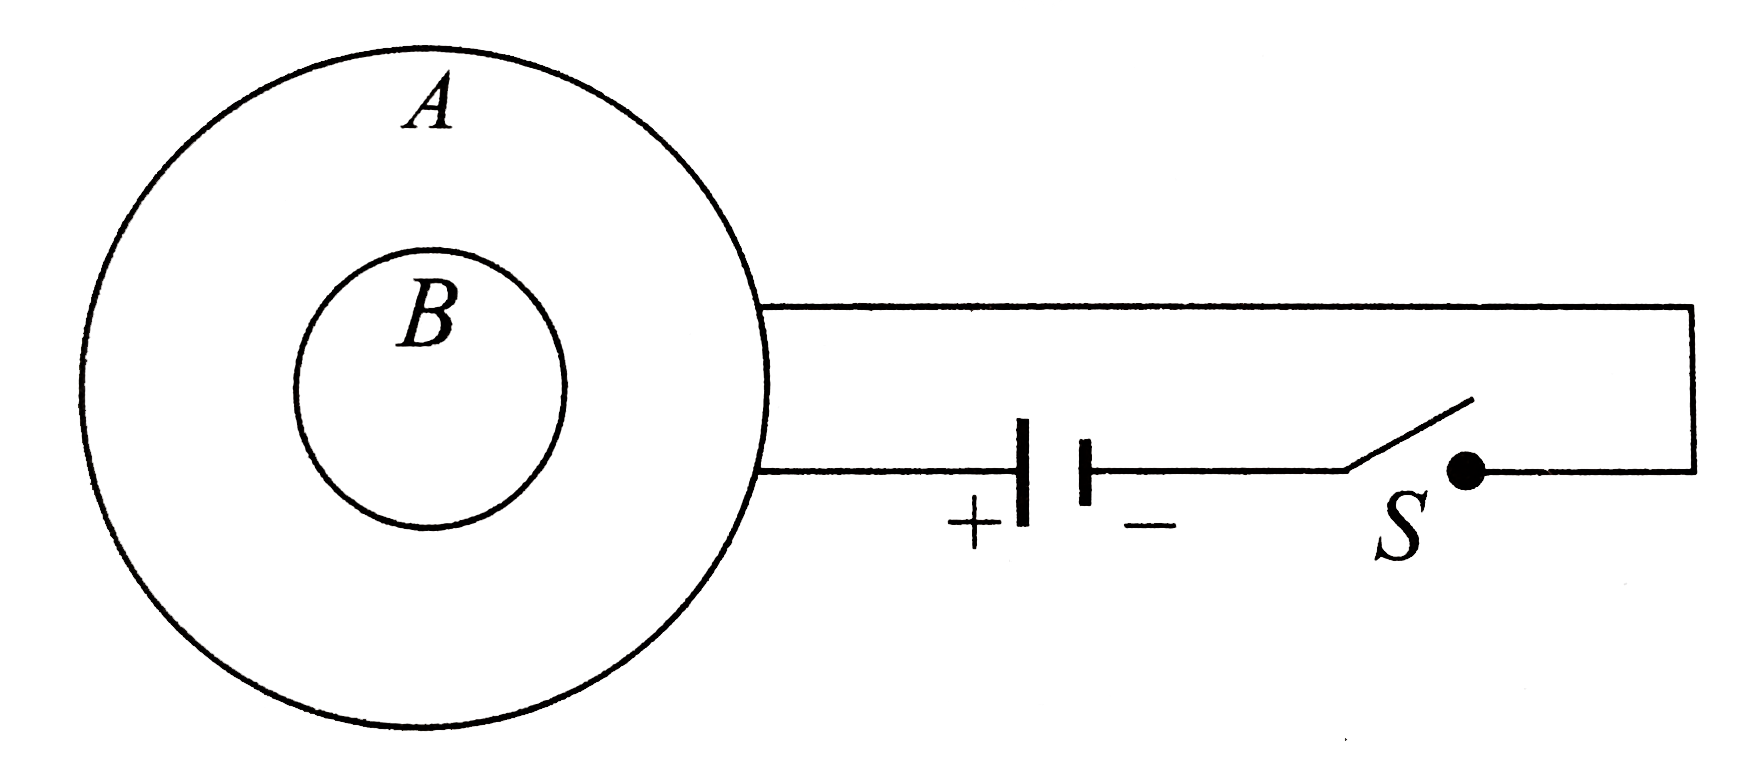
View SolutionThere are two coils A and B as shown in Fig.
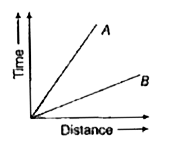
View SolutionThe distance-time graph for the motion of two vehicles A and B is given below. Which one of the following statements is true ?
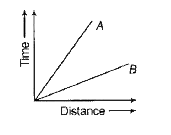
View SolutionThe distance - time graph for the motion of two vehicles . A and B is given below. Which one of the following statements is true ?
View SolutionConsider the decay of P to A and B by two parallel first order reactions as shown in Fig. Given Which of the following is (are) true ?
View Solution


