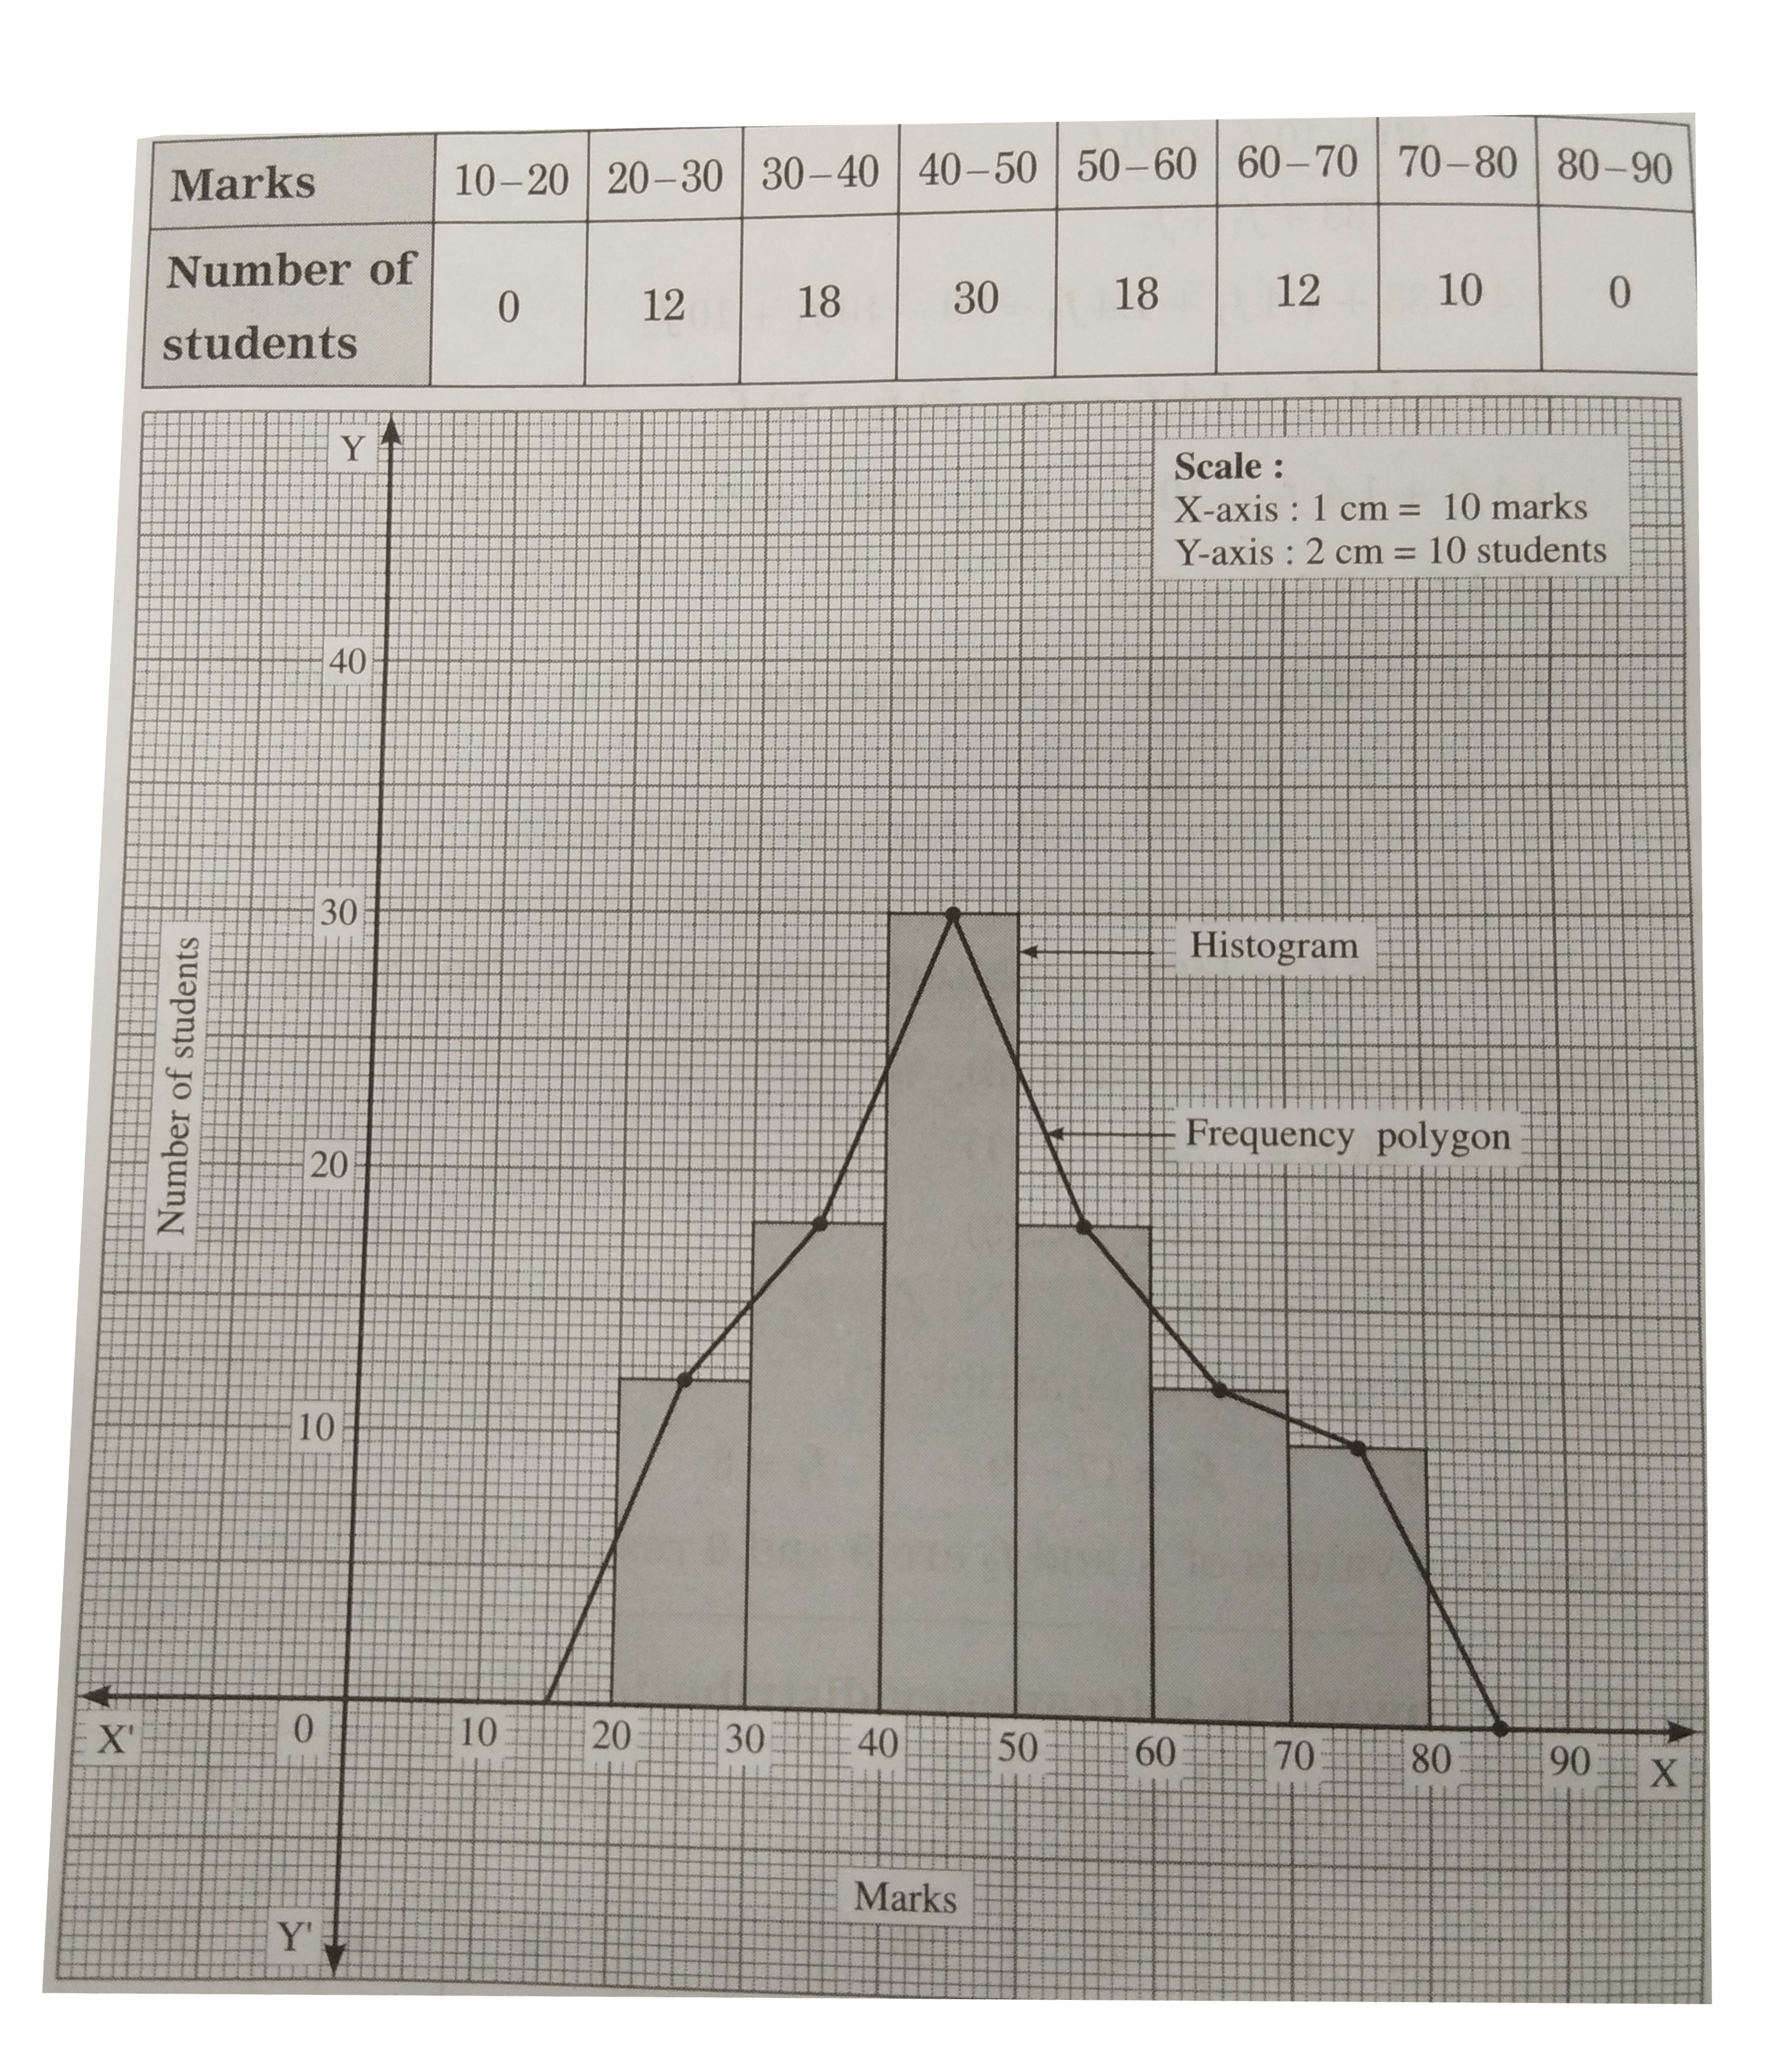
The following is a frequency distribution of marks:

If a and b are equal, find their values. Draw a histogram and a frequency polygon.
12+a+30+b+12+10=100
∴a+b+64=100
∴a+b=100−64=36
∴a=b=18
The value of a and b are 18 each.
Tabulation for histogram and frequency polygon:

Topper's Solved these Questions
- CHALLENGING QUESTIONS Book:NAVNEET PUBLICATION - MAHARASHTRA BOARDChapter:CHALLENGING QUESTIONS Exercise:EXAMPLE FOR PRACTICE
Explore 22 Videos
- BOARD'S QUESTION PAPER : MARCH 2019Book:NAVNEET PUBLICATION - MAHARASHTRA BOARDChapter:BOARD'S QUESTION PAPER : MARCH 2019Exercise:QUESTION
Explore 30 Videos
- CHALLENGING QUESTIONSBook:NAVNEET PUBLICATION - MAHARASHTRA BOARDChapter:CHALLENGING QUESTIONSExercise:SECTION 3 (MODEL QUESTION PAPER FOR PRACTICE ) Solve any one of the following subquestions :
Explore 1 Video
Similar Questions
Knowledge Check
In the following frequency distribution, find the median class.

What is the value of model marks ?A155.25B156.25C157.25D159.25
Depict the following frequency distribution by a histogram.

View SolutionFollowing table shows a frequency distribution for the speed of cars passing through at a particular spot on a high way.

Draw a histogram and frequency polygon representing the data above.
View SolutionRepresent the following frequency distribution by means of a histogram.

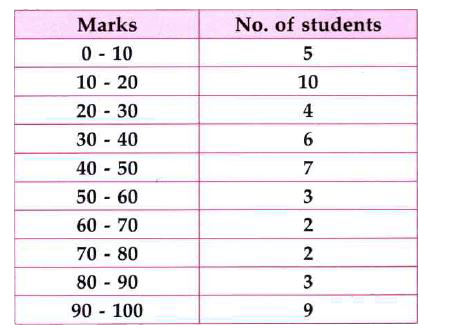
View SolutionThe frequency distribution of marks obtained by students in a class test is given below .
Draw frequency polygon and ogive.

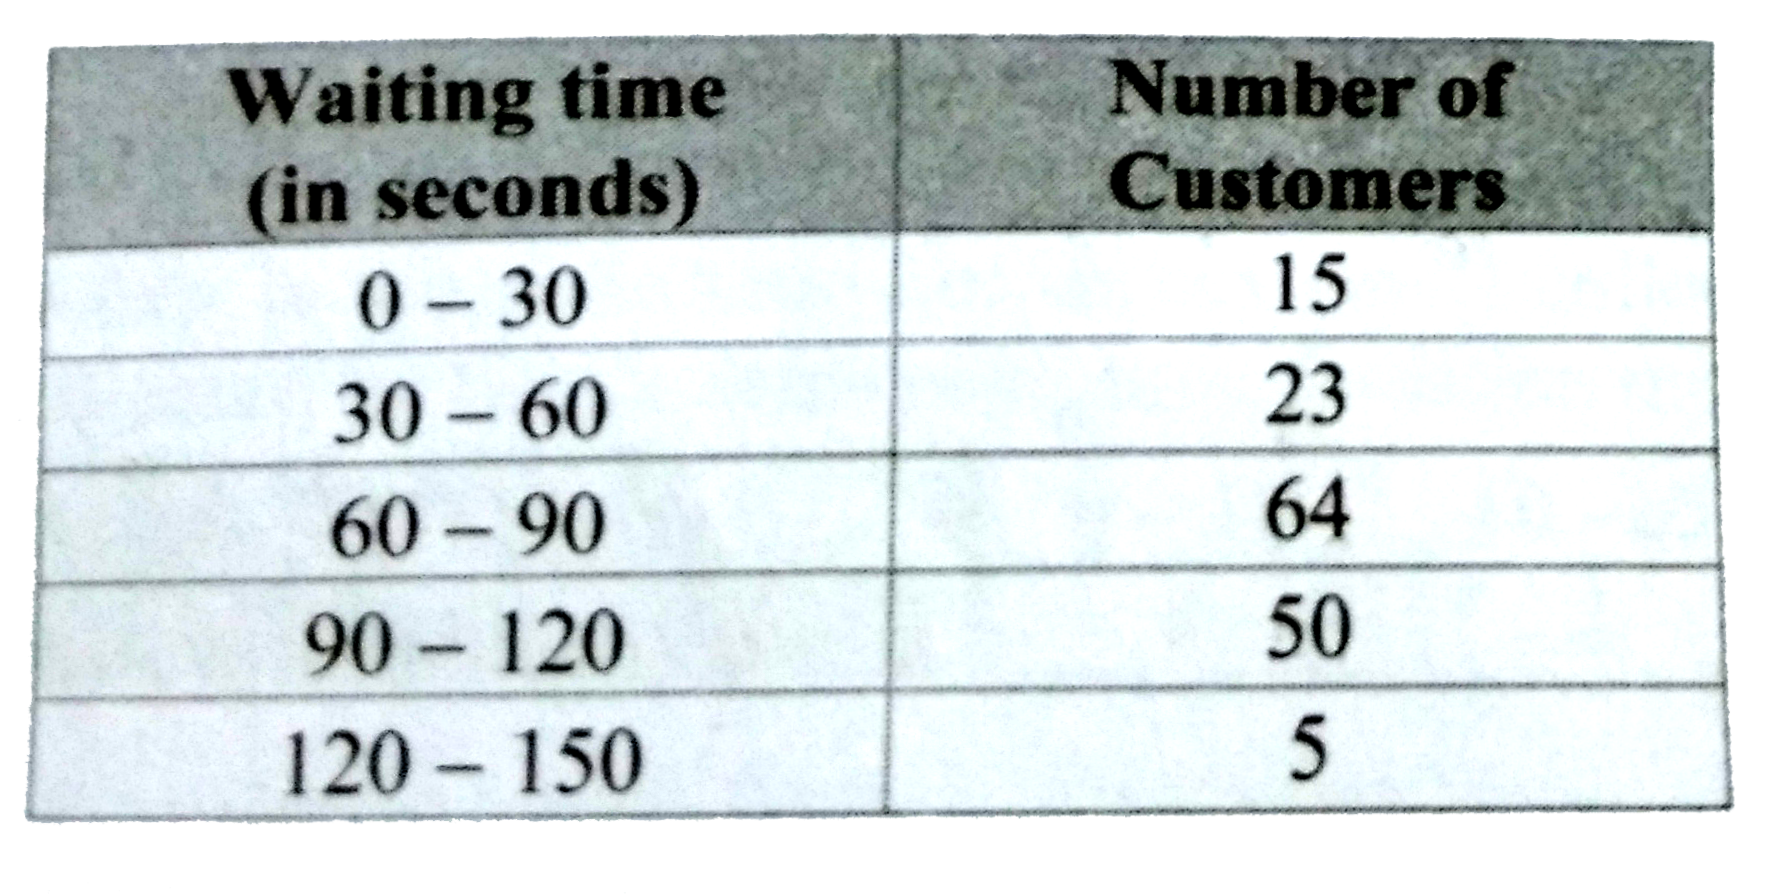
View SolutionThe following is the frequency distribution of waiting time at ATM centre, draw histogram to represent the data:

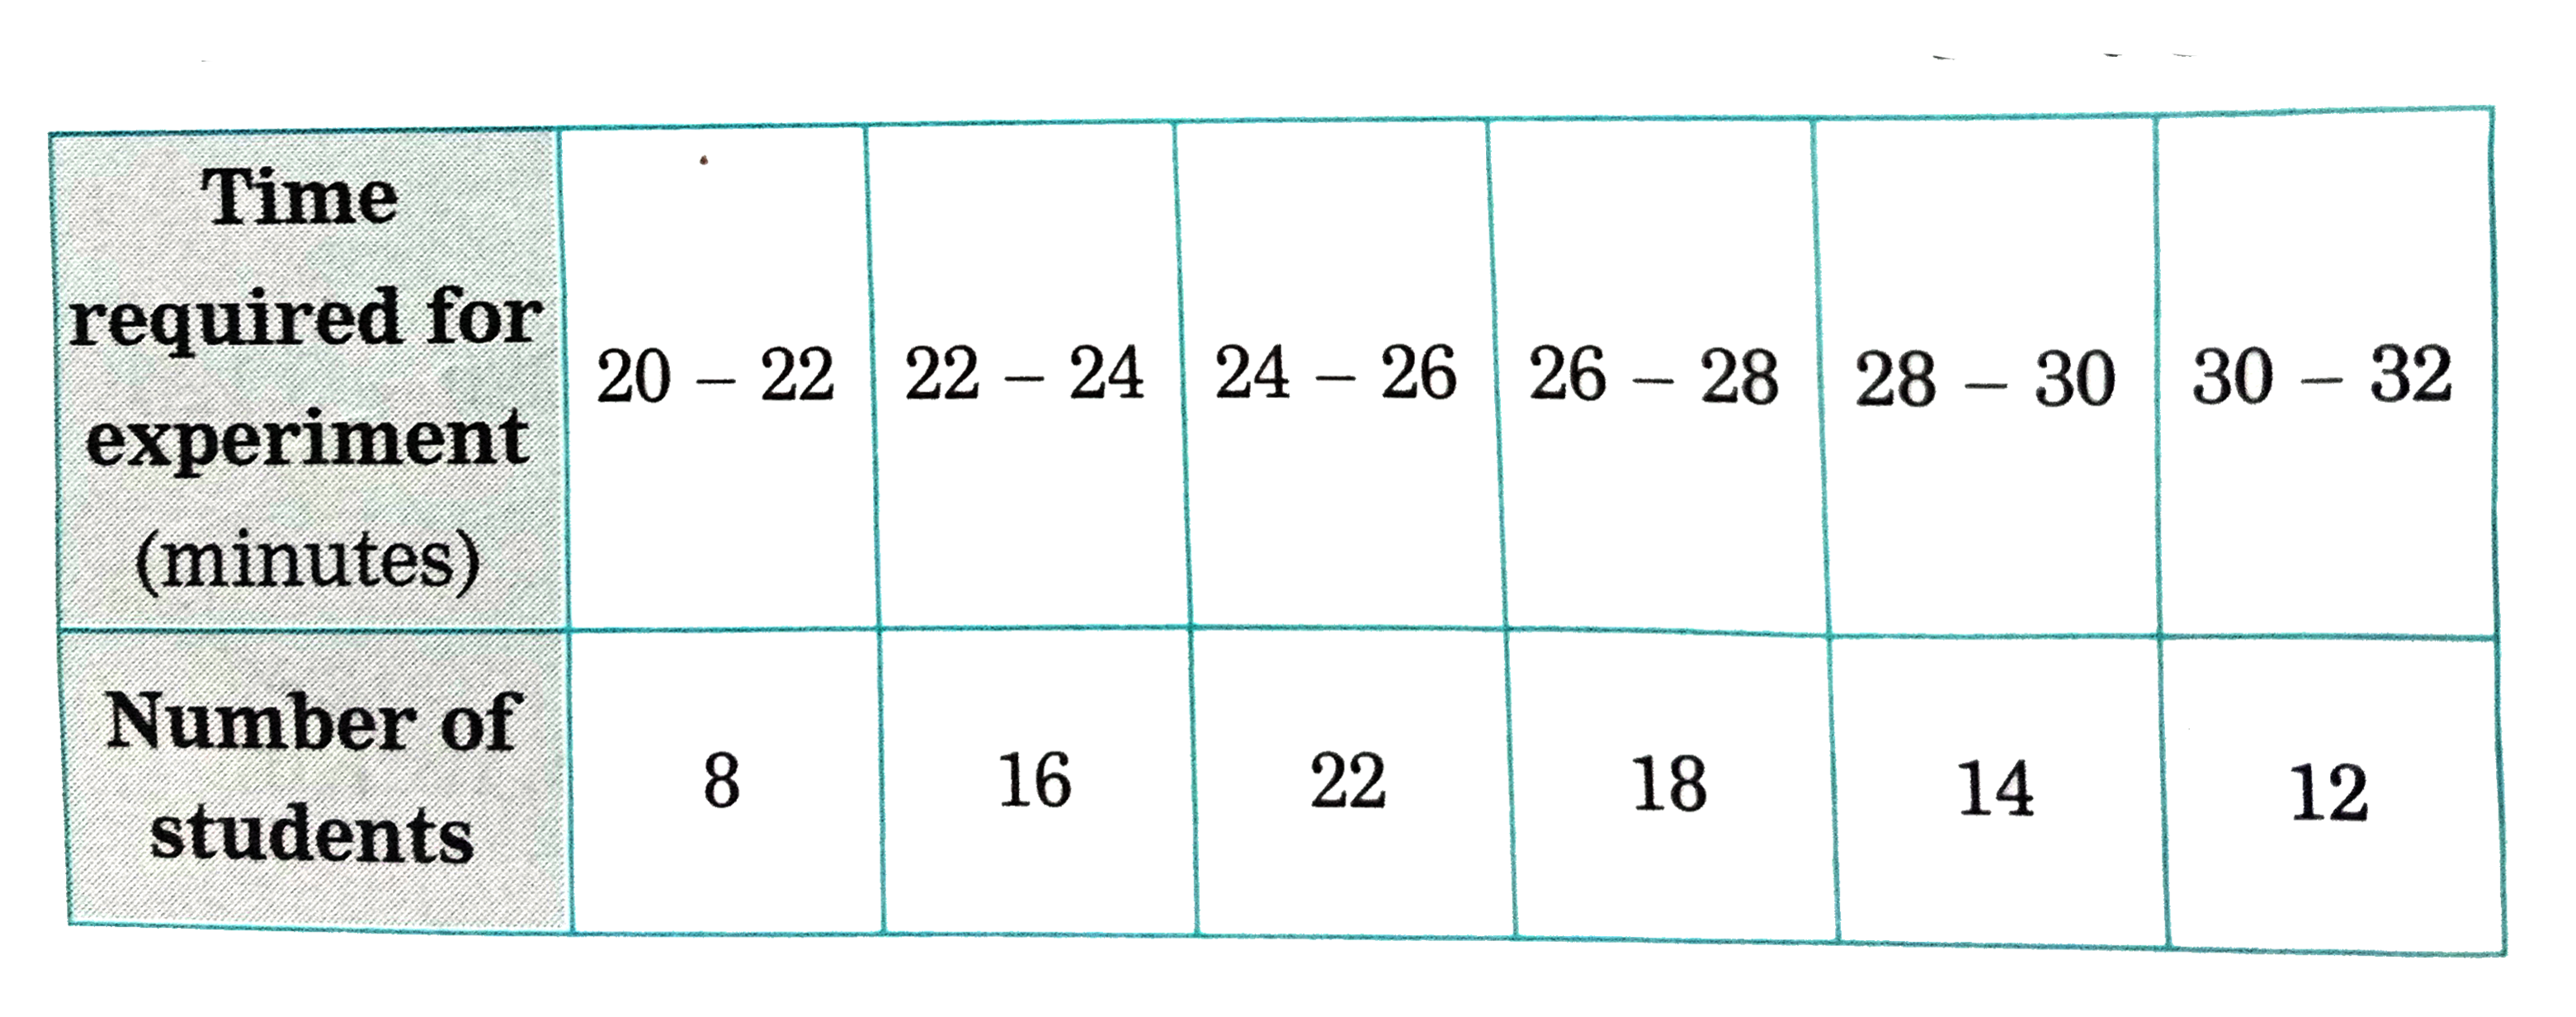
View SolutionThe time required for students to do a science experiment and the number of students is shown in the following grouped frequency distribution table. Show information by a histogram and also by a frequency polygon.

View SolutionWhat do you mean by frequency distribution polygon?
View Solution


