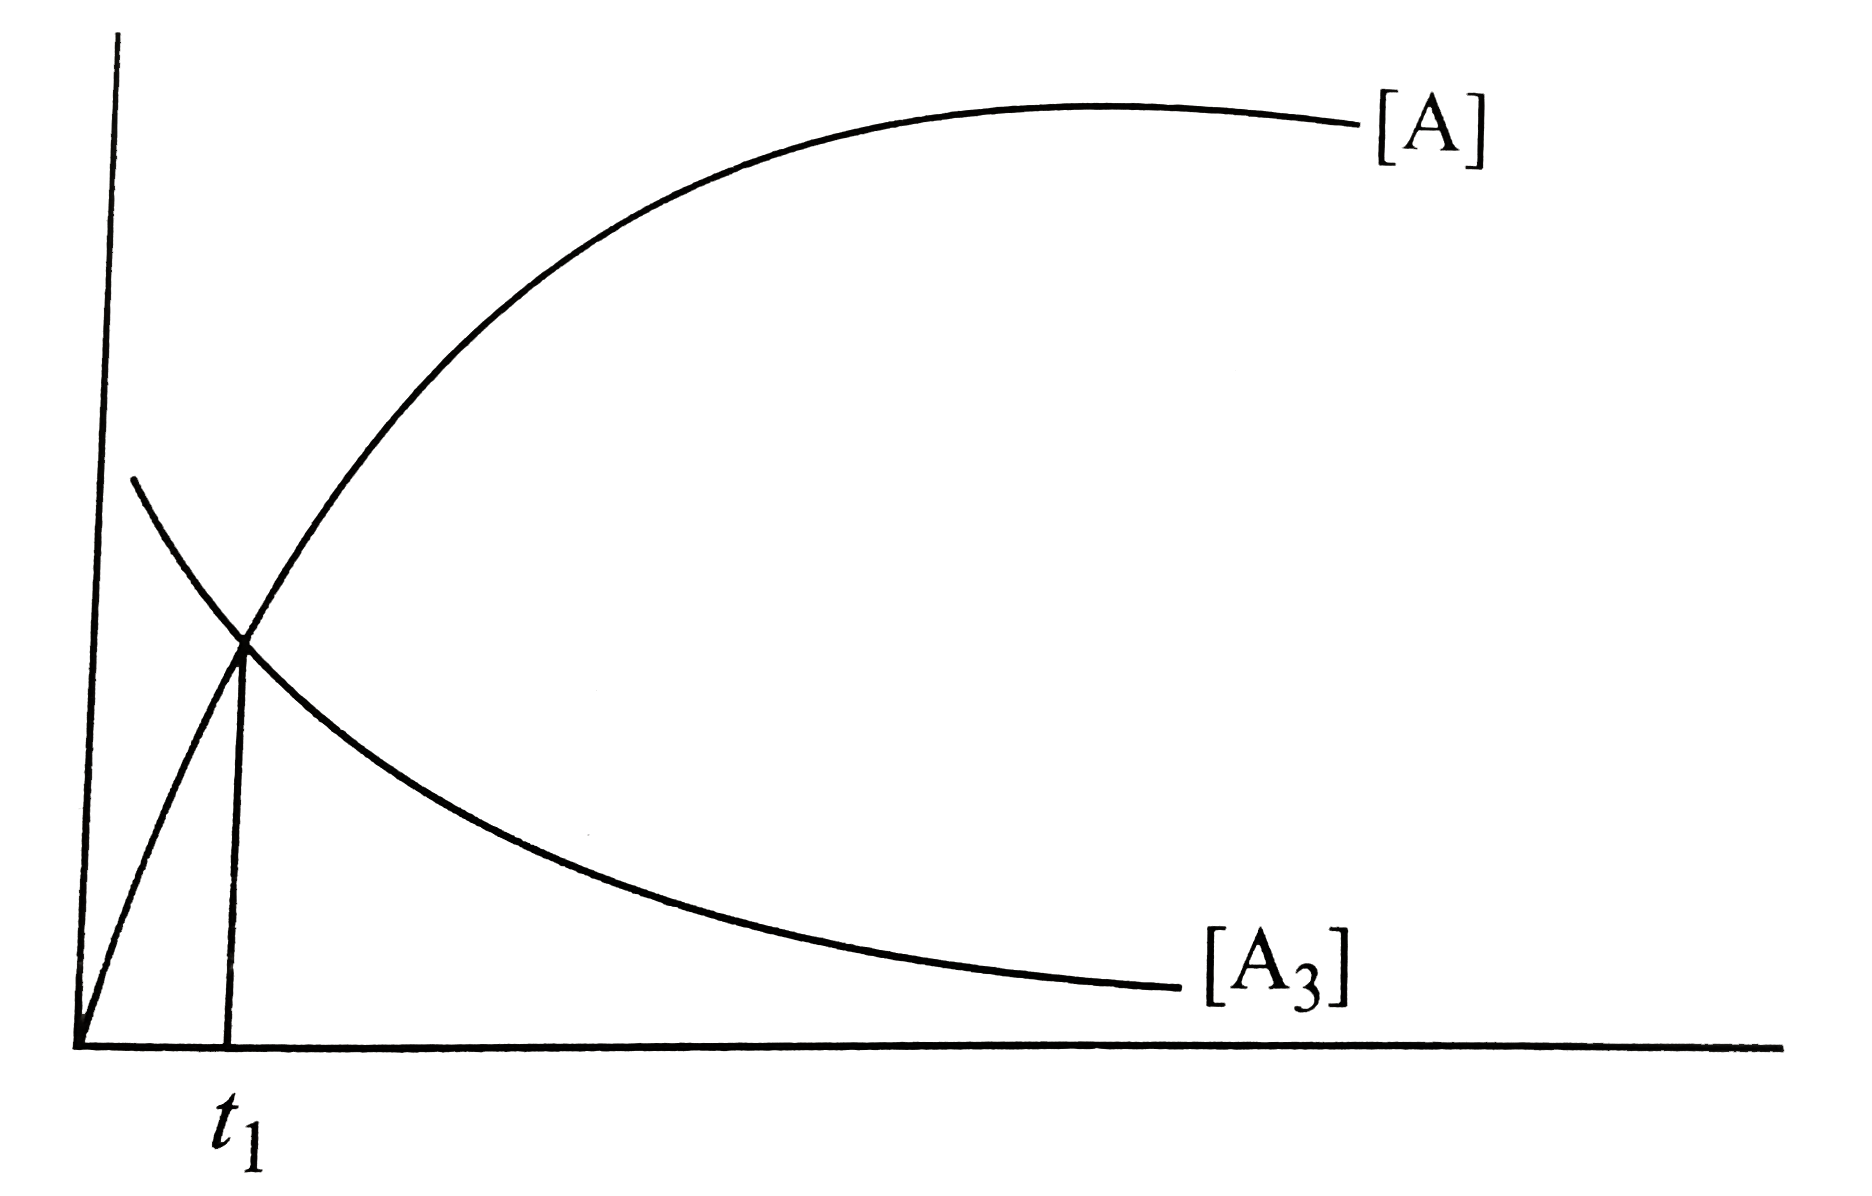
Using the given graph showing concentration of reactants and Products as a function of times for the reaction:
A3→3A
The time t1 corresponds to

t1/2
t1/3
t1/4
t1/5
The correct Answer is:C
Topper's Solved these Questions
- CHEMICAL KINETICSBook:CENGAGE CHEMISTRYChapter:CHEMICAL KINETICSExercise:Solved Example
Explore 52 Videos
- CHEMICAL KINETICSBook:CENGAGE CHEMISTRYChapter:CHEMICAL KINETICSExercise:Ex 4.1 (Objective)
Explore 9 Videos
- CARBOXYLIC ACIDS AND THEIR DERIVATIVESBook:CENGAGE CHEMISTRYChapter:CARBOXYLIC ACIDS AND THEIR DERIVATIVESExercise:Exercises Archives (Analytical And Descriptive)
Explore 34 Videos
- COORDINATION COMPOUNDSBook:CENGAGE CHEMISTRYChapter:COORDINATION COMPOUNDSExercise:Archives Subjective
Explore 18 Videos
Similar Questions
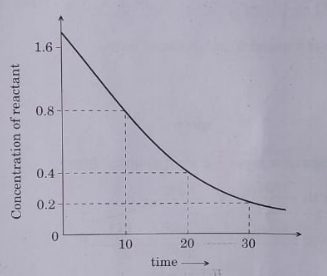
Analyse the given graph,drawn between concentration of reactant vs. time.
(a)Predict the order of reaction.
(b)Theoretically, can the concentration of the reactant reduce to zero after infinite time?Explain.
View Solutionwhen concentration of reactant in reaction A→B is increased by 4 times , the rate increase only 2 times The order of the reaction would be
View Solution
Knowledge Check
A : At equilibrium concentration of the reactant and product does not change with time for a chemical reaction.
R : The rate of reaction is zero at equilibriumAIf both Assertion & Reason are true and the reason in the corret explanation of the assertion, then markBIf both assertion & Reason are true but the reason is not the correct explanation of the assertion, then markCIf Assertion is true statement but Reason is false then markDIf both Assertion and Reason are false statements , then markThe rate of reaction doubles when the concentration of the reactant is increased four times , The order is
A12B2C1D4Assertion : concentration of the reactant and product does not change with time at equilibrium for a a chemical reaction.
Reason : The rate of a reaction is zero at equilibrium .Aif both assertion and reason are correct and reason is correct explanation for assertion.Bif both assertion and reason are correct but reason is not correct explanation for assertion.Cif assertion is correct but reason is incorrect.Dif assertion and reason boht are incorrect.
When the concentration of a reactant , A in a reaction A→ Products , is doubled the rate of the reaction increases seven times , the order of the reaction is between
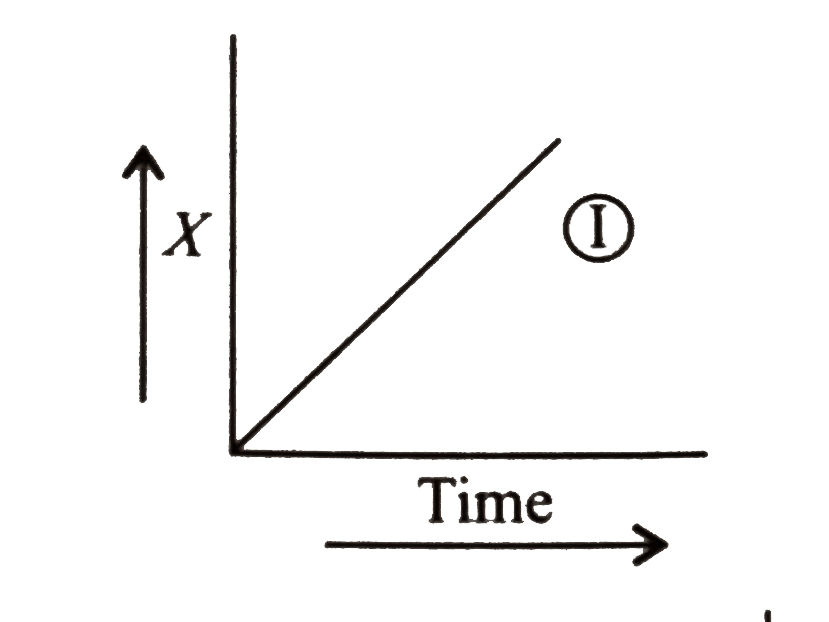
View SolutionThe graph between concentration (X) of the Product and time of the reaction A→B is of the type 1. Hence, graph between −d[A]dt and time will be of the type:

View SolutionStatement: Concentration of the reactant and product does not change with time at equilibrium for a chemical reaction.
Explanation: The rate of a reaction is zero at equilibrium.
View SolutionIn a reaction, when the concentration of reactant is increased two times, the increase in rate of reaction was four times. Order of reaction is :
View SolutionIn a reaction, when the concentration of reactant is increased two times, the increase in rate of reaction was four times. Order of reaction is :
View Solution


