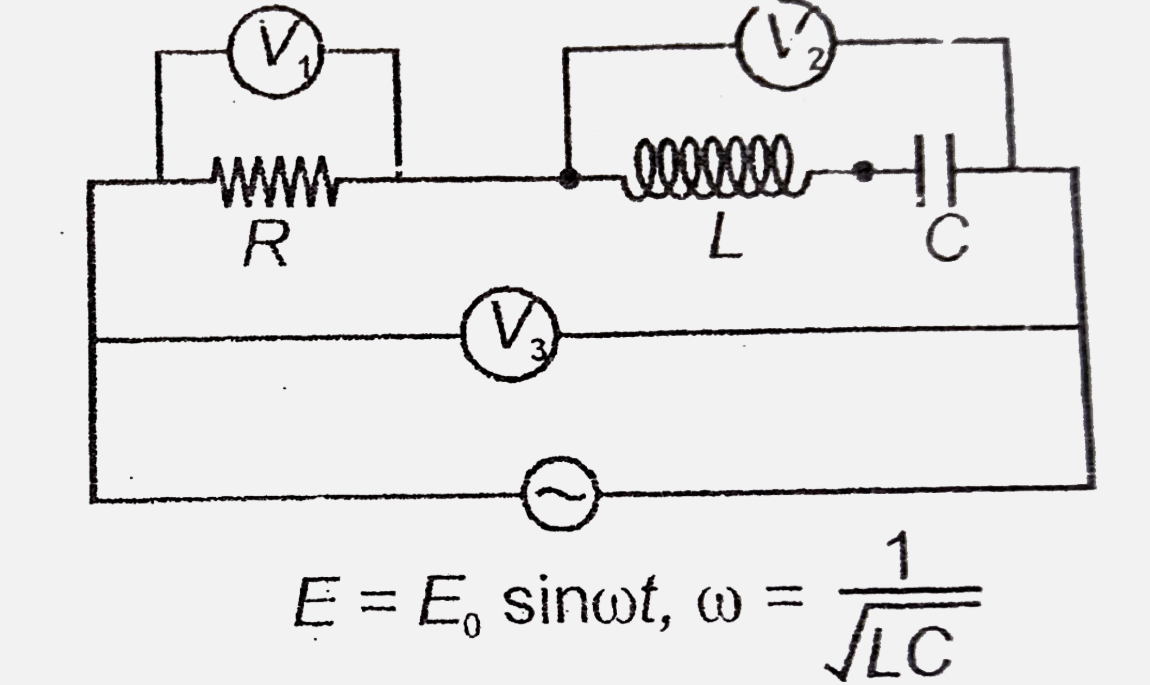
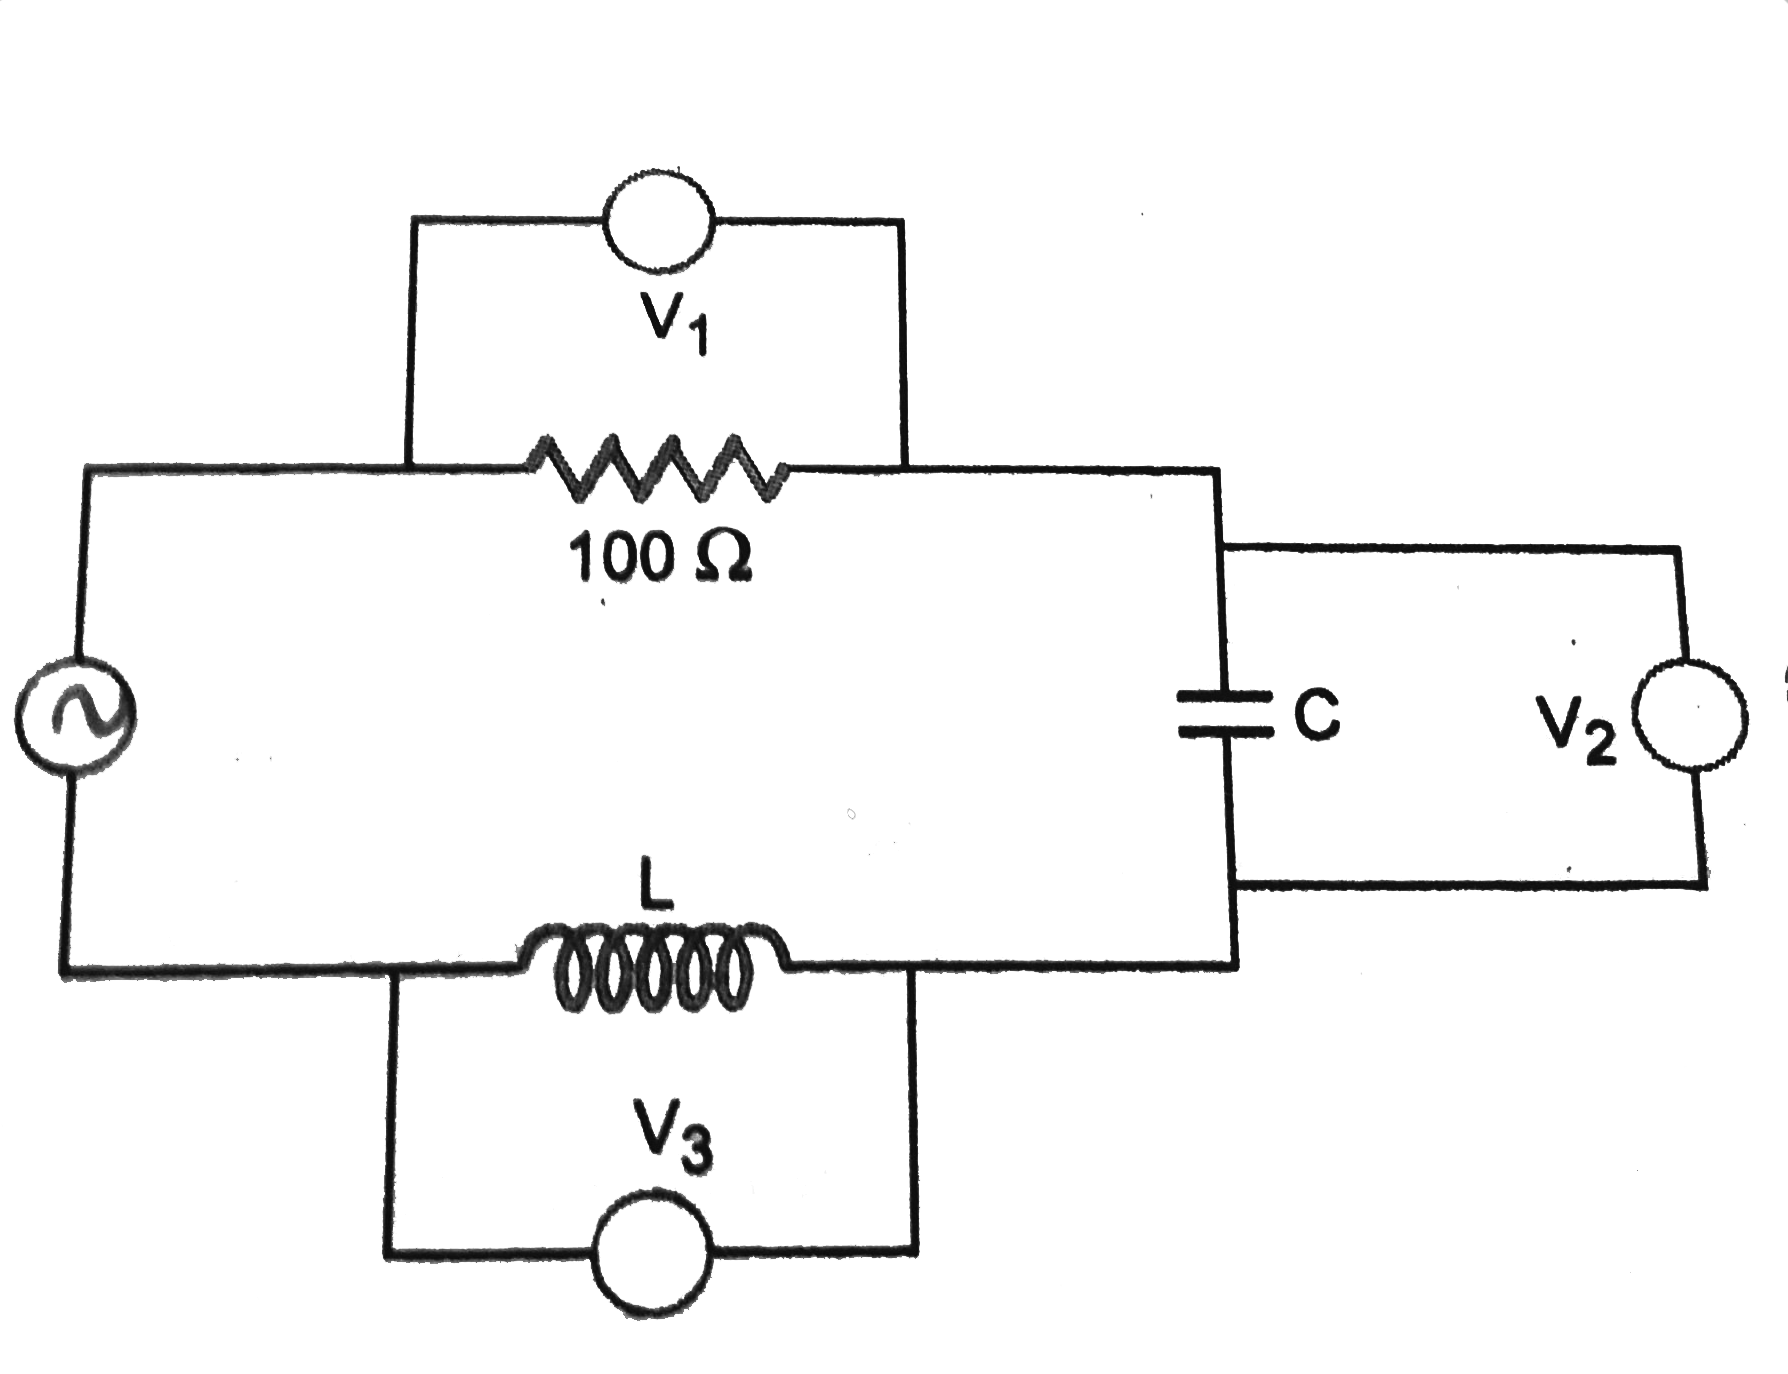
In the figure shown, the reading of voltmeters are V1=40V,V2=40V and V3=10V. Find
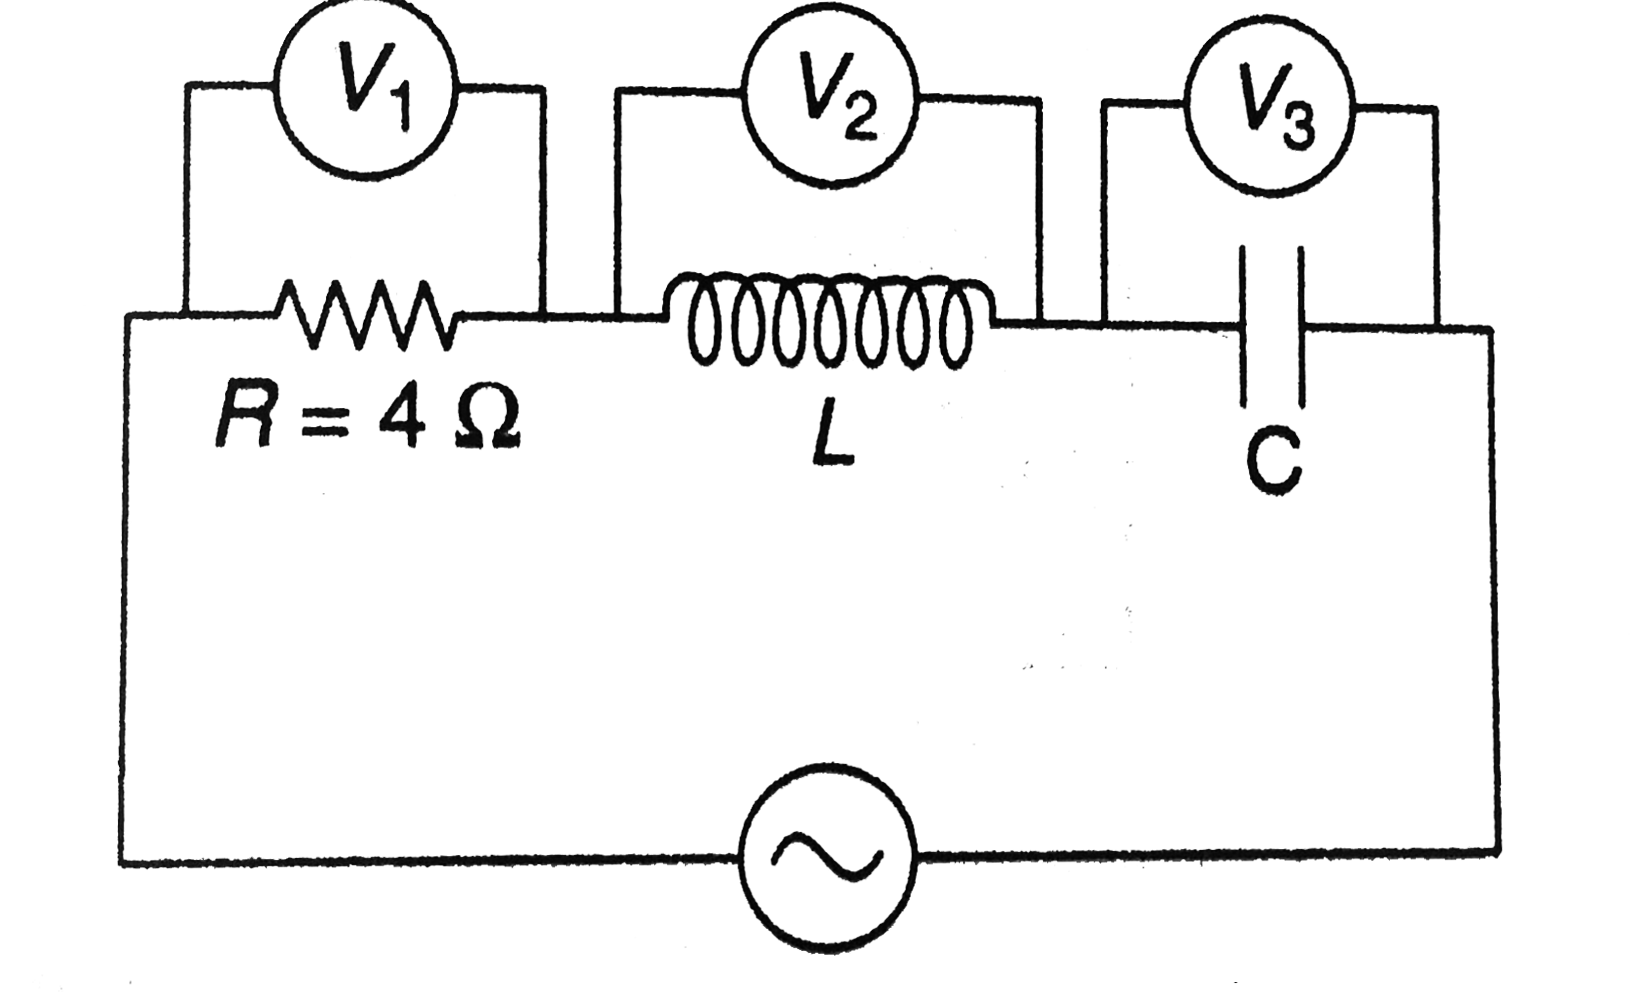
(a) the peak value of current
(b) the peak value of emf
(c) the value of L and C.
Video Solution
Text Solution
The correct Answer is:A, B, C, D
(a) irms=V1R=404=10A
i0=√2irms=10√2A
(b) E0√2=√V21+(V2−V1)2=50V
(c) XL=(ωL)=V2irms=4010=4Ω
∴L=4ω=4100πH=125πH
XC=1(ωC)=V1irms=1010=1Ω
∴C=1ω=1100πF.
|
Topper's Solved these Questions
Similar Questions
Knowledge Check
The peak value of 220 V of a.c. mains is
A155.6 VB220 VC311 VD440 VIn a R−L−C series circuit shown in readings of voltmeters V1 and V2 are 100V and 120V.
Choose the corredct statement(s).
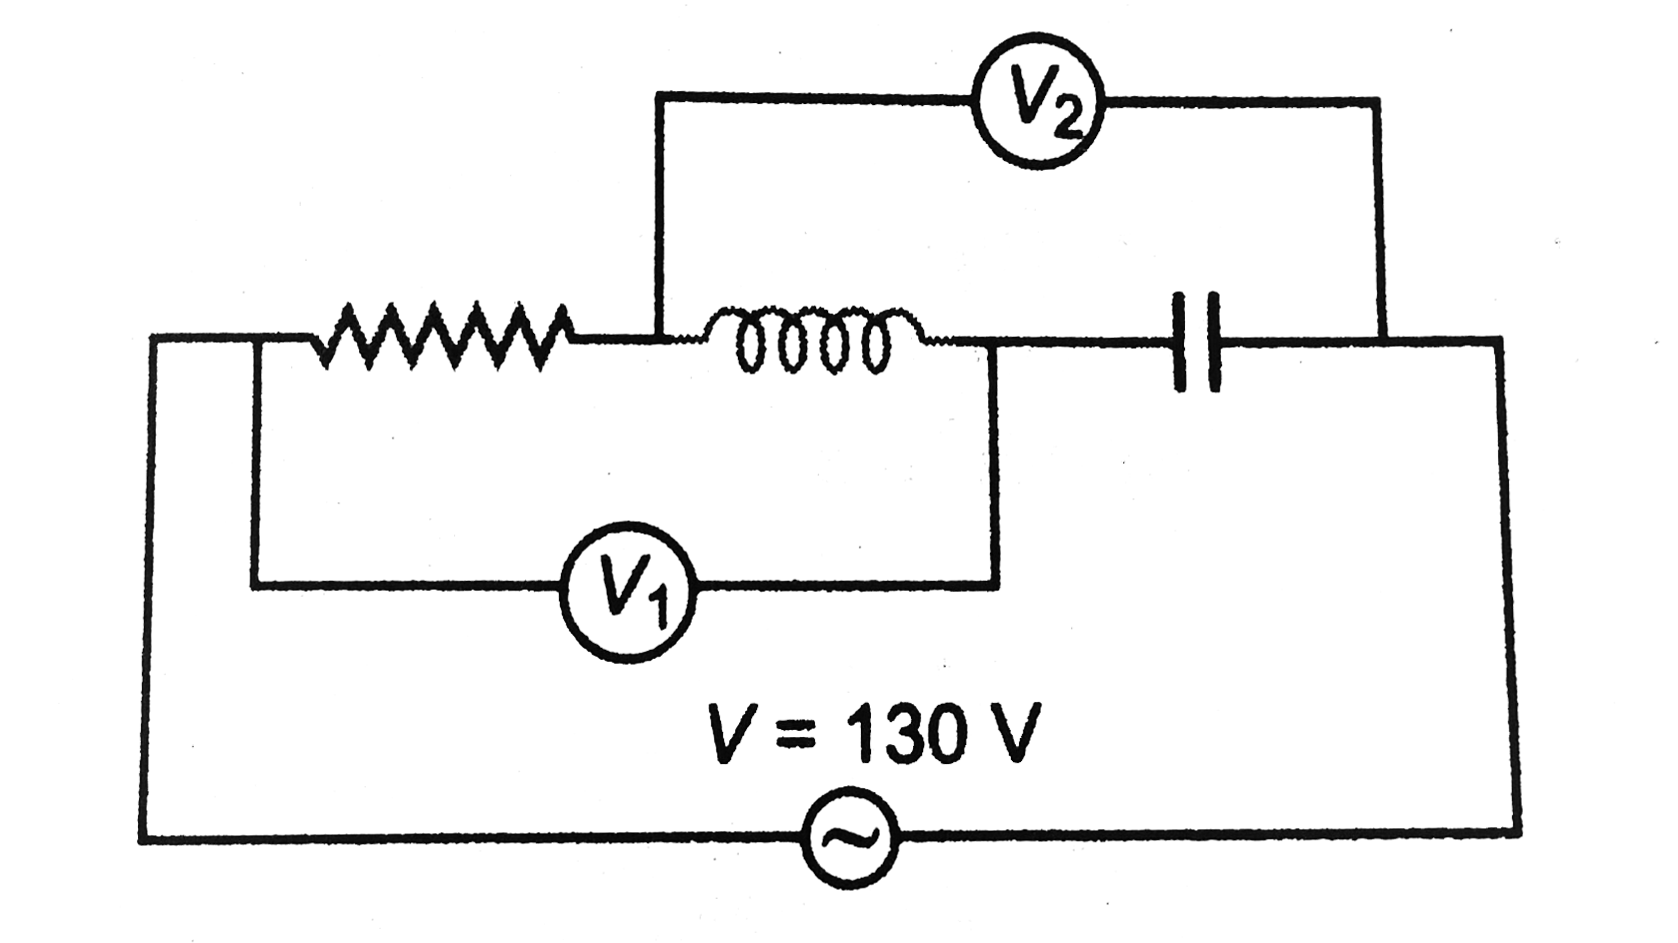 .AVoltage across resistor, inductor and capacitor are 50V,86.6V and 206.6V respectivelyBVoltage across resistor, inductor and capacitor are 10V,90V and 30V respectivelyCPower factor of the circuit is 513DCircuit is capacitive in nature
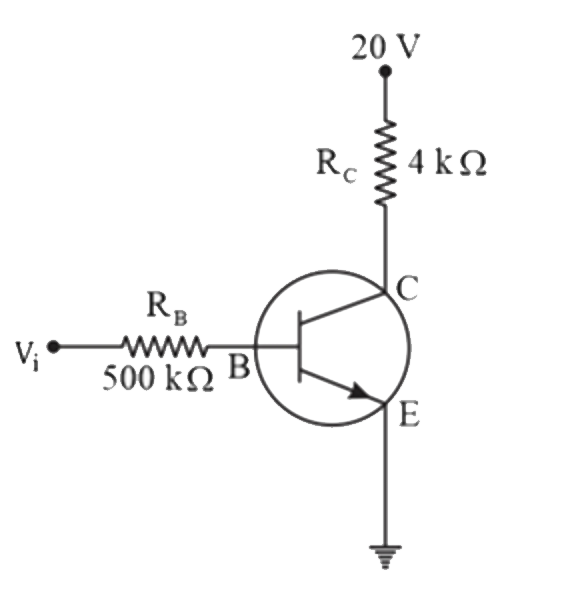
In the circuit shown in the figure, the input voltage Vi is 20V,VBE=0 and VCE=0. The values of IB,IC and β are given by:
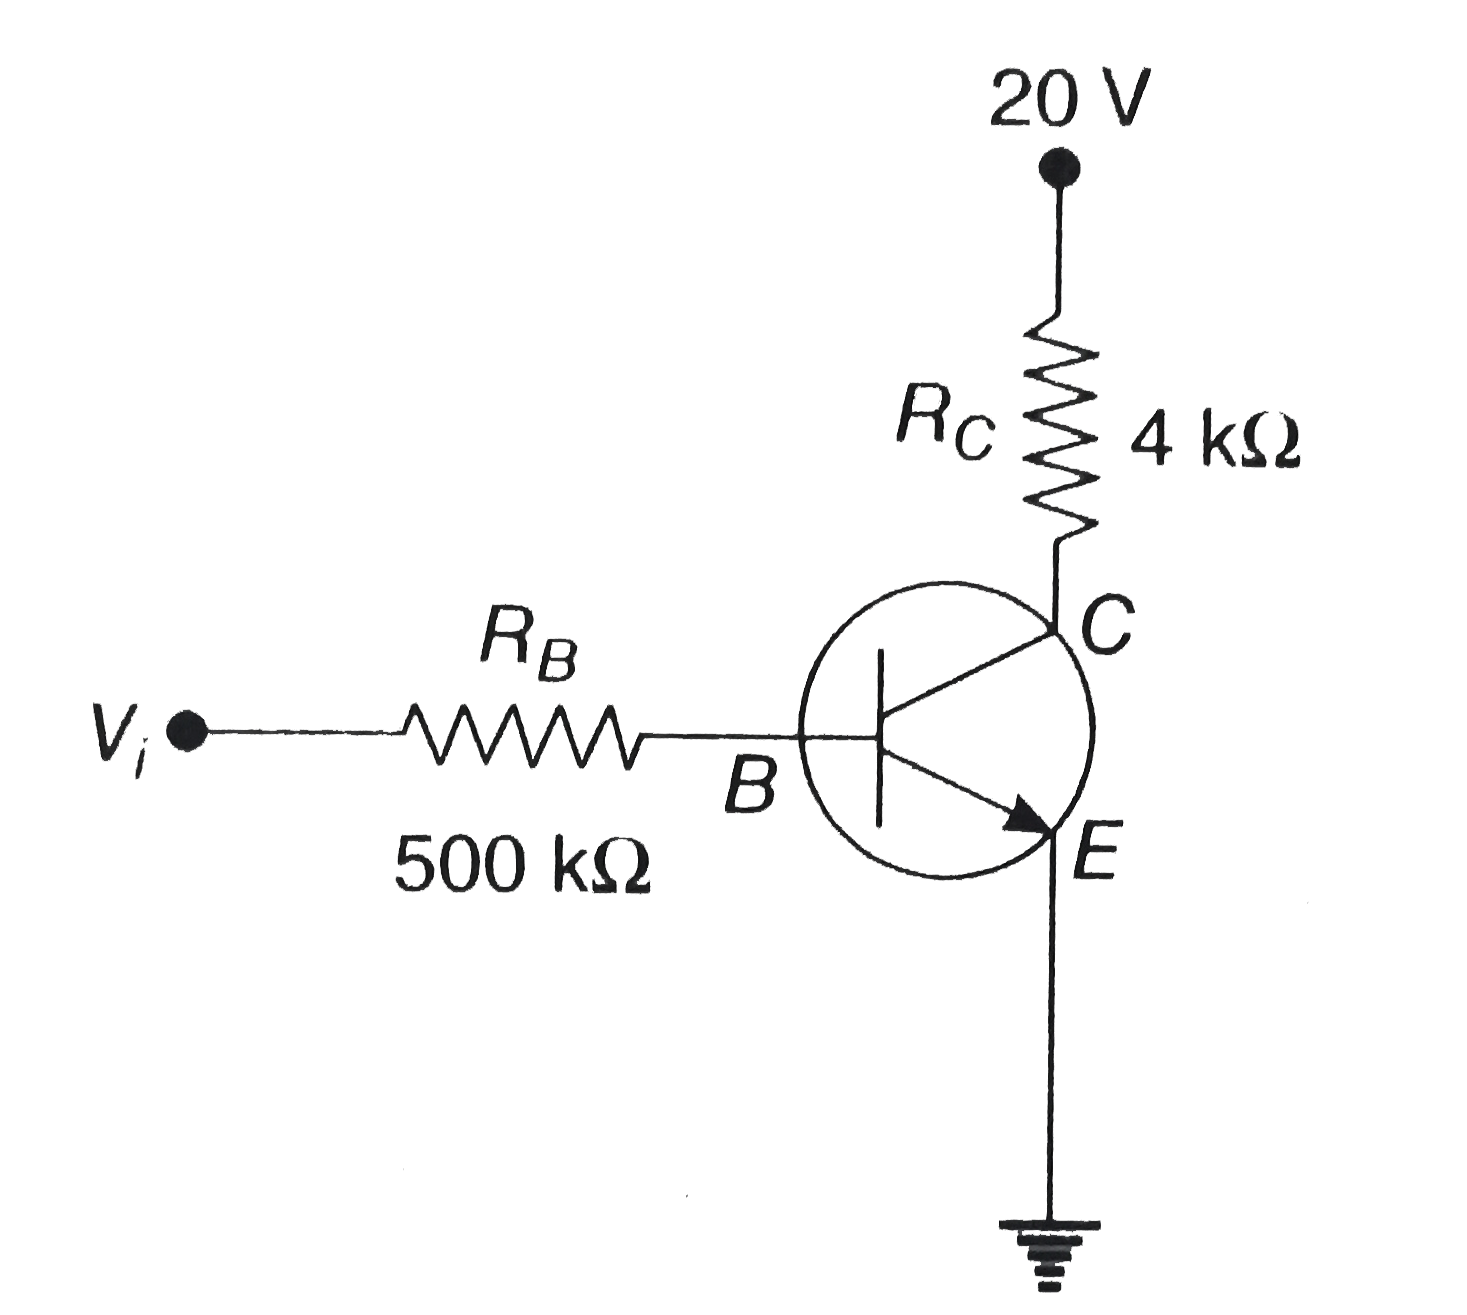 AIB=40μA,IC=10mA,β=250BIB=25μA,IC=5mA,β=200CIB=20μA,IC=5mA,β=250DIB=40μA,IC=5mA,β=125
A series LCR circuit is connected to an a.c. source 220 V - 50 Hz as shown in fig. If the reading of the three voltemeters V1,V2,V3 are 65 V, 415 V and 204 V respectively. Calculate (i) current in the circuit (ii) value of inductor L (ii) value of capacitor C (iv) value of C for same L required to produce resonance.
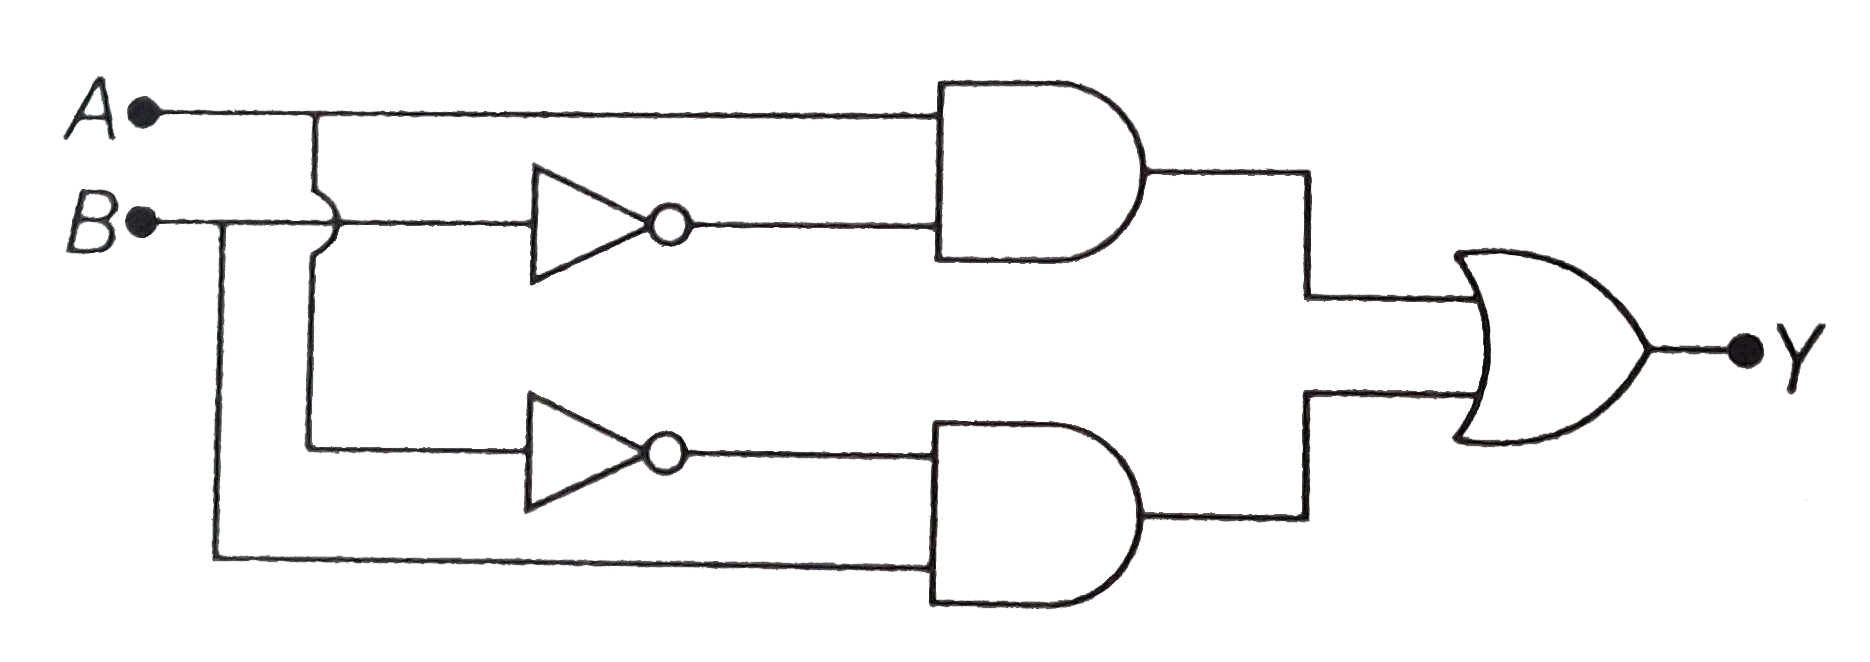
View SolutionIf the reading of volmeter V1 is 30 V, what is the reading of voltmeter V2 ?
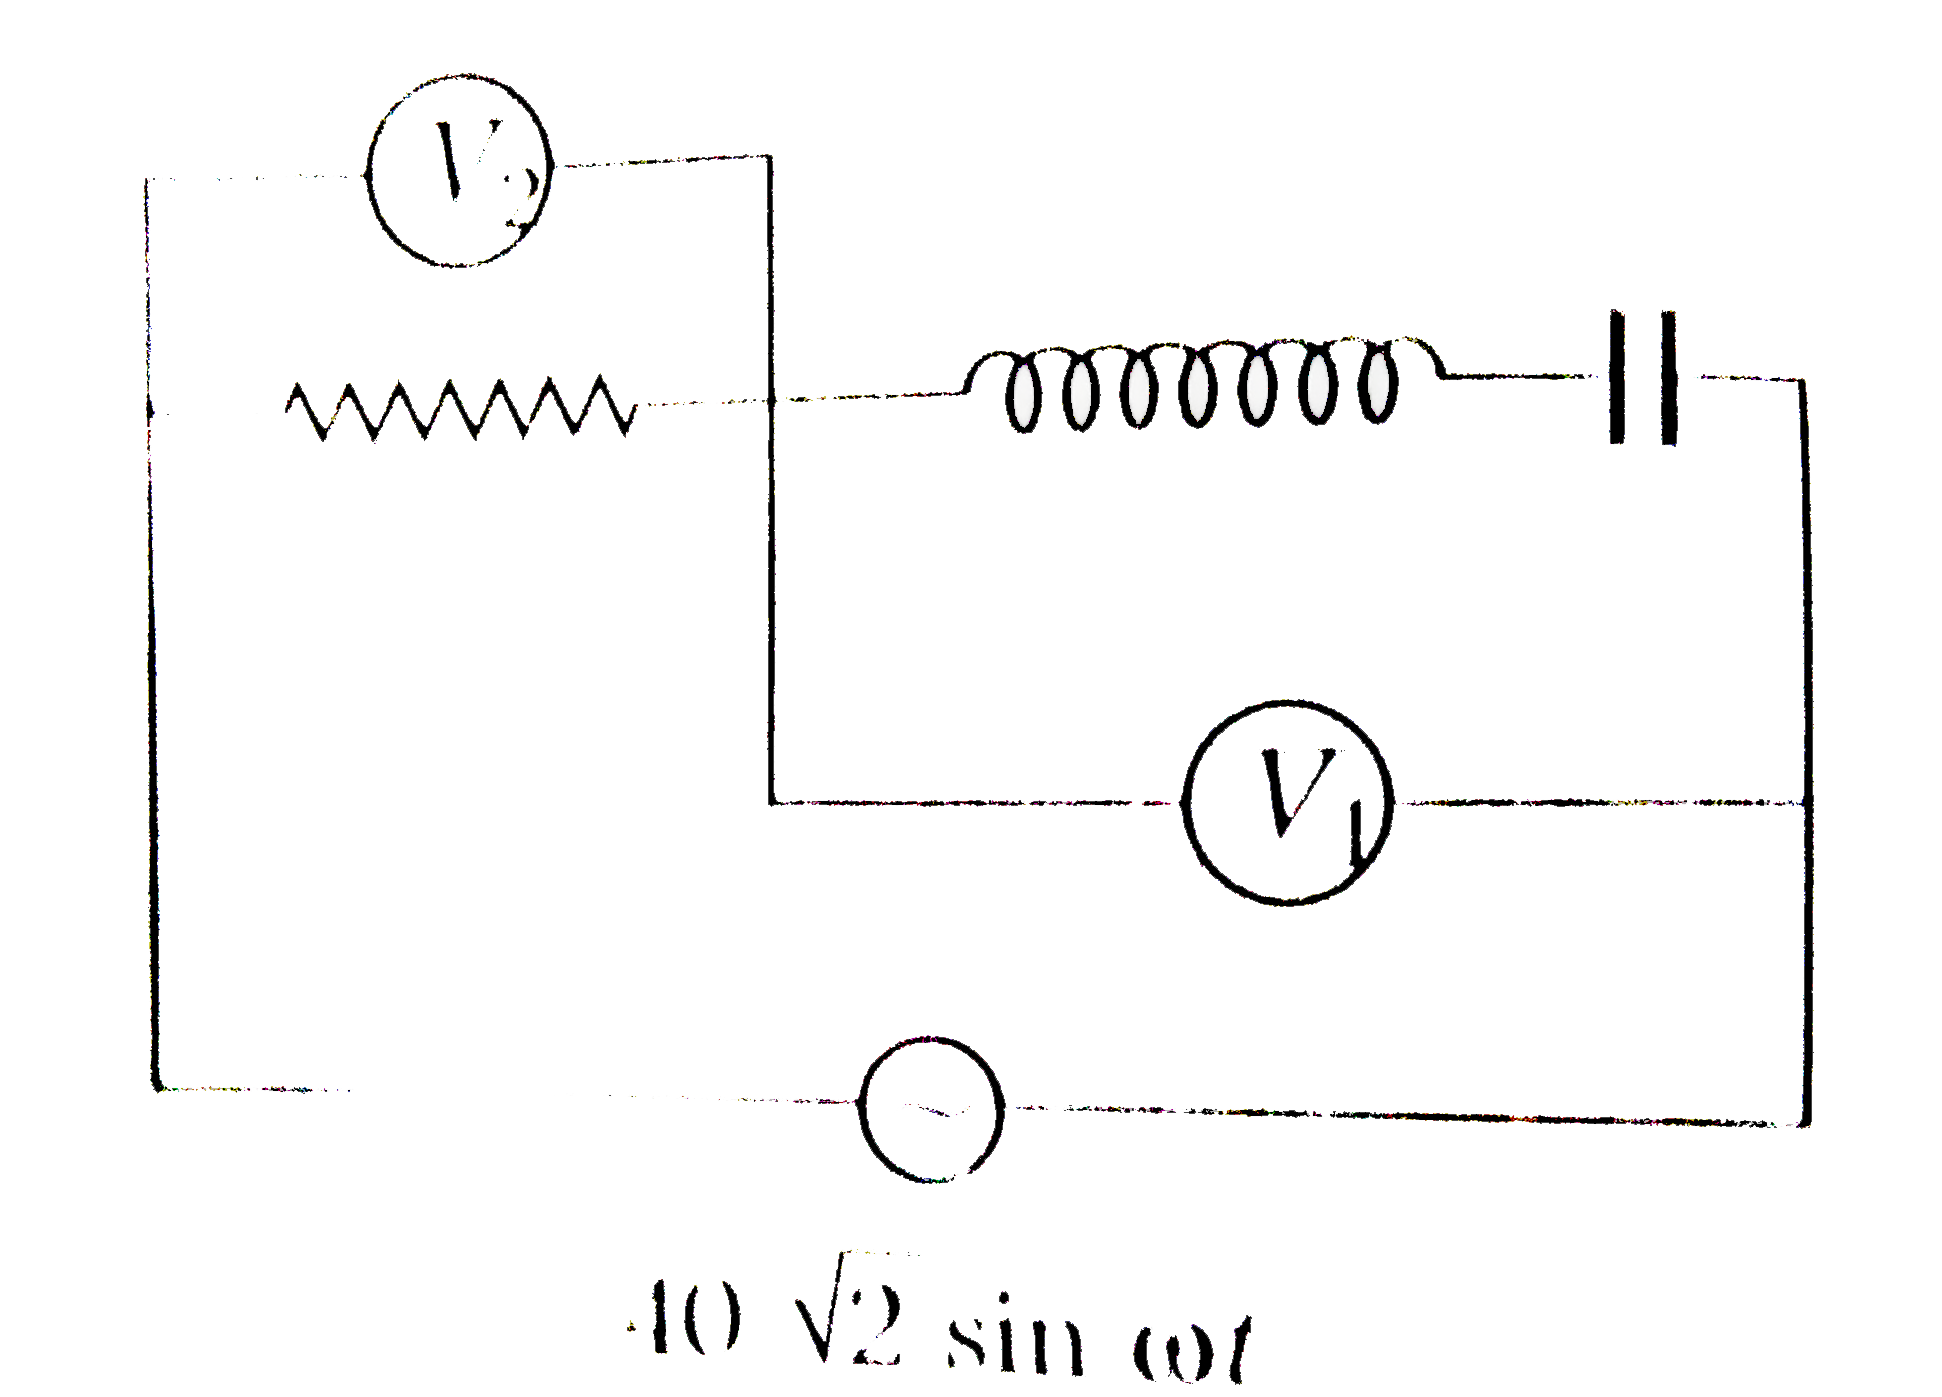
View SolutionIf reading of voltmeter V1 is 40 V, what is the reading of voltmeter V2?
View SolutionIn the circuit shown in the figure, the input voltage Vi is 20V, VBE=0 and VCE=0. The values of IB, IC and β are given by
View SolutionIn the circuit shows in the figure, the input voltage
Vi is 20 V, VBE=0 and VCE=0. The values of lB,lC and β are given by
View Solution
