A student in a lab took a coil and connected it to a 12VDC source. He measures the steady state current in the circuit to be 4A. He then replaced the 12VDC source by a 12V,(ω=50rads)AC source and observes that the reading in the AC ammeter is 2.4A. He then decides to connect a 2500μF capacitor in series with the coil and calculate the average power developed in the circuit. Further he also decides to study the variation in current in the circuit (with the capacitor and the battery in series).
Which of the following graph roughly matches the variation of current in the circuit (with the coil and capacitor connected in the series) when the angulr frequency is decreased from 50 rad/s to 25 rad/s?
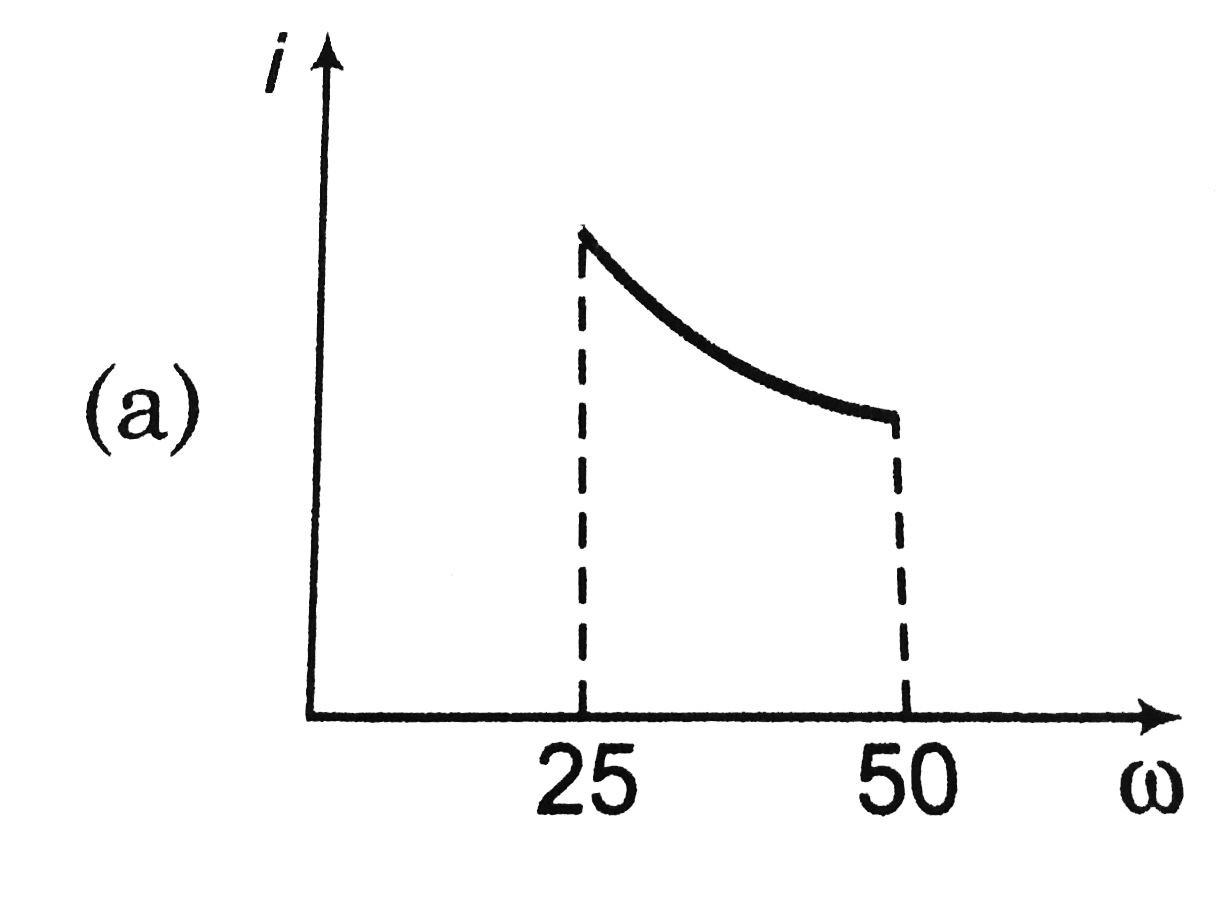
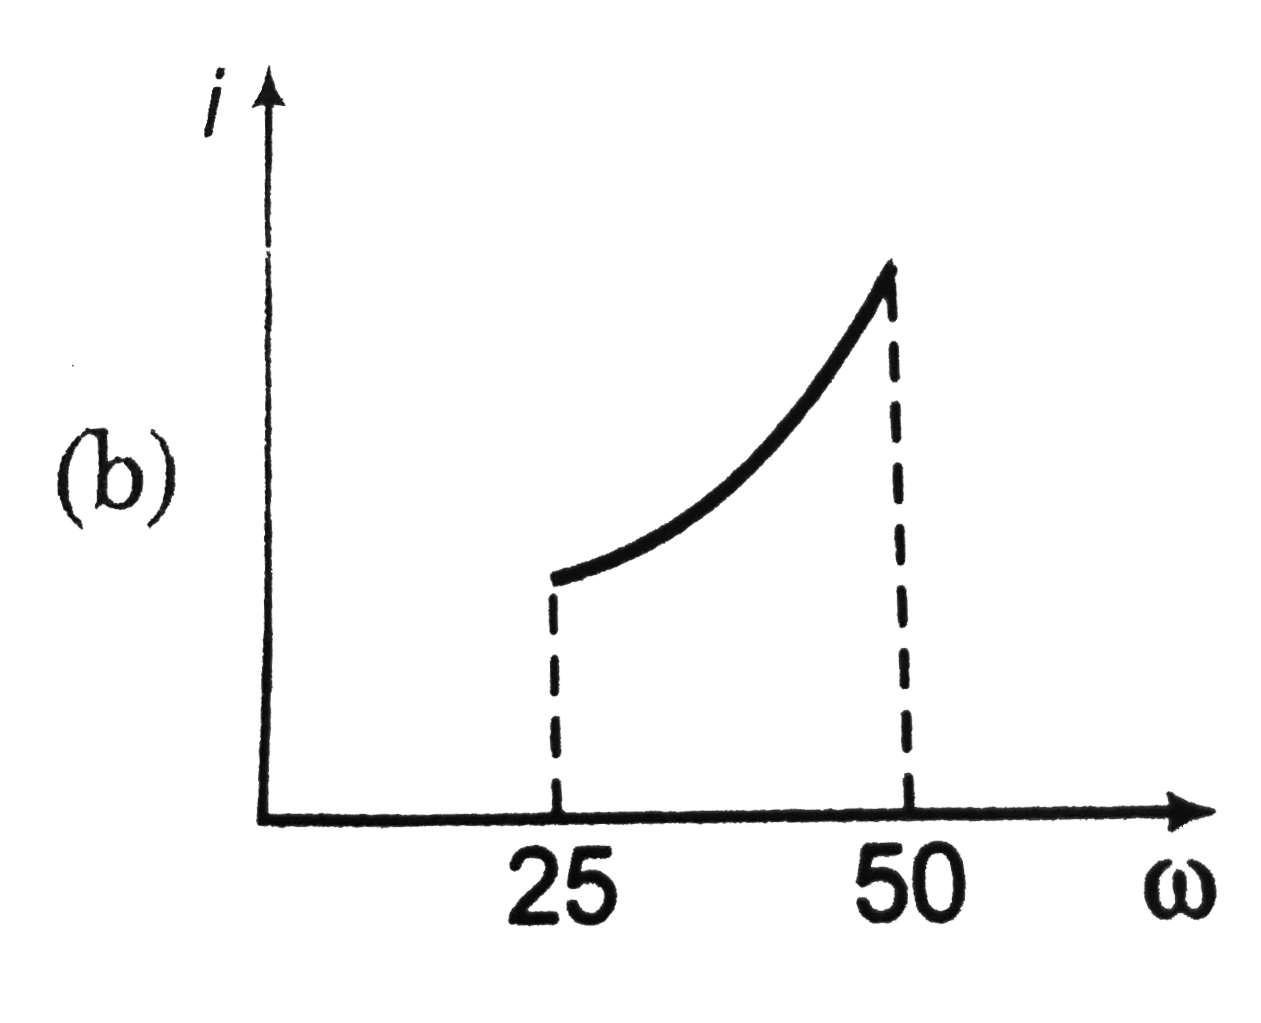
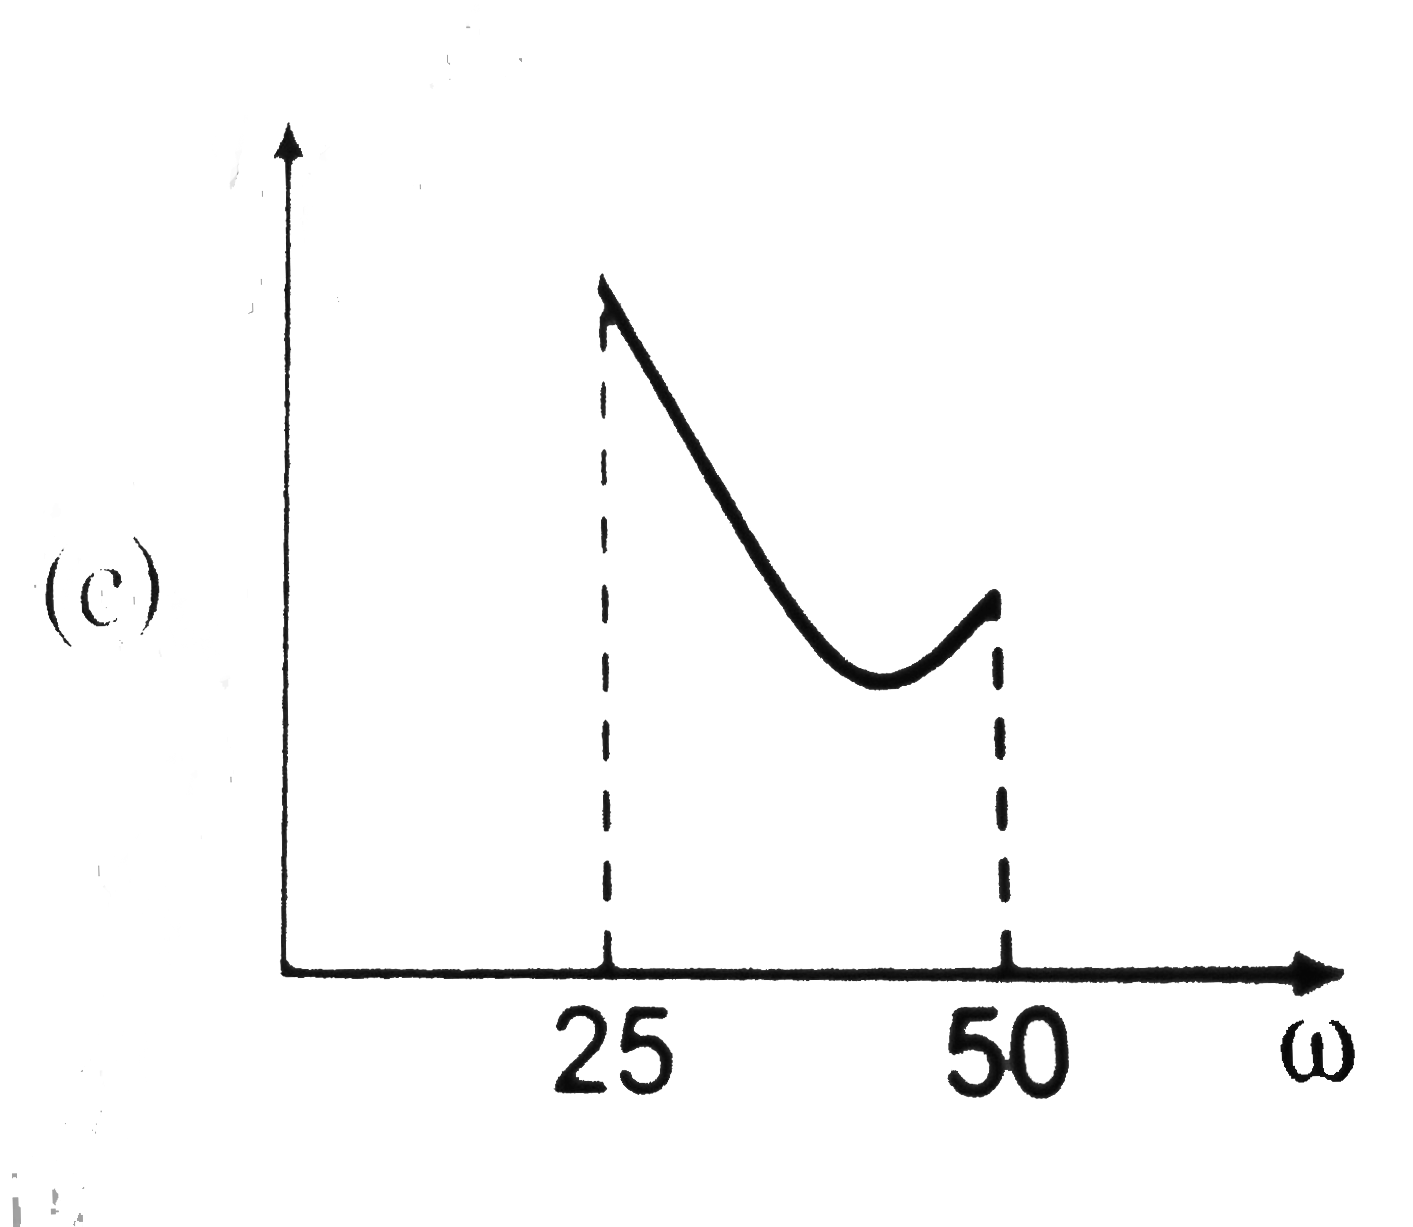
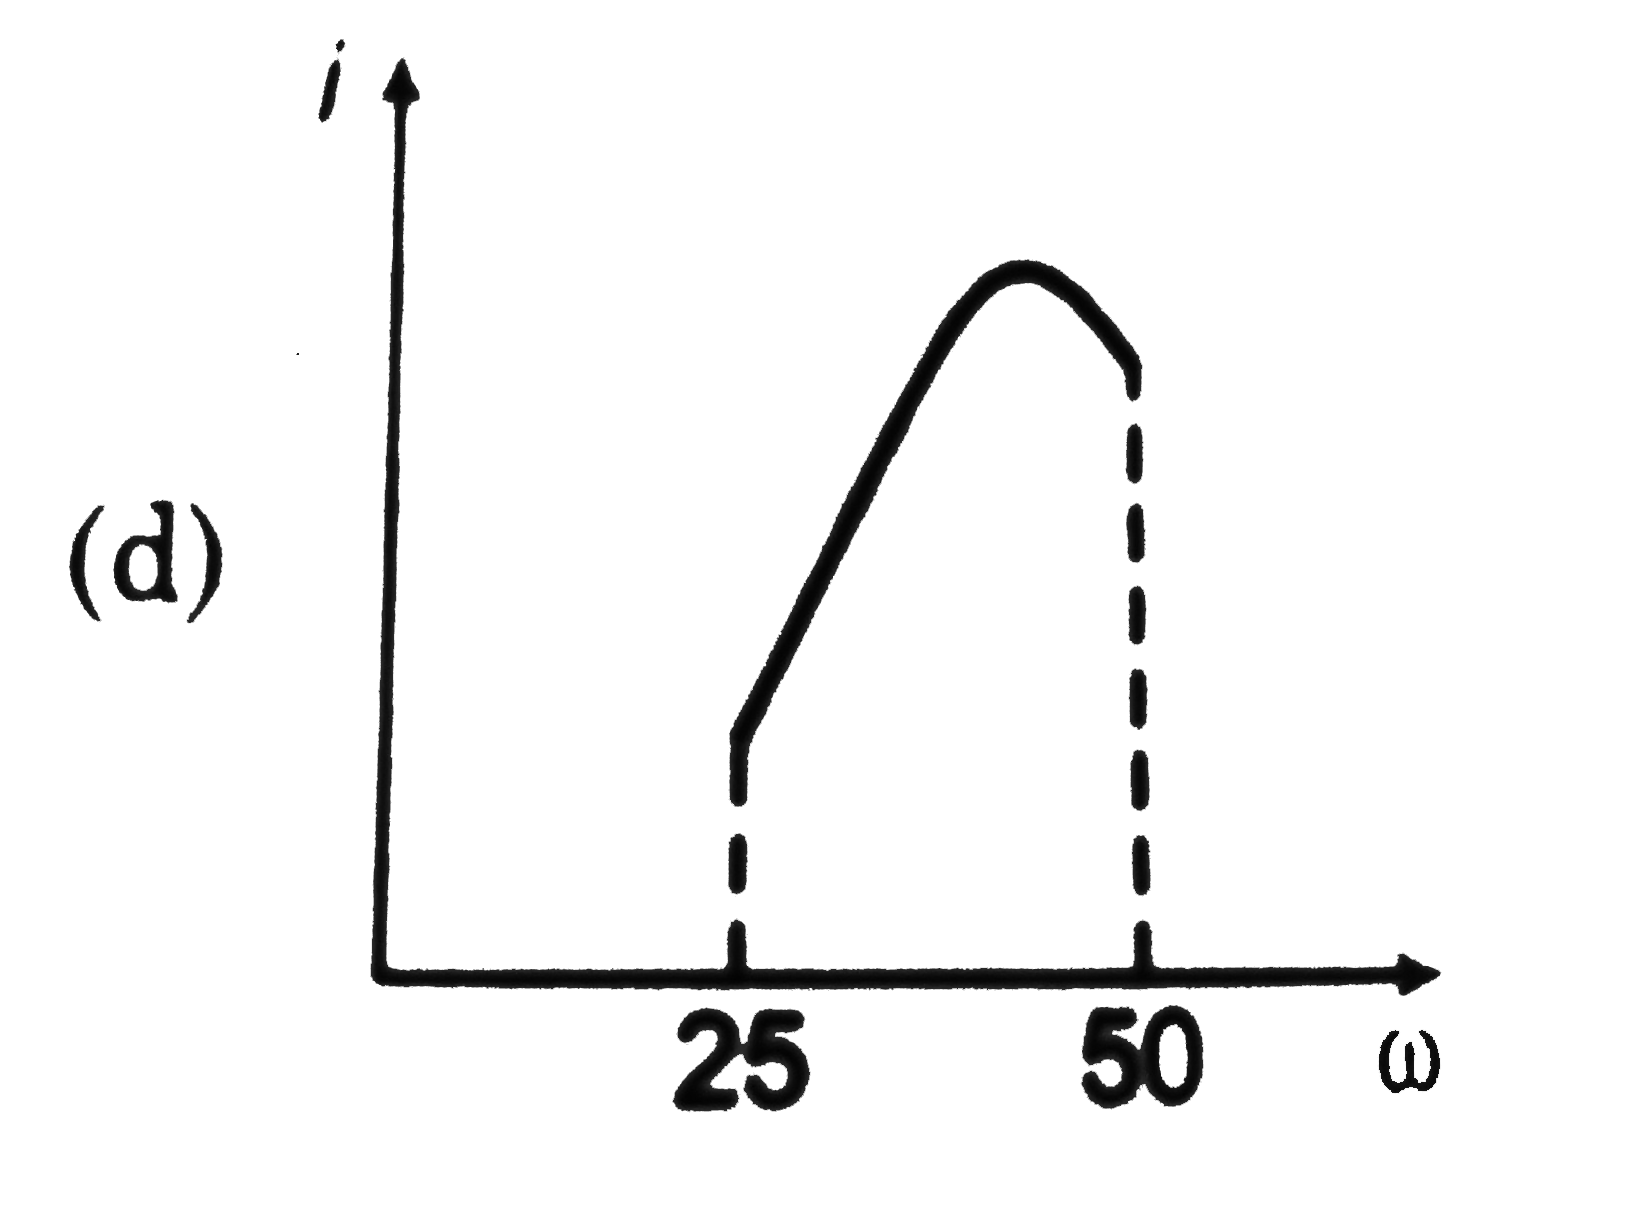
The correct Answer is:B
VDC=IDCR
∴R=VDCIDC=124=3Ω
IAC=VACZ=VAC√R2+X2L
2.4=12√(3)2+X2L
solving this equation we get,
XL=4Ω
XC=1ωC=150×2500×10−6
=8Ω
Z=√R2+(XC−XL)2=5Ω
∴I=VDCZ=125=2.4A=Irms
P=I2rmsR=(2.4)2(3)
=17.28W
At given frequency XC>XL if omega is further decreased XC will increas (as XC∝1ω) and XL will increase (as XL∝ω).
Therefore XC−XL and hence Z will increase. So, current will decrease.
Topper's Solved these Questions
- ALTERNATING CURRENTBOOK - DC PANDEYCHAPTER - ALTERNATING CURRENTEXERCISE - Level 2 Subjective
10 Videos
- ALTERNATING CURRENTBOOK - DC PANDEYCHAPTER - ALTERNATING CURRENTEXERCISE - JEE MAIN
63 Videos
- ALTERNATING CURRENTBOOK - DC PANDEYCHAPTER - ALTERNATING CURRENTEXERCISE - Level- 2More Than One Correct
8 Videos
- ATOMSBOOK - DC PANDEYCHAPTER - ATOMSEXERCISE - MEDICAL ENTRANCES GALLERY
42 Videos
Similar Questions
A coil is series with a 20μF capacitor across a 230V,50Hz supply. The current taken by the circuit is 8A and the power consumed is 200W. Calculate the inductance of the coil if the current in the circuit is
(a) leading
(b) lagging
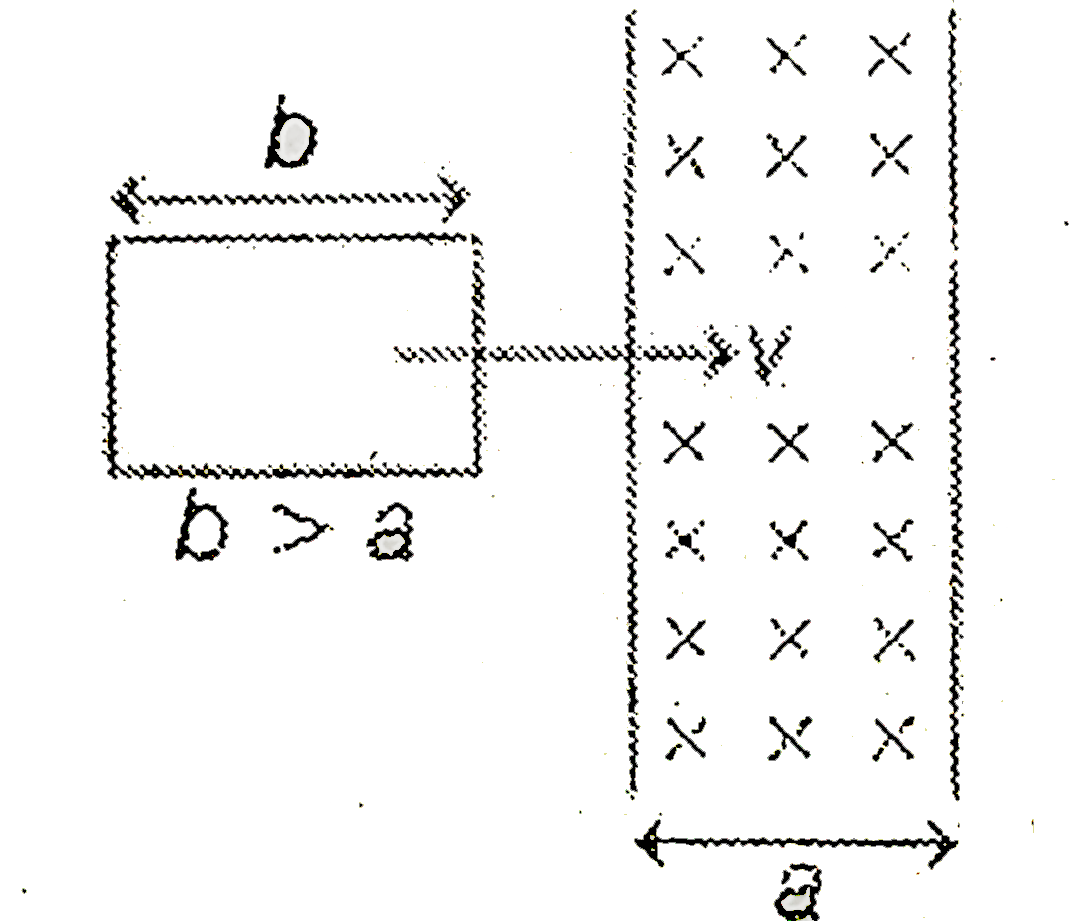
View SolutionIn the given arrangement, the loop is moved with consisant velocity in uniform magnetic field B in a restricted a region of width a. The time for which the emf is induced in the cirucit is
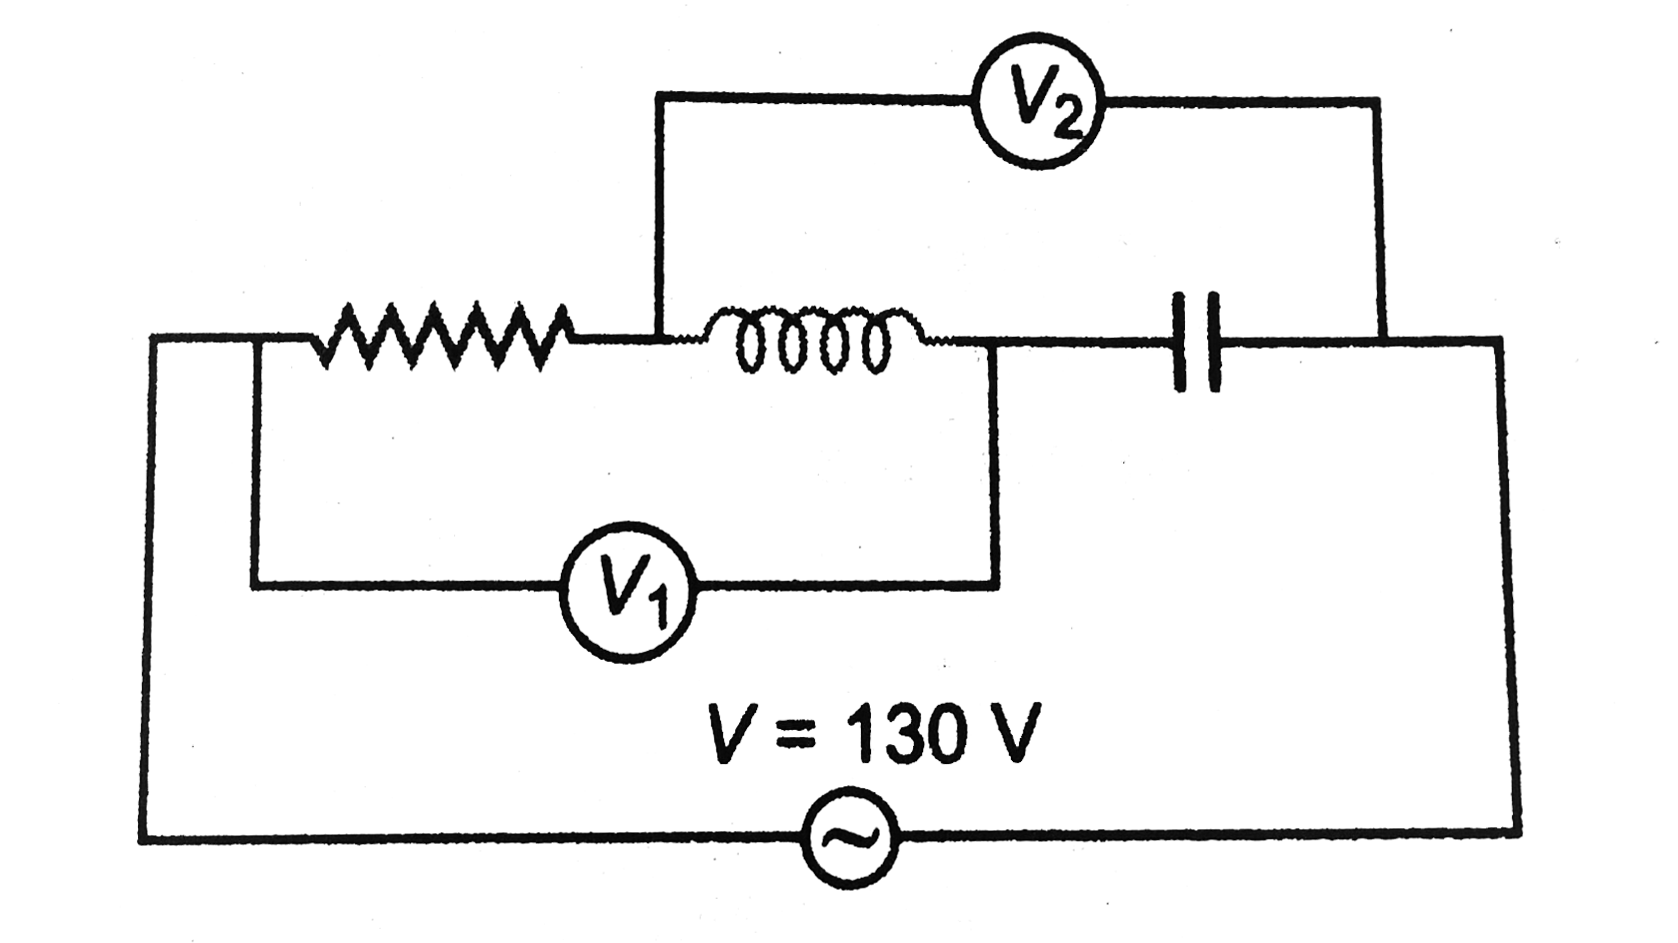
View SolutionIn a R−L−C series circuit shown in readings of voltmeters V1 and V2 are 100V and 120V.
Choose the corredct statement(s).
 .
.
View SolutionGiven the value of Rydberg constant is 107m−1, the waves number of the lest line of the Balmer series in hydrogen spectrum will be:
View SolutionA current of 4A flows in a coil when connected to a 12VDC source. If the same coil is connected to a 12V,50rad/sAC source, a current of 2.4A flows in the circuit. Determine the inductance of the coil. Also, find the power developed in the circuit if a2500μF capacitor is connected in series with the coil.
View SolutionA student in a lab took a coil and connected it to a 12VDC source. He measures the steady state current in the circuit to be 4A. He then replaced the 12VDC source by a 12V,(ω=50rad/s)AC source and observes that the reading in the AC ammeter is 2.4A. He then decides to connect a 2500μF capacitor in series with the coil and calculate the average power developed in the circuit. Further he also decides to study the variation in current in the circuit (with the capacitor and the battery in series).
The value of resistance of the coil calculated by the student is
View SolutionA student in a lab took a coil and connected it to a 12VDC source. He measures the steady state current in the circuit to be 4A. He then replaced the 12VDC source by a 12V,(ω=50rad/s)AC source and observes that the reading in the AC ammeter is 2.4A. He then decides to connect a 2500μF capacitor in series with the coil and calculate the average power developed in the circuit. Further he also decides to study the variation in current in the circuit (with the capacitor and the battery in series).
The power developed in te circuit when the capacitor of 2500 μF is connected in series with the coil is
View SolutionA current of 4 A flows in a coil when connected to a 12 V dc source. If the same coil is connected to a 12V,50rads−1 ac source, a current of 2.4 A flows of the coil in the circuit.
The inductance of the coil is
View SolutionA current of 4 A flows in a coil when connected to a 12 V dc source. If the same coil is connected to a 12 V, 50 rad s^(-1) ac source, a current of 2.4 A flows of the coil in the circuit. The power developed in the circuit of a 2500 (mu)F capacitor that is connected in series with the coil is
View SolutionA steady 4 A flows in an inductor coil when connected to a 12 V source as shown in figure. If the same coil is connected to an ac source of 12 V , 50 "rad"//s a currentd of 2.4 A flows in the circuit as shown in figure2. Now after these observations , a capacitor fo capacitance (1)/(50) F is connected in series with the coil and with same AC source as shown in figure 3. The resistance of the coil is:
View SolutionAchoke coil is connected across 18 VDC supply and current of 6 A is found to flow through it in steady state. Now the same choke coil is connected to 15 VAC source whose angular frequency is 50 rad /s and current of 3 A is found to flow through it. (i) Calculate self - inducatance of the coil. (ii) If a capacitor of 2500 muF is connected in series with the coil then calculate power developed in the circuit.
View SolutionWhen a coil is connected to a D.C source of emf 12V, a current of 4 amp flows in it. If same coil is connected to 12V, 50Hz AC source, the current is 2.4 A. The self inductance of the coil is
View SolutionA current of 4A flows in a coil when connected to a 12V DC source. If the same coil is connected to a 12V, 50 rad//s AC source, a current of 2.4A flows in the circuit. Determine the inductance of the coil. Also, find the power developed in the circuit if a 2500muF capacitor is connected in series with the coil.
View SolutionA current of 4A flows in a coil when connected to a 12VDC source. If the same coil is connected to a 12V,50rad/sAC source, a current of 2.4A flows in the circuit. Determine the inductance of the coil. Also, find the power developed in the circuit if a2500μF capacitor is connected in series with the coil.
View SolutionA student in a lab took a coil and connected it to a 12VDC source. He measures the steady state current in the circuit to be 4A. He then replaced the 12VDC source by a 12V,(ω=50rad/s)AC source and observes that the reading in the AC ammeter is 2.4A. He then decides to connect a 2500μF capacitor in series with the coil and calculate the average power developed in the circuit. Further he also decides to study the variation in current in the circuit (with the capacitor and the battery in series).
The value of resistance of the coil calculated by the student is
View Solution