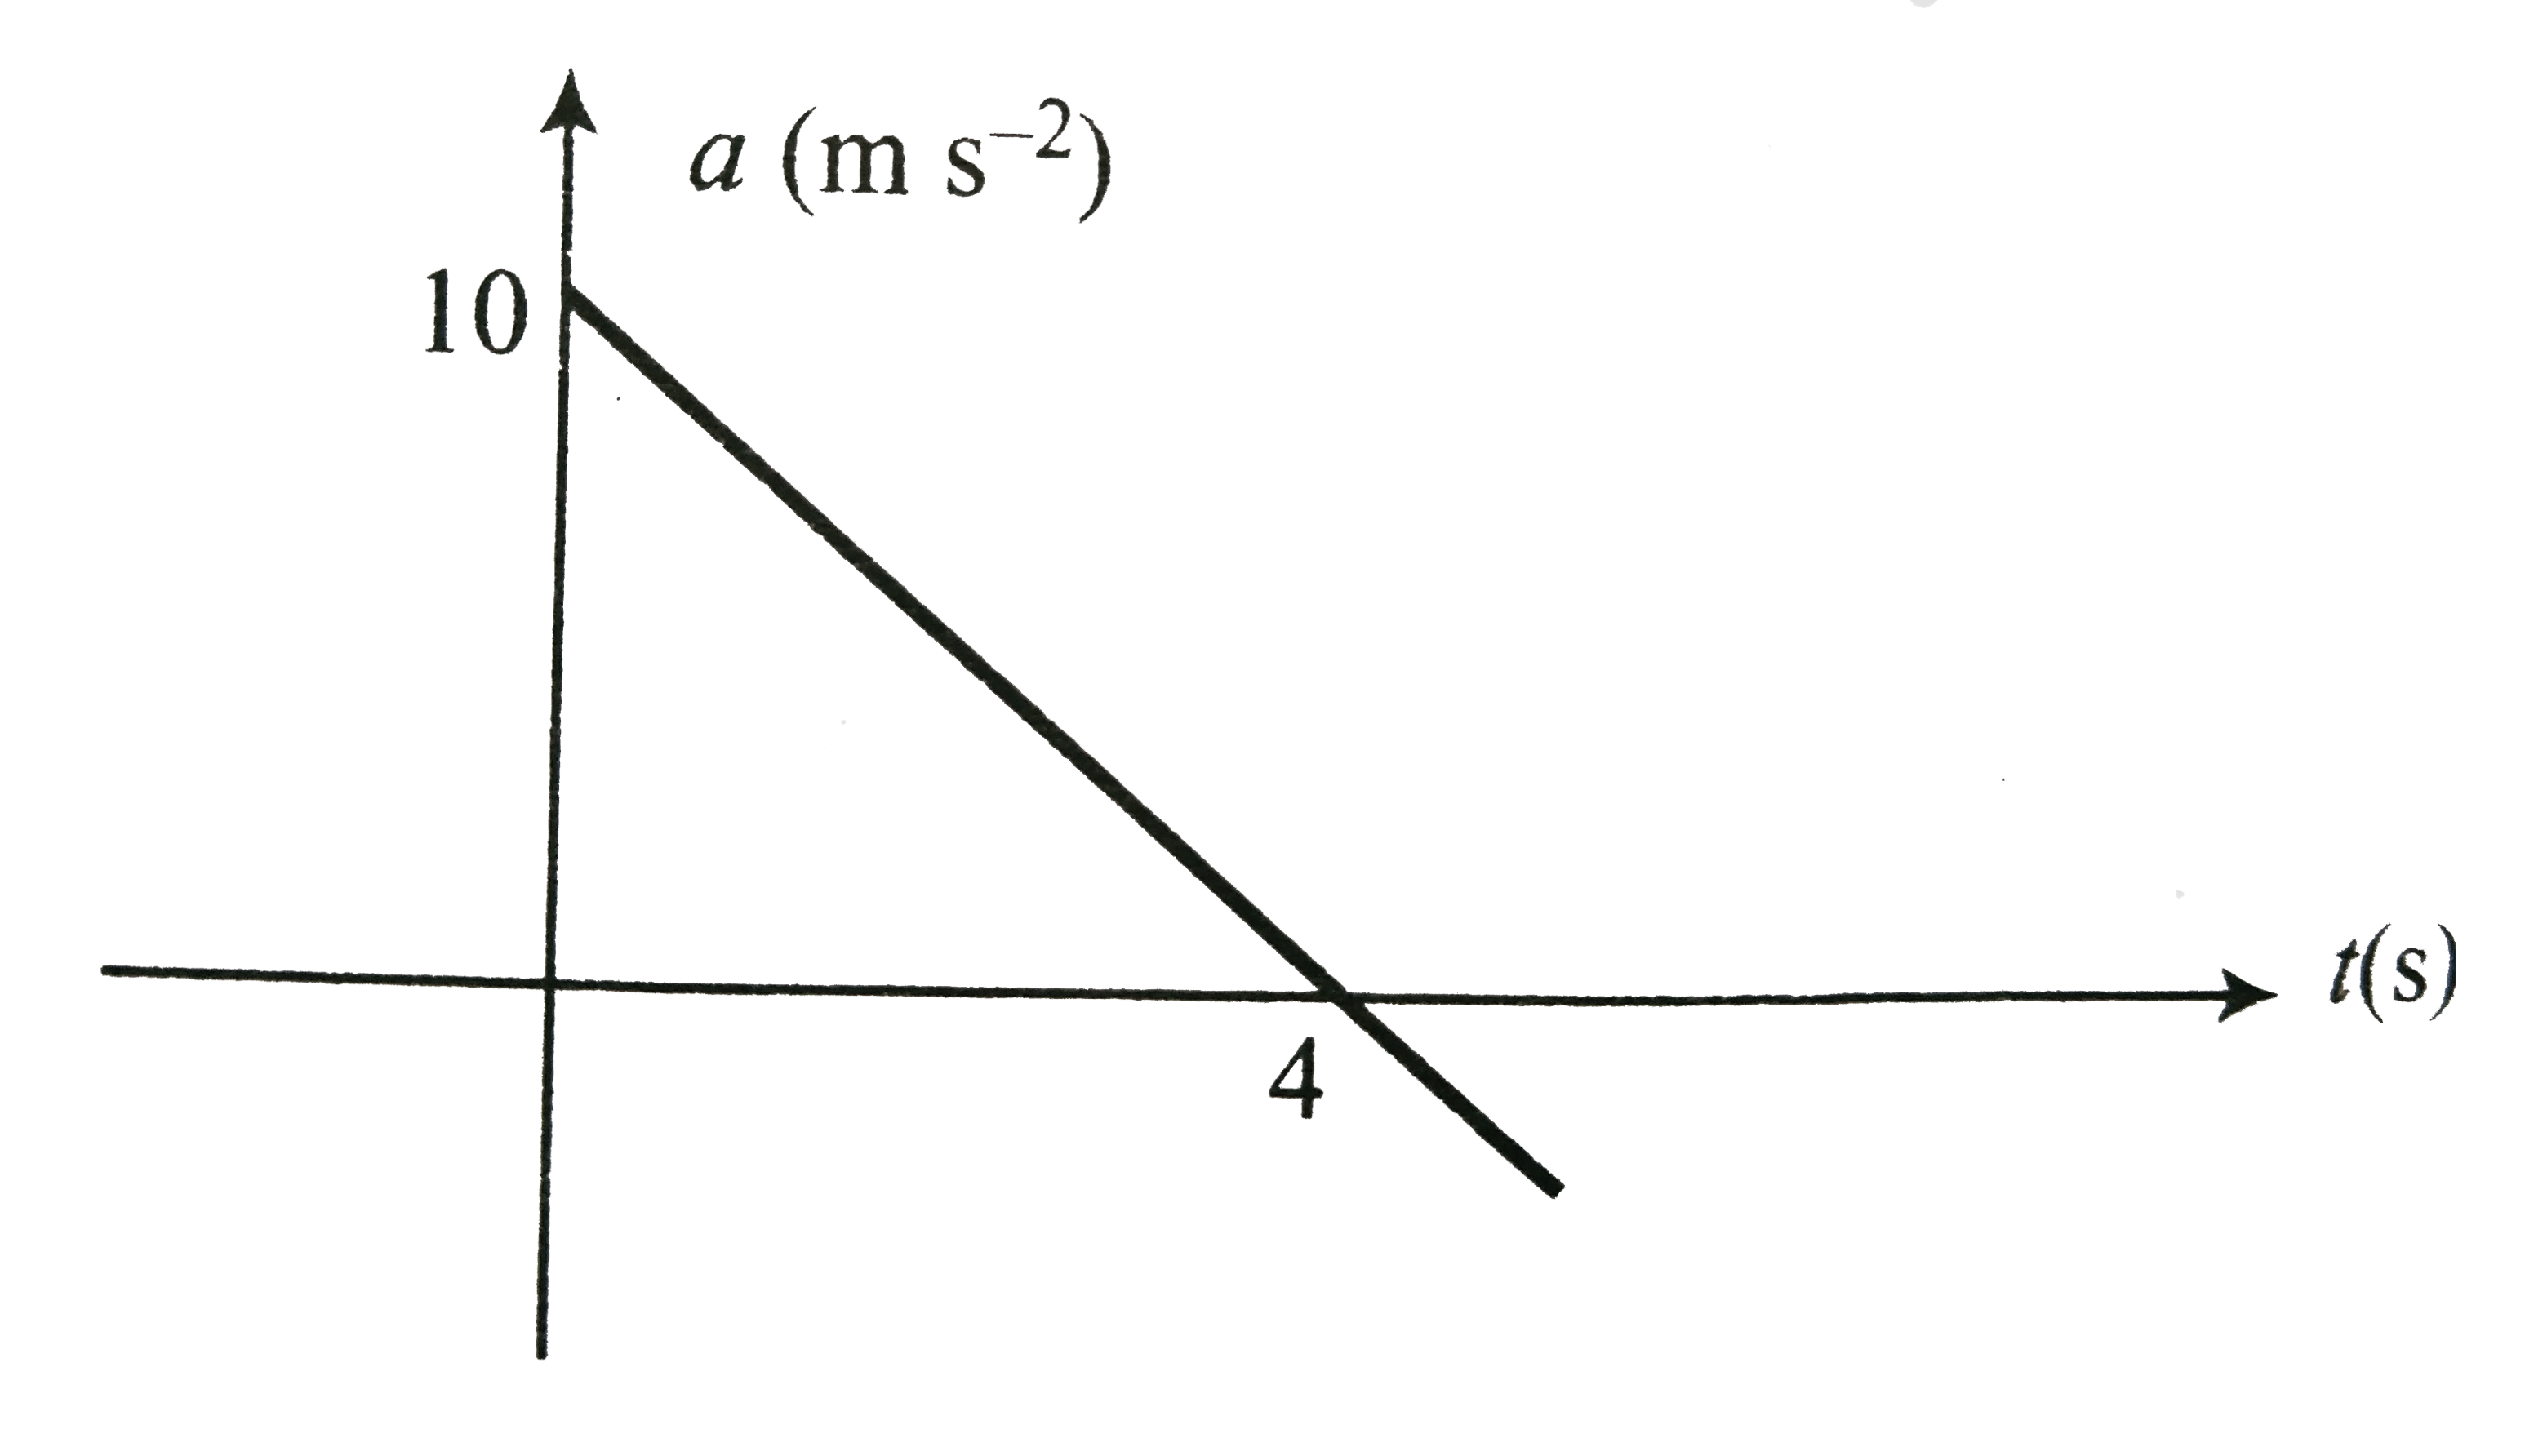
Accleration-time graph of a particle moving in a straight line is as shown in Fig. Velocity of particle at time t=0 is 2m/s. Find the velocity at the end of fourth second. 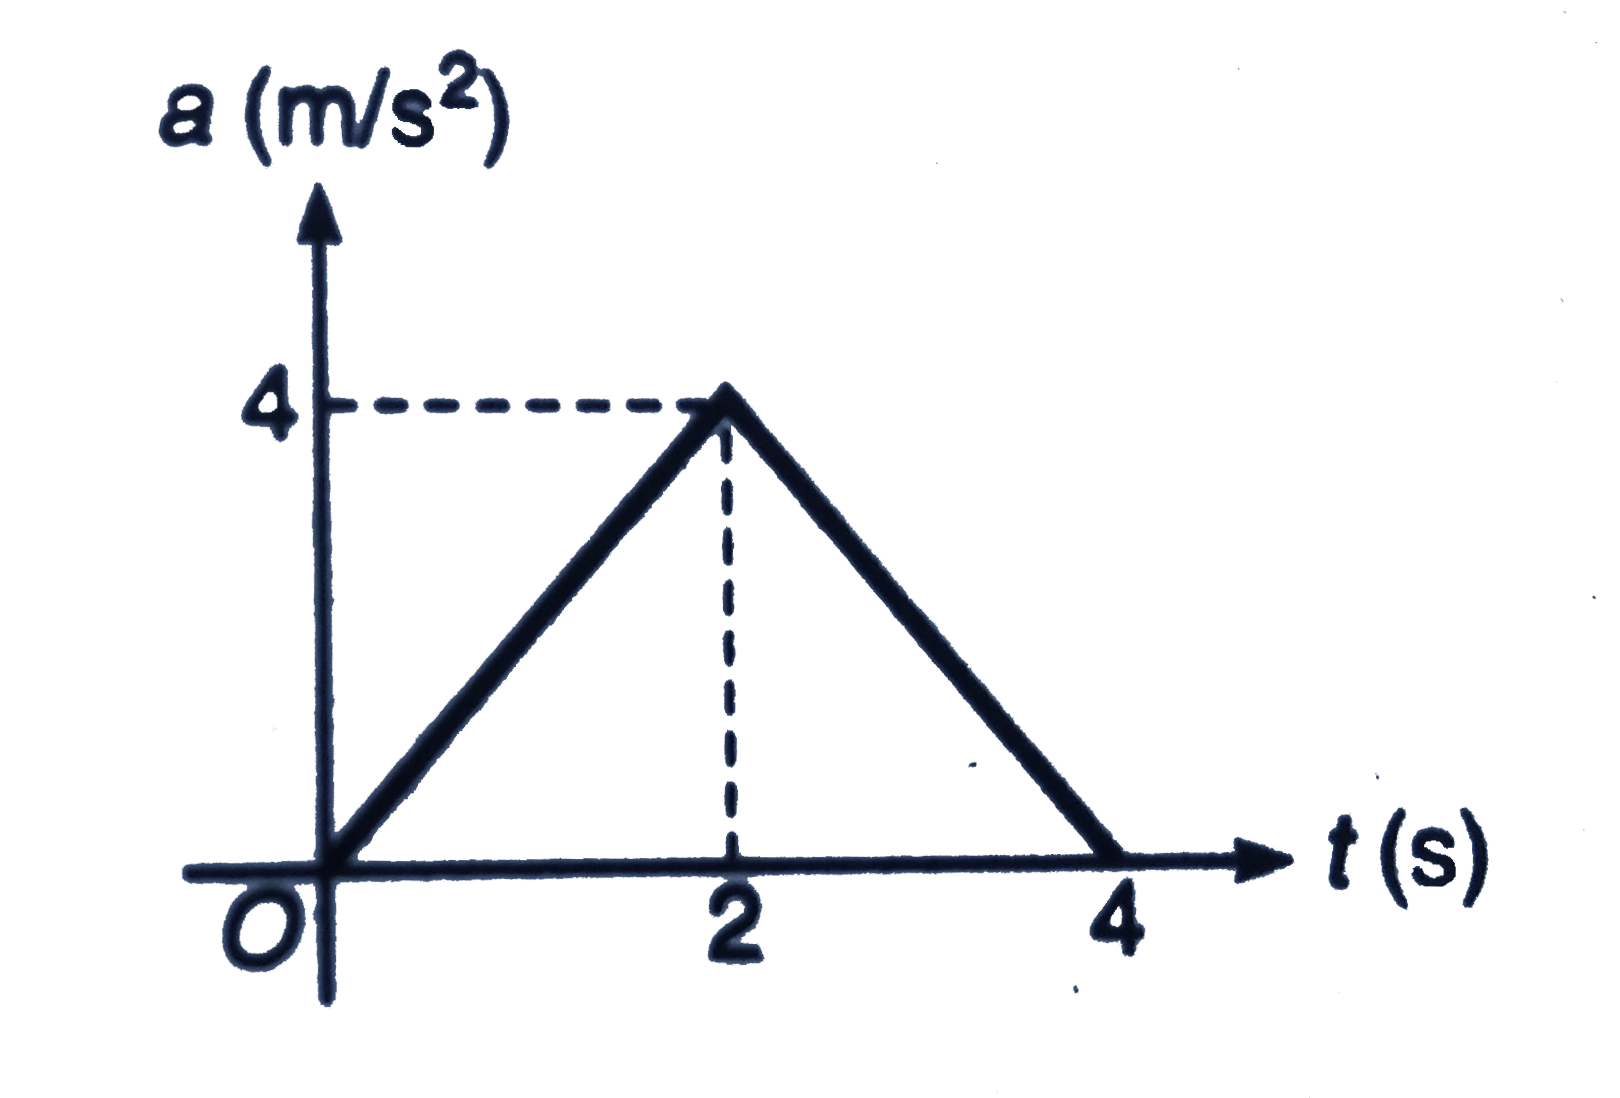
The correct Answer is:A
∫dv=∫adt
or change in velocity=area under a-t graph
Hence, vf−vi=12(4)(4)
=8m/s
∴vf=vi+8=(2+8)m/s
=10m/s
Topper's Solved these Questions
- KINEMATICSBOOK - DC PANDEYCHAPTER - KINEMATICSEXERCISE - Example Type 1
1 Video
- KINEMATICSBOOK - DC PANDEYCHAPTER - KINEMATICSEXERCISE - Example Type 2
1 Video
- GRAVITATIONBOOK - DC PANDEYCHAPTER - GRAVITATIONEXERCISE - (C) Chapter Exercises
45 Videos
- KINEMATICS 1BOOK - DC PANDEYCHAPTER - KINEMATICS 1EXERCISE - INTEGER_TYPE
15 Videos
Similar Questions
Acceleration - time graph of a particle moving in a straight line is shown in figure. Velocity of particle at time t = 0 is 2ms−1. Find velocity at the end of fourth second.
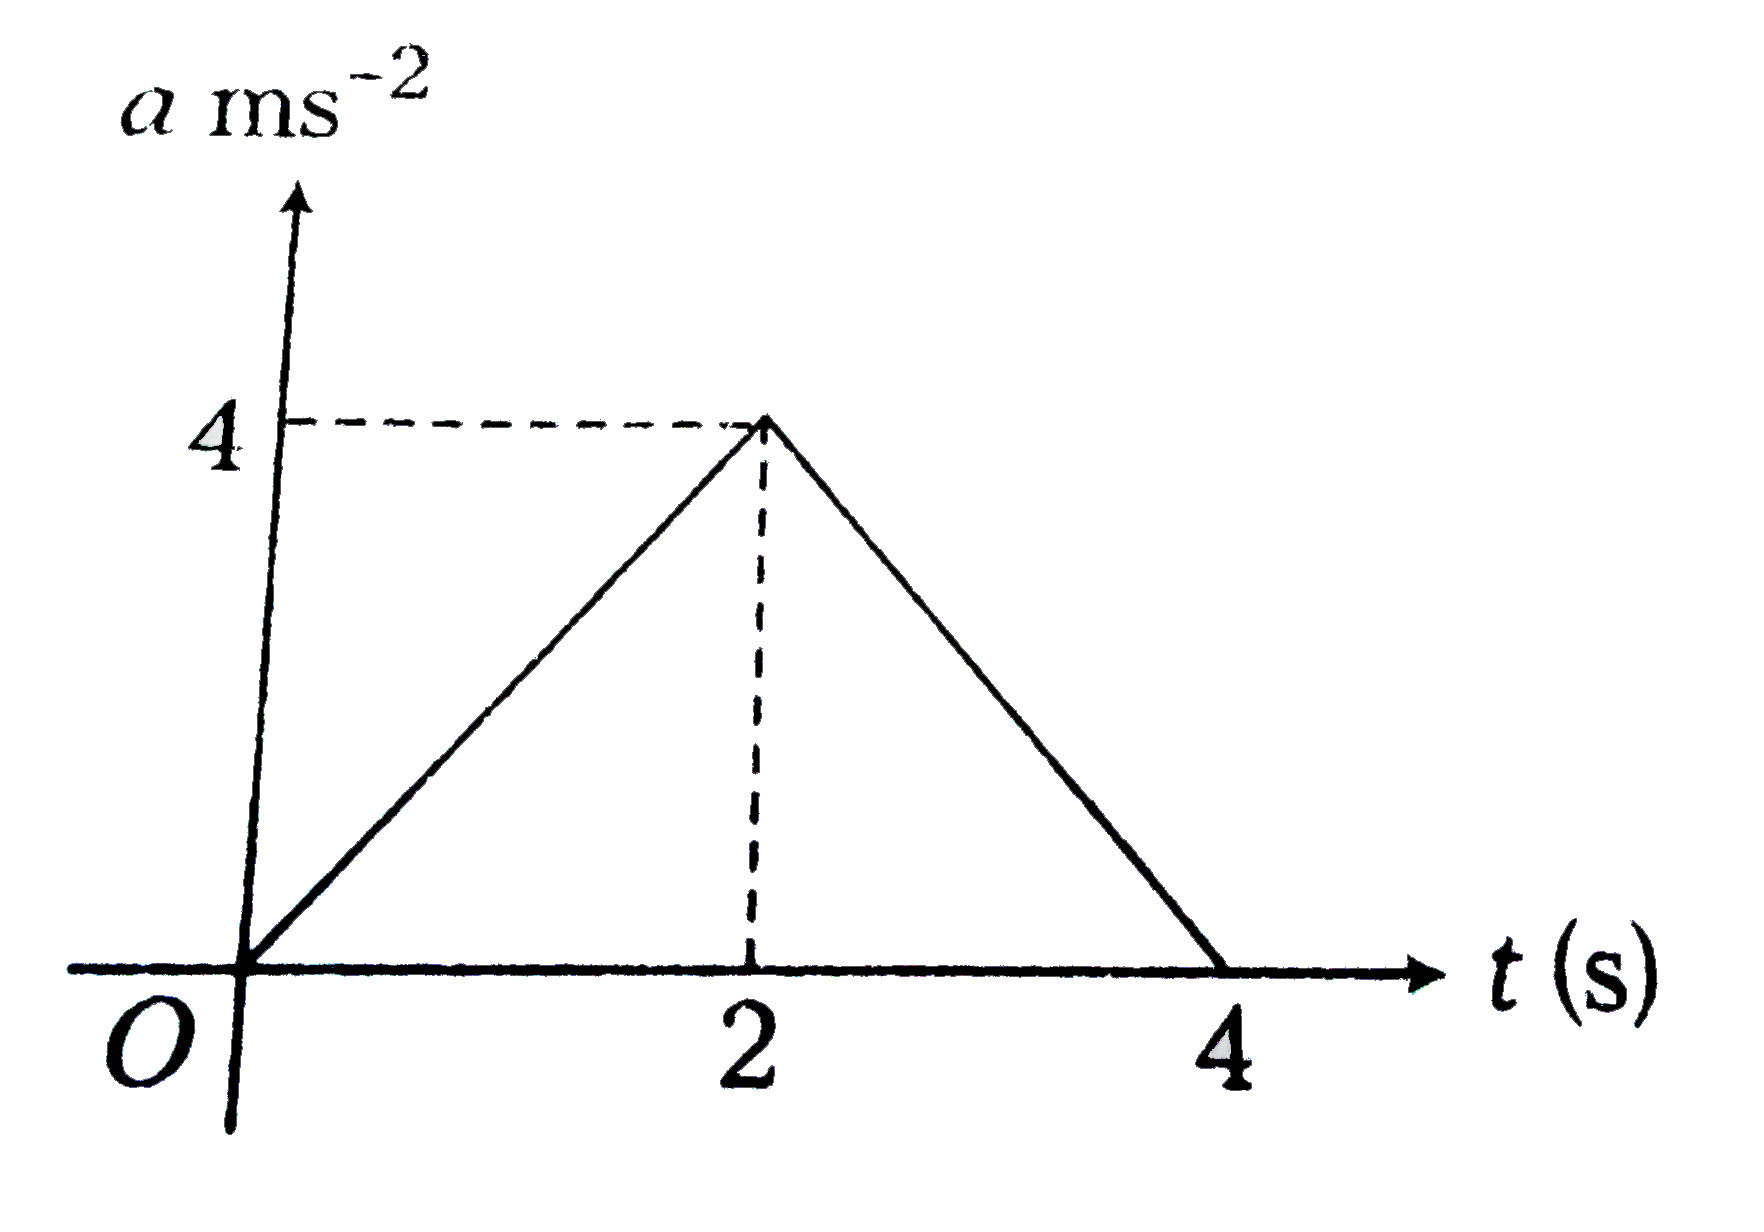
View SolutionThe acceleration time graph of a particle moving along a straight line is as shown in Fig.At what time the particle acquires its initial velocity?
View Solution
Knowledge Check
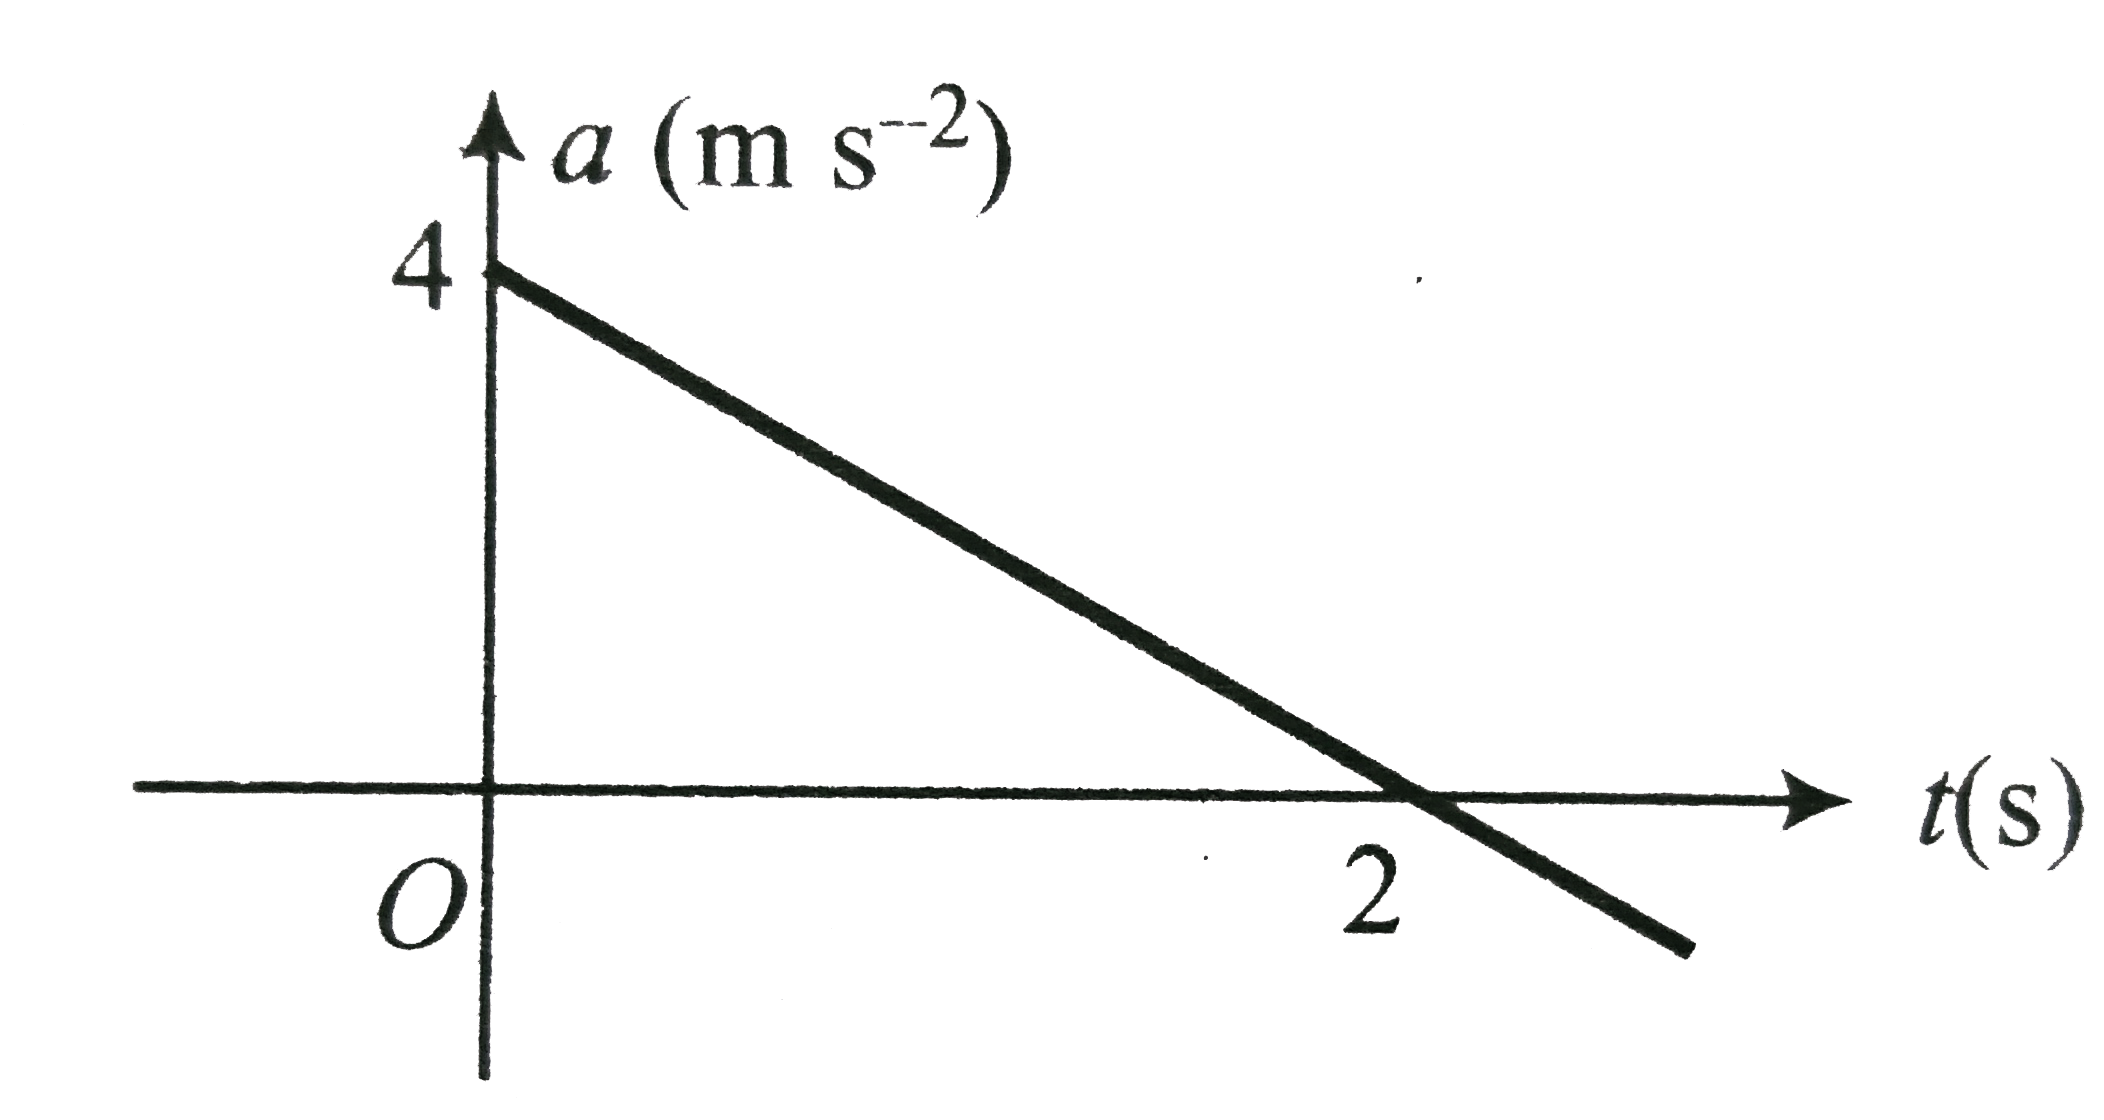
The acceleration-time graph of a particle moving in a straight line is as shown in figure. The velocity of the particle at time t=0 is 2m/s. The velocity after 2 seconds will be
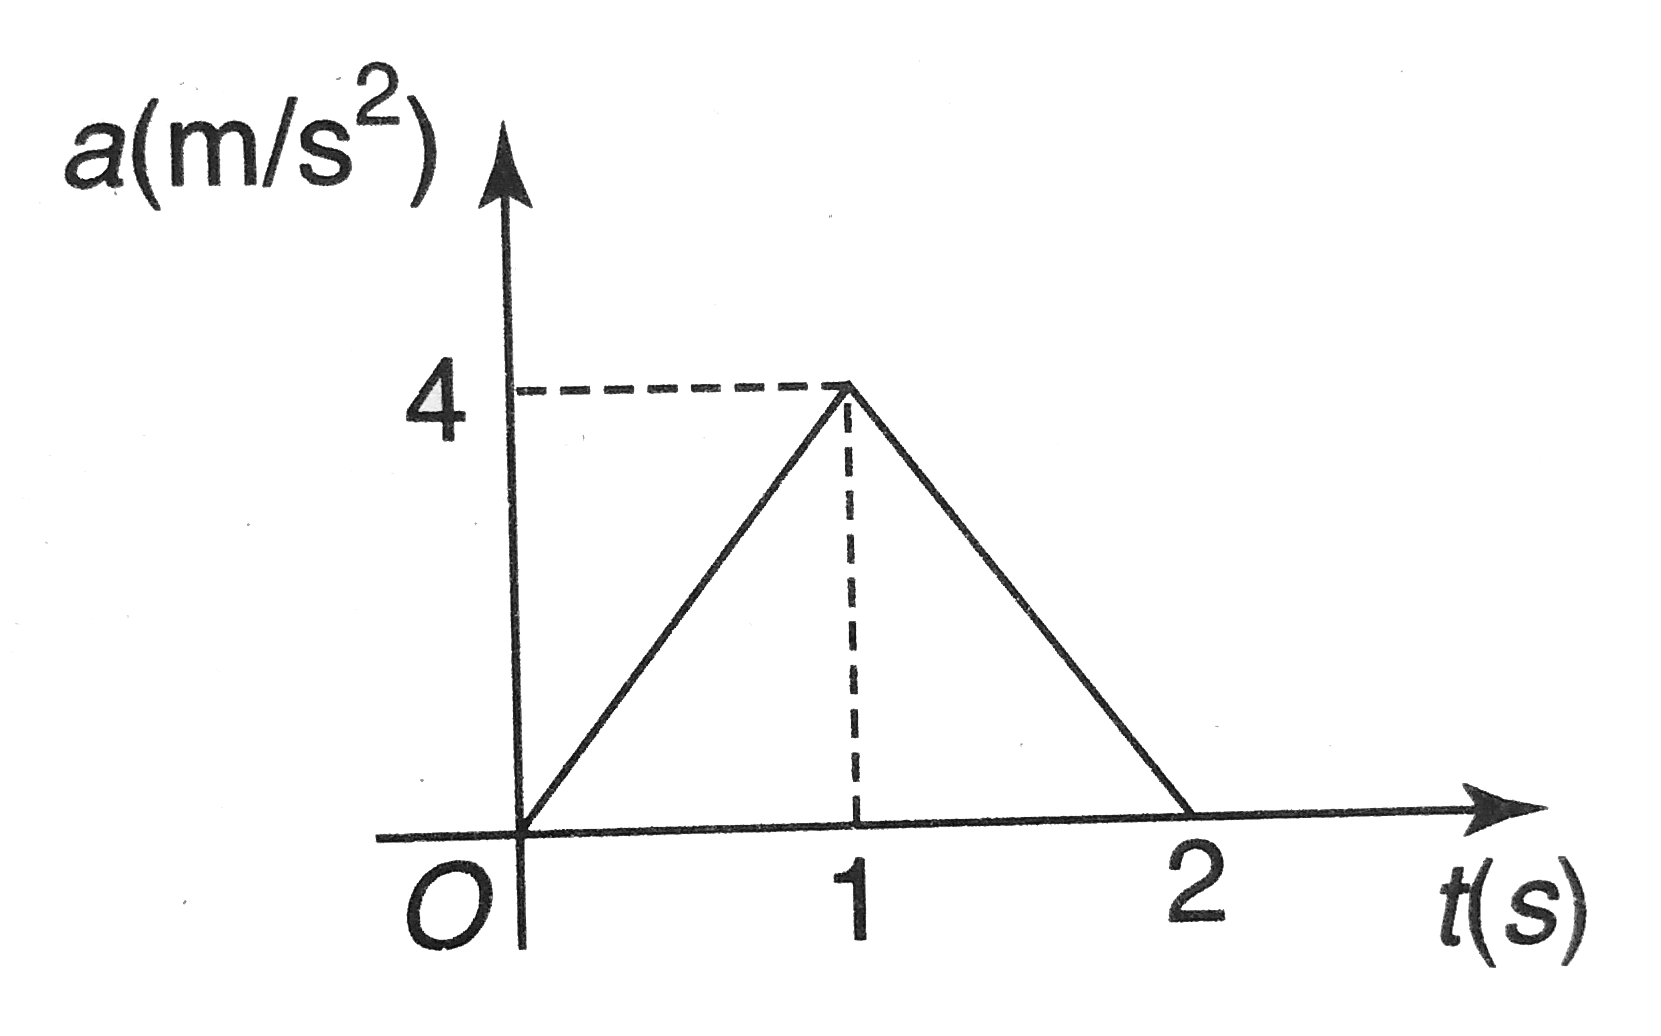 A6m/sB4m/sC2m/sD8m/s
Velocity displacement graph of a particle moving in a straight line is as shown in figure.
 Amagnitude of acceleration of particle is decreasingBmagnitude of acceleration of particlre is increasingCacceleration versus displacement graph straight lineDacceleration versus displacement graph is parabola
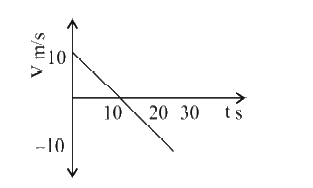
The velocity-time plot for a particle moving on a straight line is shown in figure.
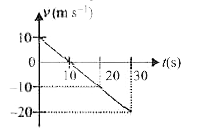 AThe particle has a constant acceleration.BThe particle has never tumed around.CThe particle has zero displacement.DThe average speed in the interval 0 to 10 s is the same as the average speed in the interval 10s to 20 s.
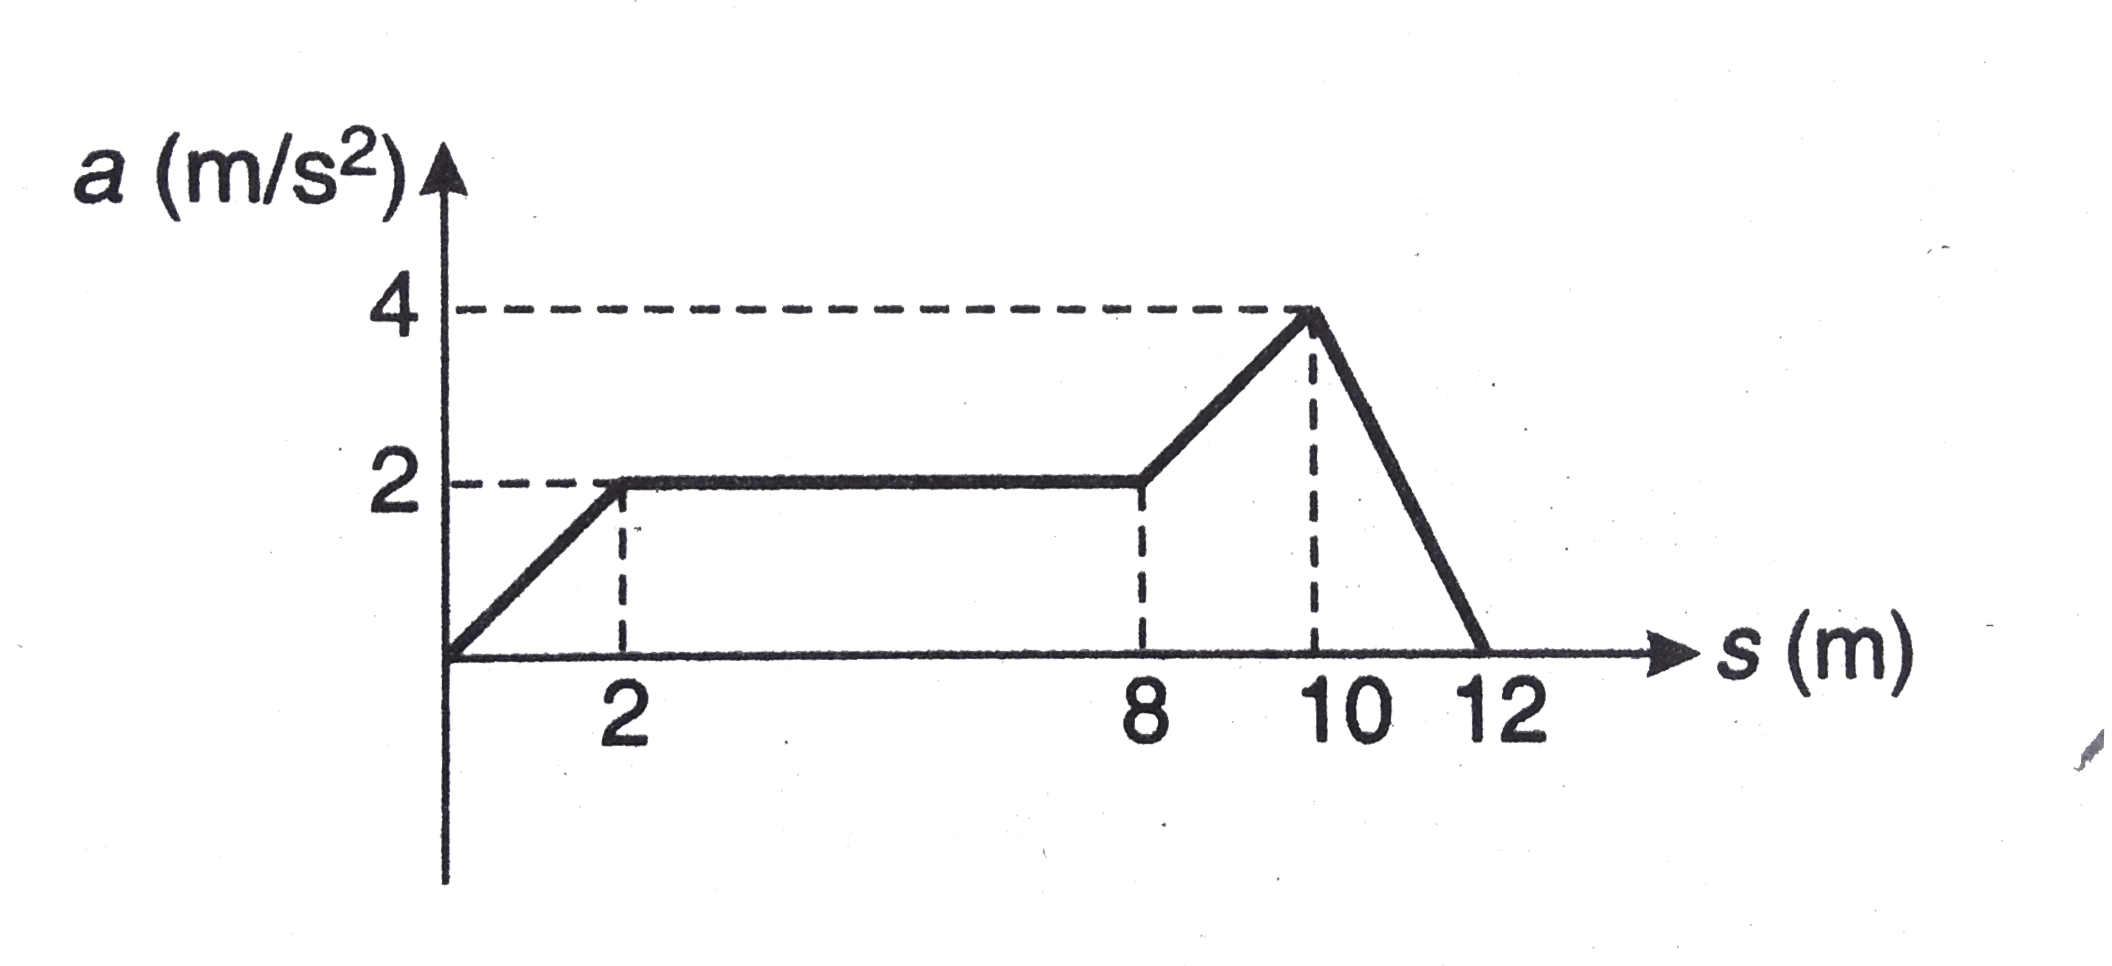
The acceleration-displacement graph of a particle moving in a straight line is as shown in figure, initial velocity of particle is zero. Find the velocity of the particle when displacement of the particle is s=12m.
View SolutionThe acceleration-time graph of a particle moving along a straight line is as shown in figure. At what time the particle acquires its initial velocity ?

View SolutionThe acceleration-time graph of a particle moving along a straight line is as shown in. At what time the particle acquires its initial velocity?
 .
.
View SolutionThe velocity- time plot for a particle moving on a straight line is shown in the figure
View SolutionThe acceleration versus time graph of a particle moving in a straight line is show in figure. The velocity-time graph of the particle would be
 .
.
View Solution