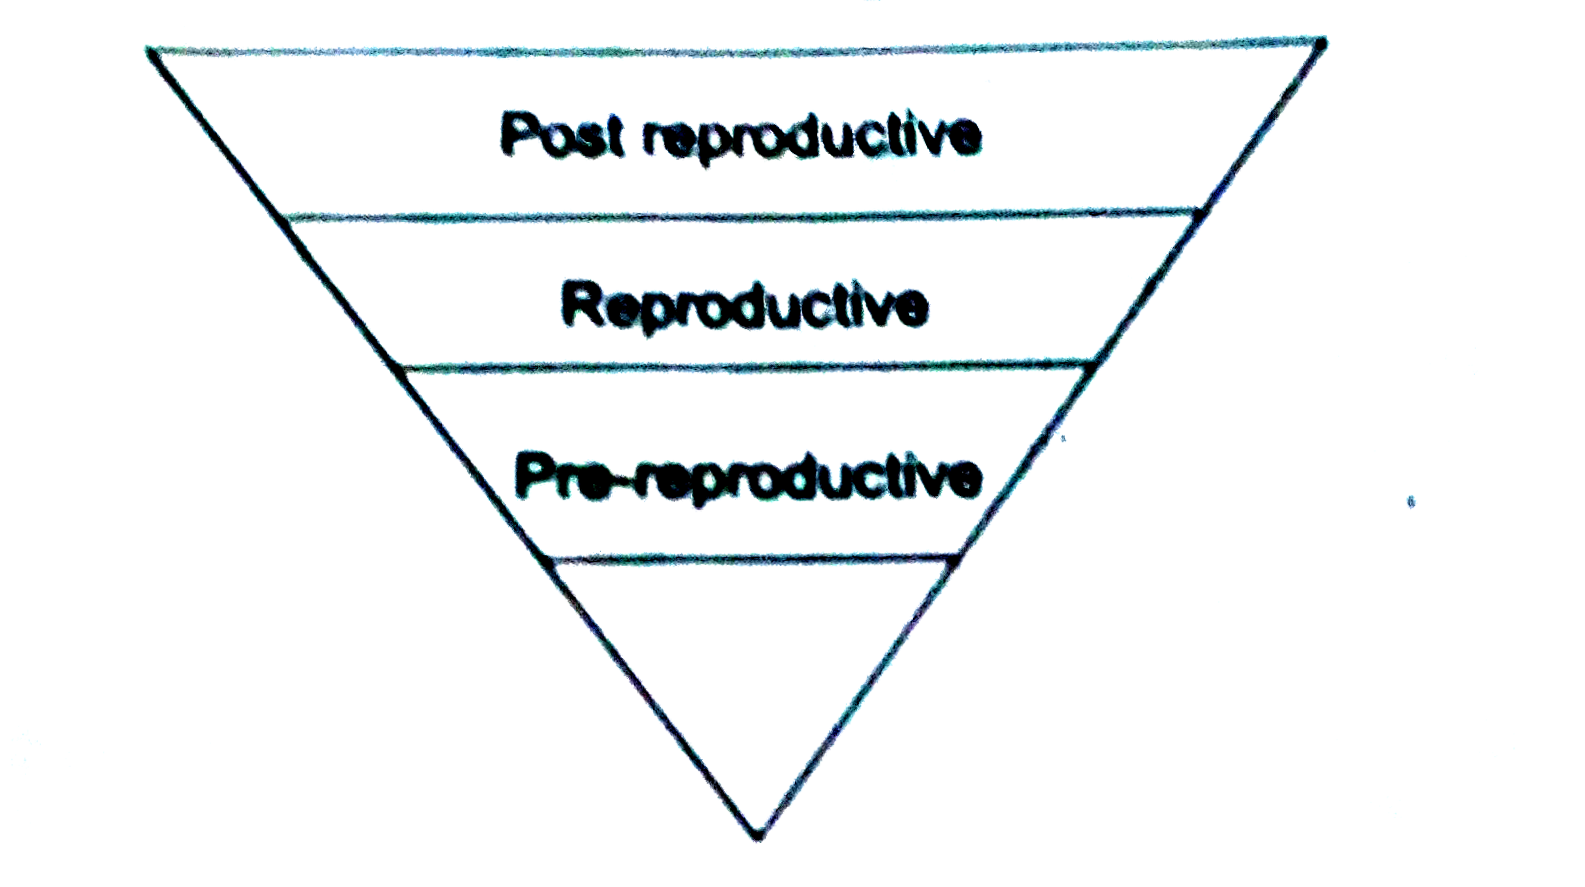
Describe diagrammatic representation of age structure showing declining population.
Video Solution
Text Solution
Age structure showing decline population.

In decline population - Larger number of post reproductive and smaller number of pre-reproductive make population decline.
|
Topper's Solved these Questions
- MARCH 2017BOOK - GURUKUL PUBLICATION - MAHARASHTRA PREVIOUS YEAR PAPERSCHAPTER - MARCH 2017EXERCISE - SECTION-II
24 Videos
- MARCH 2016BOOK - GURUKUL PUBLICATION - MAHARASHTRA PREVIOUS YEAR PAPERSCHAPTER - MARCH 2016EXERCISE - SECTION-II
24 Videos
- MARCH 2018BOOK - GURUKUL PUBLICATION - MAHARASHTRA PREVIOUS YEAR PAPERSCHAPTER - MARCH 2018EXERCISE - SECTION-II
24 Videos
Similar Questions
Knowledge Check
Diagrammatic representation of chromosomes I s
AKaryotypeBIdiogramCChromosome mapDPhenogramThe objective of diagrammatic representation of data is
AClassificationBSummarizationCPresentationDTabulationThe diagrammatic representation of chromosomes is known as
AldiogramBKaryotypeCHolotypeDHomotype
Give diagrammatic representation of pyramid of numbers.
View SolutionDraw diagrammatic representation of life cycle of Dryopteris .
View Solution
The above diagrammatic representation is the formula of -
View SolutionGeometric representation of age structure is a characteristic of :
View Solution_______ is a diagrammatic representation of a program logic.
View Solution
