EXERCISE from NCERT EXEMPLAR DATA HANDLING for Class 7
| Class 7 | MATHS |
| Chapter | DATA HANDLING |
| NCERT EXEMPLAR | EXERCISE |
| Medium | English |
| Academic Year | 2023-2024 |
Question 30
Rohit collected the data regarding weights of students of his class and prepared the following table:

A student is to be selected randomly from his class for some competition. The probability of selection of the student is highest whose weight is in the interval_______________View SolutionQuestion 62
Classify the following events as certain to happen, impossible to happen, may or may not happen:
(a) Getting a number less than 1 on throwing a die.
(b) Getting head when a coin is tossed.
(c) A team winning the match.
(d) Christmas will be on 25 December.
(e) Today moon will not revolve around the earth.
(f) A ball thrown up in the air will fall down after some time.View SolutionQuestion 68
Given below are heights of 15 boys of a class measured in cm:
128, 144, 146, 143, 136, 142, 138, 129, 140, 152, 144, 140, 150, 142, 154.
Find
(a) The height of the tallest boy.
(b) The height of the shortest boy.
(c) The range of the given data.
(d) The median height of the boys.View SolutionQuestion 69
Observe the data and answer the questions that follow:
16, 15, 16, 16, 8, 15, 17
(a) Which data value can be put in the data so that the mode remains the same?
(b) At least how many and which value(s) must be put in to change the mode to 15?
(c) What is the least number of data values that must be put in to change the mode to 17? Name them.View SolutionQuestion 71
Observe the given bar graph carefully and answer the questions that follow.
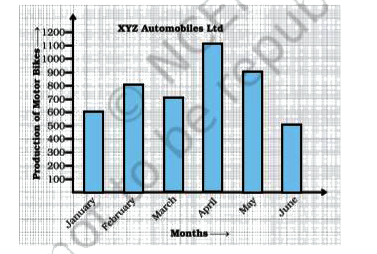
(a) What information does the bar graph depict?
(b) How many motor bikes were produced in the first three months?
(c) Calculate the increase in production in May over the production in January.
(d) In which month the production was minimum and what was it?
(e) Calculate the average (mean) production of bikes in 6 months.View SolutionQuestion 72
The bar graph given below shows the marks of students of a class in a particular subject:
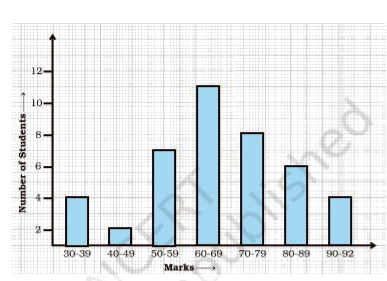
Study the bar graph and answer the following questions:
(a) If 40 is the pass mark, then how many students have failed?
(b) How many students got marks from 50 to 69?
(c) How many students scored 90 marks and above?
(d) If students who scored marks above 80 are given merits then how many merit holders are there?
(e) What is the strength of the class?View SolutionQuestion 73
Study the bar graph given below and answer the questions that follow.
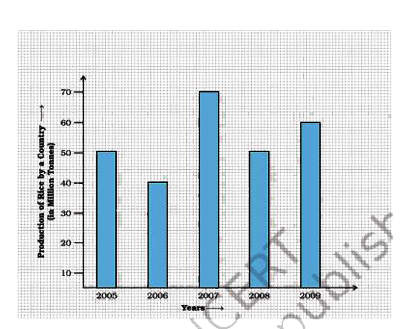
(a) What information does the above bar graph represent?
(b) In which year was production the least?
(c) After which year was the maximum rise in the production?
(d) Find the average production of rice during the 5 years.
(e) Find difference of rice production between years 2006 and 2008.View SolutionQuestion 74
Study the bar graph given below and answer the questions that follow
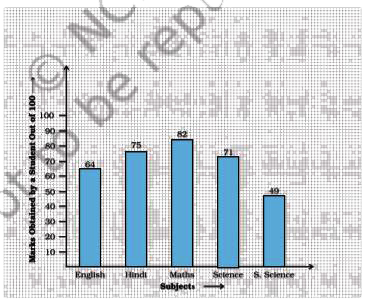
(a) What information is depicted from the bar graph?
(b) In which subject is the student very good?
(c) Calculate the average marks of the student.
(d) If 75 and above marks denote a distinction, then name the subjects in which the student got distinction.
(e) Calculate the percentage of marks the student got out of 500.View SolutionQuestion 75
The bar graph given below represents the circulation of newspapers (dailies) in a town in six languages (the figures are approximated to hundreds).
f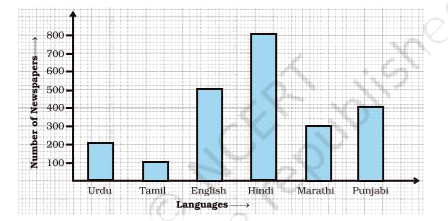
Study the bar graph and answer the following questions:
(a) Find the total number of newspapers read in Hindi, Punjabi, Urdu, Marathi and Tamil.
(b) Find the excess number of newspapers read in Hindi than those in English.
(c) Name the language in which the least number of newspapers are read.
(d) Write the total circulation of newspapers in the town.View SolutionQuestion 76
Study the double bar graphs given belwo and answer the following questions
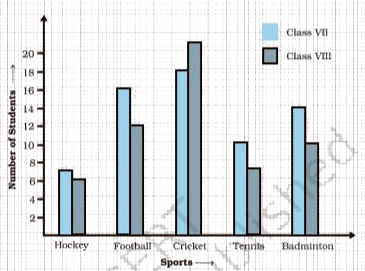
(a) Which sport is liked the most by Class VIII students?
(b) How many students of Class VII like Hockey and Tennis in all?
(c) How many students are there in Class VII?
(d) For which sport is the number of students of Class VII less than that of Class VIII?
(e) For how many sports students of Class VIII are less than Class VII?
(f) Find the ratio of students who like Badminton in Class VII to students who like Tennis in Class VIII.View SolutionQuestion 77
Study the double bar graph shown below and answer the questions that follow:
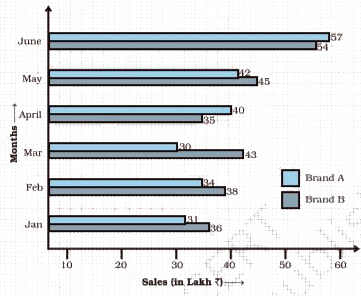
(a) What information is represented by the above double bar graph?
(b) In which month sales of Brand A decreased as compared to the previous month?
(c) What is the difference in sales of both the Brands for the month of June?
(d) Find the average sales of Brand B for the six months.
(e) List all months for which the sales of Brand B was less than that of Brand A.
(f) Find the ratio of sales of Brand A as compared to Brand B for the month of January.View SolutionQuestion 78
Study the double bar graph given below and answer the questions that follow:
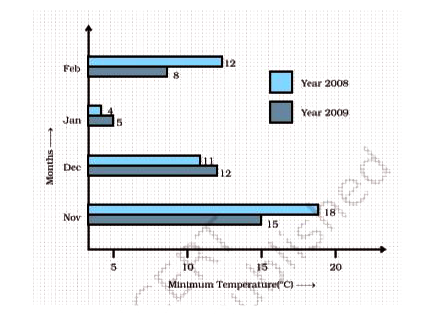
(a) What information is compared in the above given double bar graph?
(b) Calculate the ratio of minimum temperatures in the year 2008 to the year 2009 for the month of November.
(c) For how many months was the minimum temperature in the year 2008 greater than that of year 2009? Name those months.
(d) Find the average minimum temperature for the year 2008 for the four months.
(e) In which month is the variation in the two temperatures maximum?View SolutionQuestion 80
Study the double bar graph and answer the quesions that follow:
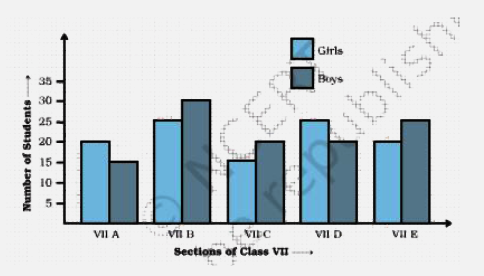
(a) What information does the double bar graph represent?
(b) Find the total number of boys in all sections of Class VII.
(c) In which sections, the number of girls is greater than the number of boys?
(d) In which section, the number of boys is the maximum?
(e) In which section, the number of girls is the least?View SolutionQuestion 81
In a public library, the following observations were recorded by the librarian in a particular week:

(a) Draw a double bar graph choosing an appropriate scale.
(b) On which day, the number of readers in the library was maximum?
(c) What is the mean number of magazine readers?View SolutionQuestion 82
Observe the following data:
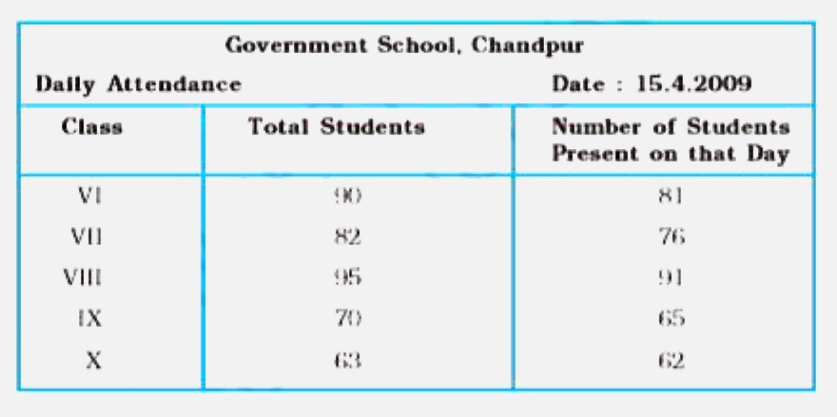
(a) Draw a double bar graph choosing an appropriate scale. What do you infer from the bar graph?
(b) Which class has the maximum number of students?
(c) In which class, the difference of total students and number of students present is minimum?
(d) Find the ratio of number of students present to the total number of students of Class IX.
(e) What per cent of Class VI students were absent?View SolutionQuestion 83
Observe the given data:

(a) Draw a bar graph to represent the above given information.
(b) On which day of the week was the sales maximum?
(c) Find the total sales during the week.
(d) Find the ratio of the minimum sale to the maximum sale.
(e) Calculate the average sale during the week.
(f) On how many days of the week was the sale above the average sales? View SolutionQuestion 84
Below is a list of 10 tallest buildings in India.
This list ranks buildings in India that stand at least 150m (492 ft.) tall, based on standard height measurement. This includes spires and architectural details but does not include antenna marks. Following data is given as per the available information till 2009. Since new buildings are always under construction, go on-line to check new taller buildings.
Use the information given in the table about sky scrapers to answer the following questions:
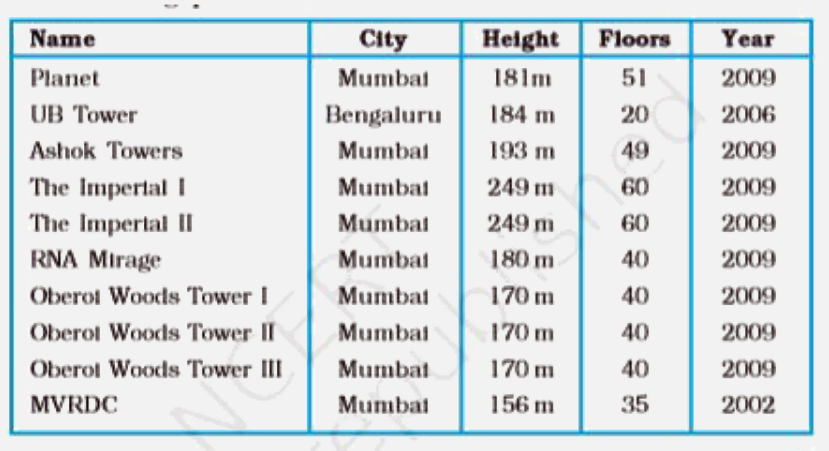
(a) Find the height of each storey of the three tallest buildings and write them in the following table:

(b) The average height of one storey for the buildings given in (a) is
(c) Which city in this list has the largest percentage of skyscrappers? What is the percentage?
(d) What is the range of data?
(e) Find the median of the data.
(f) Draw a bar graph for given data.View SolutionQuestion 85
The marks out of 100 obtained by Kunal and Soni in the Half Yearly Examination are given below:

(a) Draw a double bar graph by choosing appropriate scale.
(b) Calculate the total percentage of marks obtained by Soni.
(c) Calculate the total percentage of marks obtained by Kunal.
(d) Compare the percentages of marks obtained by Kunal and Soni/
(e) In how many subjects did Soni get more marks than Kunal? Which are those subjects?
(f) Who got more marks in S. Science and what was the difference of marks?
(g) In which subject the difference of marks was maximum and by how much? "View SolutionQuestion 86
The students of Class VII have to choose one club from Music, Dance, Yoga, Dramatics, Fine arts and Electronics clubs. The data given below shows the choices made by girls and boys of the class. Study the table and answer the questions that follow:

(a) Draw a double bar graph using appropriate scale to depict the above data.
(b) How many students are there in Class VII?
(c) Which is the most preferred club by boys?
(d) Which is the least preferred club by girls?
(e) For which club the difference between boys and girls is the least?
(f) For which club is the difference between boys and girls the maximum?View SolutionQuestion 87
The data given below shows the production of motor bikes in a factory for some months of two consecutive years.

Study the table given above and answer the following questions:
(a) Draw a double bar graph using appropriate scale to depict the above information and compare them.
(b) In which year was the total output the maximum?
(c) Find the mean production for the year 2007.
(d) For which month was the difference between the production for the two years the maximum?
(e) In which month for the year 2008, the production was the maximum?
(l) In which month for the year 2007, the production was the least?View SolutionQuestion 88
The table below compares the population (in hundreds) of 4 towns over two years:

Study the table and answer the following questions:
(a) Draw a double bar graph using appropriate scale to depict the above information.
(b) In which town was the population growth maximum?
(c) In which town was the population growth least?View SolutionQuestion 89
The table below gives the data of tourists visiting 5 hill stations over two consecutive years. Study the table and answer the questions that follow:

(a) Draw a double bar graph to depict the above information using appropriate scale.
(b) Which hill station was visited by the maximum number of tourists in 2008?
(c) Which hill station was visited by the least number of tourists in 2009?
(d) In which hill stations was there increase in number of tourists in the year 2009?View SolutionQuestion 90
The table below gives the flavours of ice cream liked by children (boys and girls) of a society.

Study the table and answer the following questions:
(a) Draw a double bar graph using appropriate scale to represent the above information.
(b) Which flavour is liked the most by the boys?
(c) How many girls are there in all?
(d) How many children like chocolate flavour of ice cream?
(e) Find the ratio of children who like strawberry flavour to vanilla flavour of ice cream.View Solution
