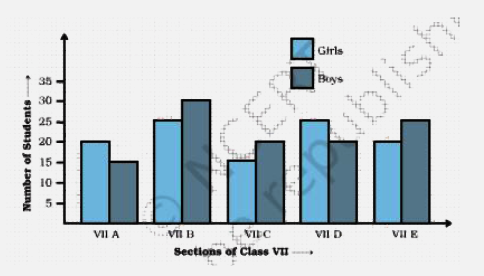
Study the double bar graph and answer the quesions that follow:

(a) What information does the double bar graph represent?
(b) Find the total number of boys in all sections of Class VII.
(c) In which sections, the number of girls is greater than the number of boys?
(d) In which section, the number of boys is the maximum?
(e) In which section, the number of girls is the least?
Step by step video & image solution for Study the double bar graph and answer the quesions that follow: (a) What information does the double bar graph represent? (b) Find the total number of boys in all sections of Class VII. (c) In which sections, the number of girls is greater than the number of boys? (d) In which section, the number of boys is the maximum? (e) In which section, the number of girls is the least? by Maths experts to help you in doubts & scoring excellent marks in Class 7 exams.
Updated on:21/07/2023Topper's Solved these Questions
- DATA HANDLINGBook:NCERT EXEMPLARChapter:DATA HANDLINGExercise:THINK AND DISCUSS
Explore 3 Videos
- DATA HANDLINGBook:NCERT EXEMPLARChapter:DATA HANDLINGExercise:EXERCISE(TRUE OR FALSE)
Explore 18 Videos
- COMPARING QUANTITIESBook:NCERT EXEMPLARChapter:COMPARING QUANTITIESExercise:THINK AND DISCUSS
Explore 24 Videos
- EXPONENTS AND POWERSBook:NCERT EXEMPLARChapter:EXPONENTS AND POWERSExercise:EXERCISE
Explore 136 Videos
Similar Questions
Knowledge Check

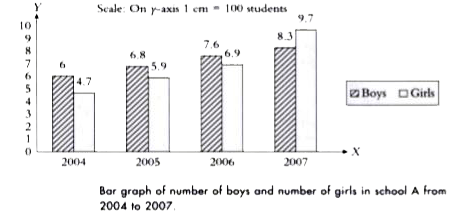
In which year the number of girls is more than the number of boys?A2004B2005C2006D2007In a class, if 60% of the students are boys and the number of girls is 36, then the number of boys is:
A60B58C65D54The number of boys in a class is 2/5 of the number of girls. If the number of boys in the class is 10, find the number of girls.
A25B20C15D30
. The number of boys in a class is 16% more than the girls. Number of boys in the class, respectively from the number of girls What is the ratio?
View SolutionIn a school, the number of girls is 50 more than the number of boy The total number of students is 1070. Find the number of girls.
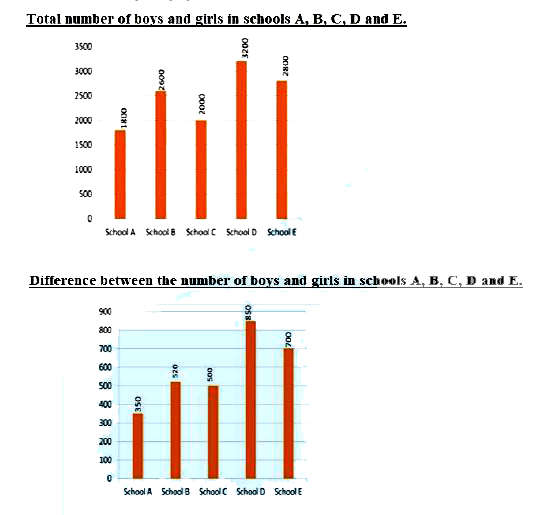
View SolutionStudy the following bar graph and answer the questions given below.

What is the ratio of numbers of boys to the number of girls in school E?
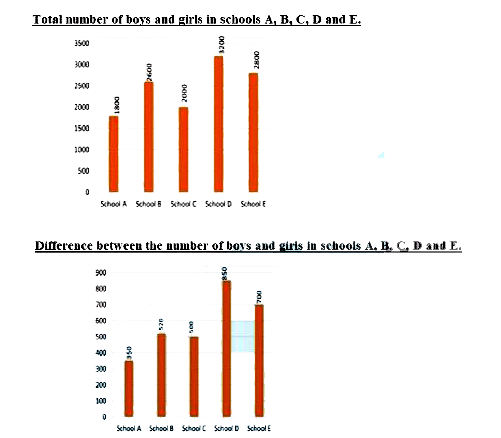
View SolutionStudy the following bar graph and answer the questions given below.

The number of boys in school B is what percentage of the total number of students in that school ?
View SolutionIn a class, the no. of boys is more than the no. of girls by 12% of the total strength. The ratio of boys to girls is :
View Solution

