Complete Solutions to Question Bank - 24 (a) of chapter DATA HANDLING of Class 7 book with complete answers and questions
| Class 7 | MATHS |
| Chapter | DATA HANDLING |
| S CHAND IIT JEE FOUNDATION | Question Bank - 24 (a) |
| Number Of Questions | 20 |
| Academic Year | 2023-24 |
Which of the following represents statistical data ?
02:30View SolutionIn statistics, a suitable graph for representing the partitioning of total into sub parts is
01:20View SolutionThe following table gives the areas of the oceans of the word :
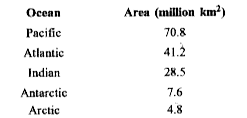
A pie diagram of this data is to be drawn. What is the angle which the sector representing Pacific Ocean subtends at the centre ?02:44View SolutionWhich of the following statements is not correct for a bar graph ?
02:20View SolutionThe given double graph shows the average heights of boys and girls at specific ages. Which conclusion is supported by the graph ?
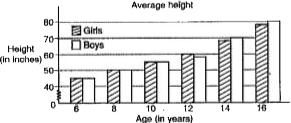 01:31View Solution
You want to display a set of data showing the number of students in the line for lunch in the school canteen every 15 minutes during the lunch - break . Which graph shall display the data most appropriately ?
01:23View SolutionThe given line graph shows the growth rate of a kitten . During which 2 - month period, the kitten's weight increased the most
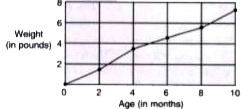 02:17View Solution
From the pie graph shown alongside . Find the per cent of students that are seventh grades
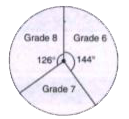 01:32View Solution
The given pie- chart shows the marks scored by a students in five different subjects - English, Hindi, Mathematics, Science and Social Science. Assuming that the total marks obtained for the examination are 540 , find the subject in which the student scored `22.2%` marks
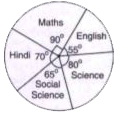 02:38View Solution
The following bar graph shows the rainfall at selected locations in certain months.
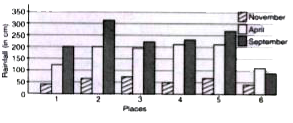
Which of the following statements is correct :01:50View SolutionThe data given below are the times in minutes, it takes seven students to go to school from their homes . Which statement about the data is false ?
11, 6, 22, 7, 10, 6, 1503:22View SolutionA variate takes 11 values which are arranged in ascending order of their magnitudes. It if found that 4th, 6th and 8th observations are 8, 6 and 4 respectively. What is the median of the distribution ?
01:07View SolutionFrom a series of 50 observations, an observation with the value of 45 is dropped, but the mean remains the same . What was the mean of 50 observations ?
02:01View SolutionA person made 165 telephone calls in the month of May in a year . It was Friday on 1st May of the year. The average of telephone calls on Sundays of the month was 7. What was the average of the telephone calls per day on the rest days of the month
02:42View SolutionThe mean of he marks in Statistics of 100 students in a class was 72 . The mean of marks for boys was 75, while their number was 70. The mean of marks of girls in the class was
02:13View SolutionThe numbers 4 and 9 have frequencies x and (x - 1) respectively. If their arithmetic mean is 6, then x is equal to :
01:18View SolutionIf the median of `x/5,x/4,x/2,x and x/3, "where"xgt0,` is 8, find the value of x
HINT Arranging the observation in ascending we have `x/5,x/4,x/3,x/2,x`
`"Median"=x/3=8`01:26View SolutionThe frequency distribution of discrete data given below, the frequency x against value 0 is missing. Variable `x : 0 1 2 3 4 5` Frequency `f: x 20 40 40 20 4 ` If the mean is `2.5,` then the missing frequency x will be
02:13View SolutionThe average of ten numbers is 7. If each number is multiplied by 12, then the average of the new set of numbers is : (a) 7 (b) 19 (c) 82 (d) 84
02:10View SolutionThe arithmetic mean of the scores of a group of students in a test was 52. The brightest 20% of them secured a mean score of 80 and the dullest 25% a mean score of 31. The mean score of remaining 55% is :
02:24View Solution
Question Bank - 24 (a) questions and complete solutions for chapter DATA HANDLING of S CHAND IIT JEE FOUNDATION of Class 7
