Complete Solutions to Olympiad/HOTS Corner of chapter DATA HANDLING of Class 6 book with complete answers and questions
| Class 6 | MATHS |
| Chapter | DATA HANDLING |
| MTG IIT JEE FOUNDATION | Olympiad/HOTS Corner |
| Number Of Questions | 10 |
| Academic Year | 2023-24 |
Study the bar graph given below and answer the following questions.
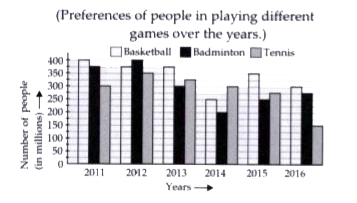
From 2011 to 2016, find the difference between the total number of people who preferred to play Basketball and Badminton (in millions) ?03:00View SolutionStudy the bar graph given below and answer the following questions.
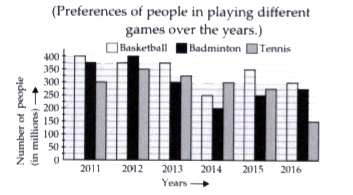
How many people (in millions) have preferred to play Tennis in all years altogether ?03:10View SolutionStudy the given graph carefully and answer the following questions.
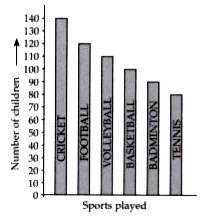
What fraction of the total number of children plays football ?02:11View SolutionStudy the given graph carefully and answer the following questions.
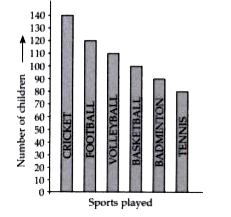
The difference between the number of children who pay tennis and cricket together & basketball and volleyball together is02:33View SolutionThe given bar graph shows number of cars washed by five friends to raise money for local children hospital.
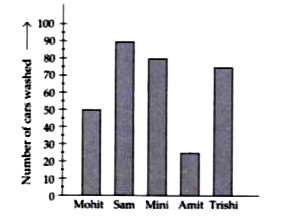
What is the difference between the number of cars washed by (Trishi and Sam) & (Mohit and Mini) ?03:26View SolutionThe given table shows the number of chapatis Ms sharma made on each day in a week.
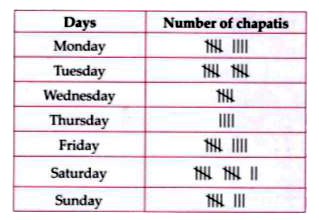
How many chapatis did she make in the whole week ?02:16View SolutionThe given table shows the number of chapatis Ms sharma made on each day in a week.
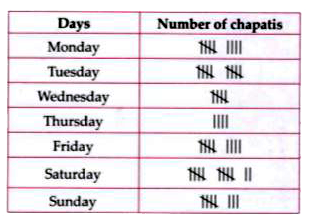
If each chapati was made using 9g of flour, then quantity of flour used on Friday was ______ g.02:14View SolutionThe given bar graph shows the sale of different brands of shirts in a shop in one month.
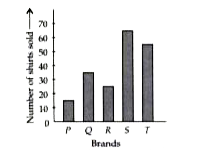
(i) How many total shirts are sold in the month ?01:45View SolutionThe total number of students who applied for scholarship in the last five years is given below :

Using the symbol to represent 500 students, answer the following questions.
(i) How many symbols are needed to represent the number of students in 2010 ?
(ii) How many more symbols are needed to represent the number of students in 2012 than in 2009 ?03:59View SolutionThe given graph shows the sale of story books in a bookshop for the first 6 months.
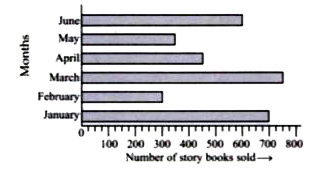
In which month, the sale of story books was `(5)/(4)` of the sale of books in June ?02:13View Solution
Olympiad/HOTS Corner questions and complete solutions for chapter DATA HANDLING of MTG IIT JEE FOUNDATION of Class 6
All Exercises from MTG IIT JEE FOUNDATION Class 6 MATHS DATA HANDLING
- Exercise (Assertion & Reason Type )
- Exercise (Comprehension Type )
- Exercise (Match the following)
- Exercise (Multiple Choice Questions) Level -1
- Exercise (Multiple Choice Questions) Level -2
- Exercise (Subjective Problems (Integer/Numerical Value Type )
- Exercise (Subjective Problems (Long Answer Type)
- Exercise (Subjective Problems (Short Answer Type))
- Exercise (Subjective Problems (Very Short Answer Type))
- Illustrations
- NCERT Section (Exercise 9.1)
- NCERT Section (Exercise 9.2)
- NCERT Section (Exercise 9.3)
- NCERT Section (Exercise 9.4)
- Olympiad/HOTS Corner
- Solved Examples
