Complete Solutions to Exercise (Multiple Choice Questions) Level -2 of chapter DATA HANDLING of Class 6 book with complete answers and questions
| Class 6 | MATHS |
| Chapter | DATA HANDLING |
| MTG IIT JEE FOUNDATION | Exercise (Multiple Choice Questions) Level -2 |
| Number Of Questions | 16 |
| Academic Year | 2023-24 |
The given pictograph shows the number of pizzas delivered by pizza hut during a week.
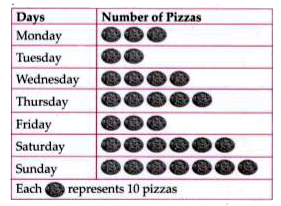
On which day, the number of pizzas delivered is minimum?01:41View SolutionThe given pictograph shows the number of pizzas delivered by pizza hut during a week.
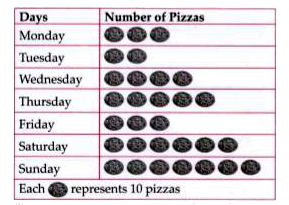
Find the number of pizzas delivered on Sunday.01:26View SolutionThe given pictograph shows the number of animals in 5 different zoos.
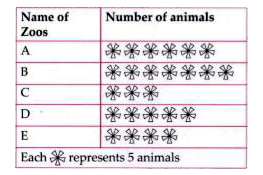
Which of the following statements is correct?03:03View SolutionOn the scale, 1 unit length = 10 crore, the bar of length 6 units will represent ______ crore.
01:22View SolutionThe following pictograph shows favourite ice cream flavours of boys in a colony.
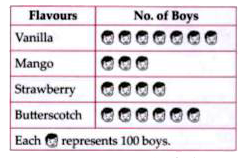
Which flavour is liked least by the boys?01:20View SolutionThe following pictograph shows favourite ice cream flavours of boys in a colony.
Number of boys liking vanilla flavoured ice cream are _______ .View SolutionRead the bar graph given below and answer the following questions.
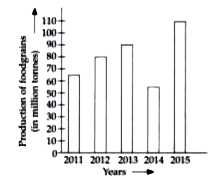
What is the ratio of the production of foodgrains in 2011 to that in 2014?02:55View SolutionRead the bar graph given below and answer the following questions.
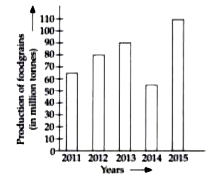
Find the difference between the production of foodgrains in million tonnes) in the year 2012 and 2015.01:56View SolutionThe following pictograph shows the sale of cars of different colours in a showroom.
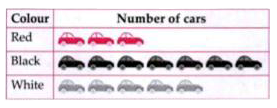

How many less blue cars were sold than red and gray cars together?02:08View SolutionThe following pictograph shows the sale of cars of different colours in a showroom.
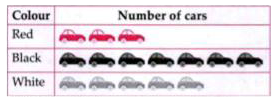

The ratio of white cars to black cars sold is02:07View SolutionLook at the bar graph and answer the following questions.
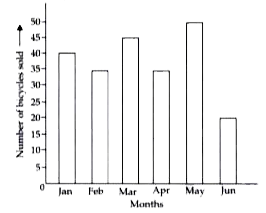
In which month 40 bicycles were sold?01:13View SolutionLook at the bar graph and answer the following questions.
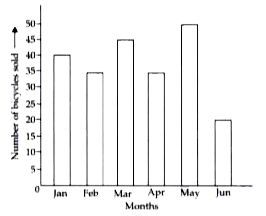
How many less bicycles sold in June than in March?01:38View SolutionObserve the bar graph and answer the following questions.
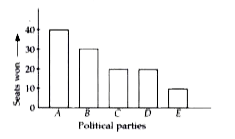
Which two political parties won the same number of seats?01:18View SolutionObserve the bar graph and answer the following questions.
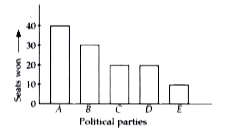
What is the total number of seats won by party A and party B?01:19View SolutionObserve the following pictograph and answer the following questions.
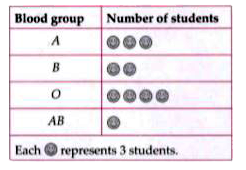
The ratio of the frequencies of blood group AB to blood group O is01:28View SolutionObserve the following pictograph and answer the following questions.
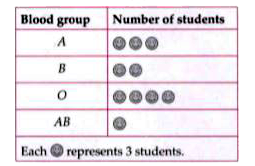
The ratio of the frequencies of blood group A to blood group B is01:27View Solution
Exercise (Multiple Choice Questions) Level -2 questions and complete solutions for chapter DATA HANDLING of MTG IIT JEE FOUNDATION of Class 6
All Exercises from MTG IIT JEE FOUNDATION Class 6 MATHS DATA HANDLING
- Exercise (Assertion & Reason Type )
- Exercise (Comprehension Type )
- Exercise (Match the following)
- Exercise (Multiple Choice Questions) Level -1
- Exercise (Multiple Choice Questions) Level -2
- Exercise (Subjective Problems (Integer/Numerical Value Type )
- Exercise (Subjective Problems (Long Answer Type)
- Exercise (Subjective Problems (Short Answer Type))
- Exercise (Subjective Problems (Very Short Answer Type))
- Illustrations
- NCERT Section (Exercise 9.1)
- NCERT Section (Exercise 9.2)
- NCERT Section (Exercise 9.3)
- NCERT Section (Exercise 9.4)
- Olympiad/HOTS Corner
- Solved Examples
