The given line graph shows the growth rate of a kitten . During which 2 - month period, the kitten's weight increased the most
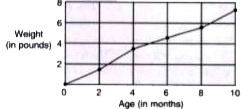
0 to 2 months
2 to 4 months
4 to 6 months
6 to 8 months
The correct Answer is:B
Step by step video, text & image solution for The given line graph shows the growth rate of a kitten . During which 2 - month period, the kitten's weight increased the most by Maths experts to help you in doubts & scoring excellent marks in Class 7 exams.
Related Playlists
- BOOK - S CHAND IIT JEE FOUNDATIONCHAPTER - DATA HANDLING EXERCISE - Question Bank - 24 (b)15videos
DATA HANDLING
- BOOK - S CHAND IIT JEE FOUNDATIONCHAPTER - DATA HANDLING EXERCISE - Self Assessment Sheet - 2410videos
DATA HANDLING
- BOOK - S CHAND IIT JEE FOUNDATIONCHAPTER - DATA HANDLING EXERCISE - Self Assessment Sheet - 2410videos
DATA HANDLING
- BOOK - S CHAND IIT JEE FOUNDATIONCHAPTER - CIRCUMFERENCE AND AREA OF A CIRCLE EXERCISE - SELF ASSESSMENT SHEET - 2210videos
CIRCUMFERENCE AND AREA OF A CIRCLE
- BOOK - S CHAND IIT JEE FOUNDATIONCHAPTER - DECIMALS EXERCISE - SELF ASSESSMENT SHEET10videos
DECIMALS
Similar Practice Problems
- Question 1 - Select One
During puberty, the rate of growth increases due to
Athyroxine hormoneBadrenalineCinsulinDNone of these - Question 1 - Select One
Which period shows negative growth?
AInfancyBChildhoodCAdolescenceDOld age - Question 1 - Select One
During the period between 1973 to 2003, the production has increased most in the
AMain sectorBPrimary sectorCTertiary sectorDNone of these
Similar Questions
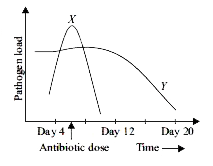
The given graph shows the pathogen load in the body of a person during the period of sickness.
Now select the correct option regarding this.
 View Solution
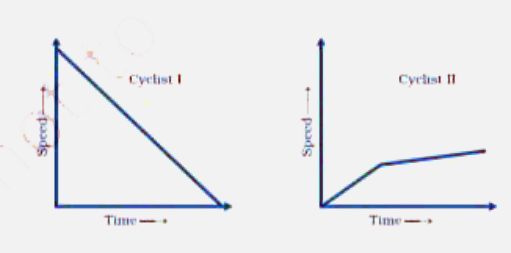
The given graphs show the progress of two different cyclists during a ride. For each graph, describe the rider’s progress over the period of time.
 View Solution
The given bar graph shows the sale of different brands of shirts in a shop in one month.
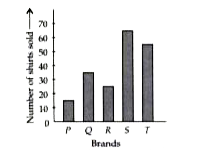
(i) How many total shirts are sold in the month ?View SolutionRead the graph and answer the following questions
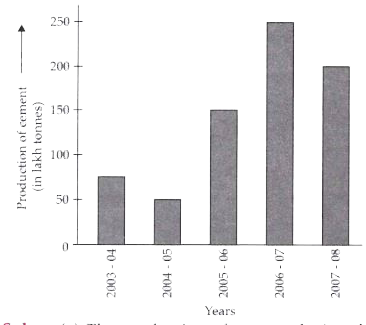
During which period, the production was minimum ?View SolutionThe line graph shows the production of product A and B during the period 2004 to 2009 and the second line graph shows the percentage sale of these products
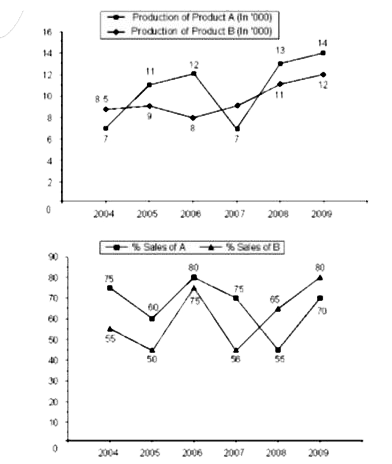
In the given line graph, what is the total sale of products A and B in the year 2007View SolutionThe line graph shows the production of product A and B during the period 2004 to 2009 and the second line graph shows the percentage sale of these products
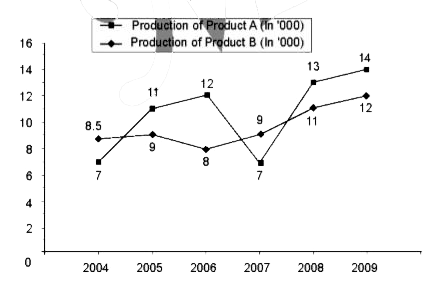 br>
br> 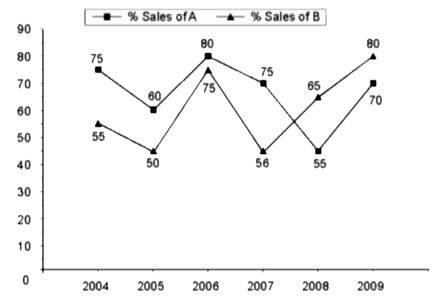
In the given line graph, what is the total sale of products A in the year 2005 and 2009 taken together?View SolutionThe line graph shows the monthly expenditure by two families in hundreds
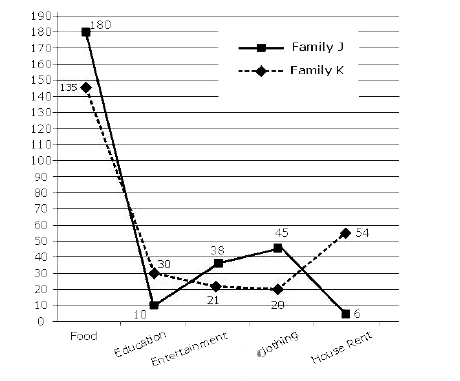
In the given line graph if the monthly income of Family K increase to 37200 what will be the increase in expenditure on entertainmentView Solution

